Races in Baltimore, Vermont (VT) Detailed Stats
Ancestries, Foreign-born residents, place of birth

Recent posts about races in Baltimore, Vermont on our local forum with over 2,400,000 registered users:
 | Retire to Vermont (39 replies) |
| Rethinking Vermont- Cost of Living? (46 replies) |
| Vermont Seen as Worst Tax State for Retirees (74 replies) |
| sigh (13 replies) |
| Springfield, VT - really that bad?... (108 replies) |
| Courtesy in Vermont (59 replies) |
Latest news about races in Baltimore, VT collected exclusively by city-data.com from local newspapers, TV, and radio stations
1.2% of Baltimore, VT residents are foreign-born , which is 233.3% less than the foreign-born rate of 4.0% across the entire state of Vermont.
Race distribution in Baltimore

- 24497.6%White alone
- 20.8%Two or more races
- 10.4%Hispanic
- 10.4%Asian alone
- 10.4%Black alone
- 10.4%American Indian alone

2000
2022
-
- 585,43196.2%White alone
- 6,8091.1%Two or more races
- 5,5040.9%Hispanic
- 5,1600.8%Asian alone
- 2,9210.5%Black alone
- 2,3250.4%American Indian alone
- 5570.09%Other race alone
- 1200.02%Native Hawaiian and Other
Pacific Islander alone

-
- 583,54690.2%White alone
- 27,3404.2%Two or more races
- 14,7702.3%Hispanic
- 11,5121.8%Asian alone
- 6,2641.0%Black alone
- 2,5210.4%Other race alone
- 1,0520.2%American Indian alone
- 590.01%Native Hawaiian and Other
Pacific Islander alone

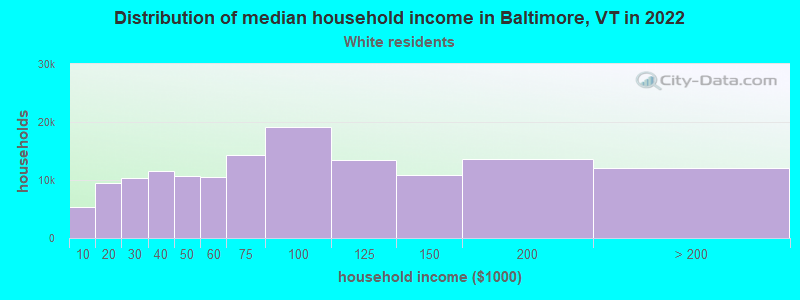
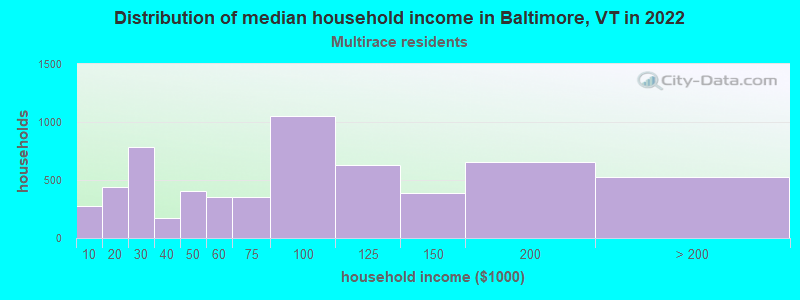
Income and house value in Baltimore
- Median household income in 2022
- $80,863White non-Hispanic householders
- $29,003Two or more races householders
- Median 2022 house value
- $228,479White Non-Hispanic householders
- $112,121Two or more races householders
Household income for White non-Hispanic householders
Household income for Two or more races householders
Foreign-born residents in Baltimore
3 residents are foreign born
| This city: | 1.2% |
| Vermont: | 3.8% |
Ancestries in Baltimore

- 6020.2%English
- 4314.5%French
- 4314.5%Irish
- 3612.1%Other
- 217.1%French Canadian
- 217.1%Scottish
- 175.7%United States
- 165.4%Polish
- 124.0%German
- 72.4%Italian
- 62.0%Scotch-Irish
- 31.0%Czech
- 31.0%Norwegian
- 31.0%West Indian
- 20.7%Hungarian
- 20.7%Swedish
- 20.7%Welsh

Zip codes: 05143.