Races in Bangor, Maine (ME) Detailed Stats
Data:
Races - White alone (%)
Races - White alone (% change since 2000)
Races - Black alone (%)
Races - Black alone (% change since 2000)
Races - American Indian alone (%)
Races - American Indian alone (% change since 2000)
Races - Asian alone (%)
Races - Asian alone (% change since 2000)
Races - Hispanic (%)
Races - Hispanic (% change since 2000)
Races - Native Hawaiian and Other Pacific Islander alone (%)
Races - Native Hawaiian and Other Pacific Islander alone (% change since 2000)
Races - Two or more races(%)
Races - Two or more races(% change since 2000)
Races - Other race alone (%)
Races - Other race alone (% change since 2000)
Racial diversity
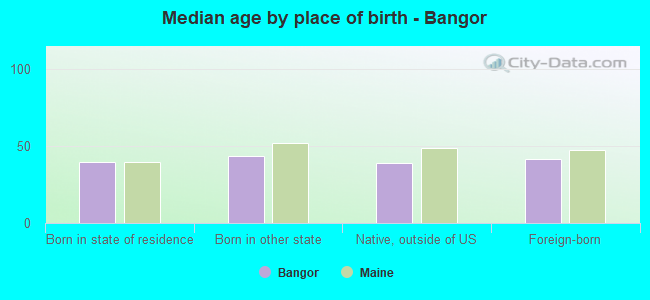
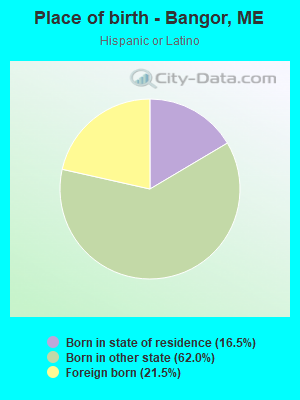
Place of birth - Born in state of residence (%)
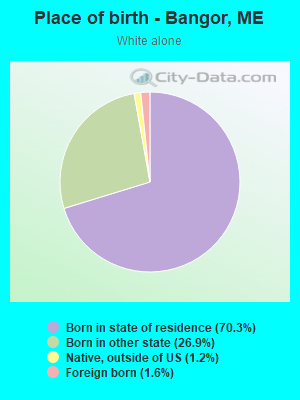
Place of birth - Born in state of residence (%) - White
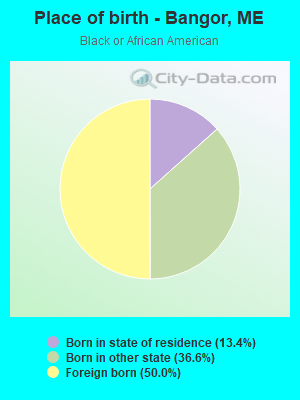
Place of birth - Born in state of residence (%) - Black or African American
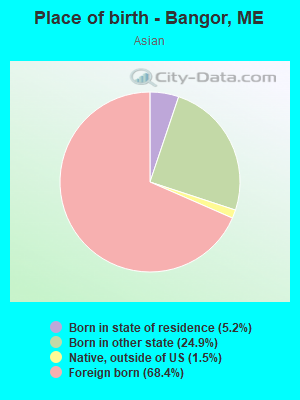
Place of birth - Born in state of residence (%) - Asian
Place of birth - Born in state of residence (%) - Hispanic or Latino
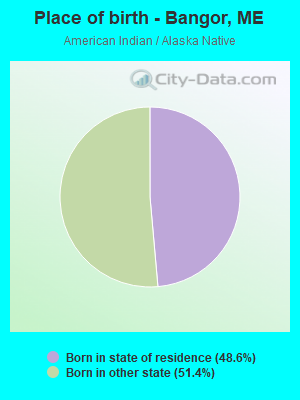
Place of birth - Born in state of residence (%) - American Indian and Alaska Native
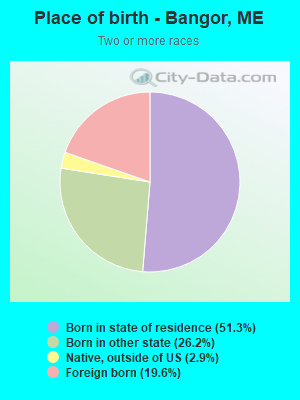
Place of birth - Born in state of residence (%) - Multirace
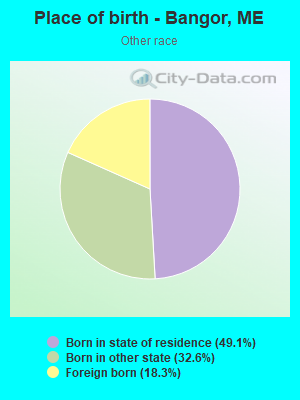
Place of birth - Born in state of residence (%) - Other Race
Place of birth - Born in other state (%)
Place of birth - Born in other state (%) - White
Place of birth - Born in other state (%) - Black or African American
Place of birth - Born in other state (%) - Asian
Place of birth - Born in other state (%) - Hispanic or Latino
Place of birth - Born in other state (%) - American Indian and Alaska Native
Place of birth - Born in other state (%) - Multirace
Place of birth - Born in other state (%) - Other Race
Place of birth - Native, outside of US (%)
Place of birth - Native, outside of US (%) - White
Place of birth - Native, outside of US (%) - Black or African American
Place of birth - Native, outside of US (%) - Asian
Place of birth - Native, outside of US (%) - Hispanic or Latino
Place of birth - Native, outside of US (%) - American Indian and Alaska Native
Place of birth - Native, outside of US (%) - Multirace
Place of birth - Native, outside of US (%) - Other Race
Place of birth - Foreign born (%)
Place of birth - Foreign born (%) - White
Place of birth - Foreign born (%) - Black or African American
Place of birth - Foreign born (%) - Asian
Place of birth - Foreign born (%) - Hispanic or Latino
Place of birth - Foreign born (%) - American Indian and Alaska Native
Place of birth - Foreign born (%) - Multirace
Place of birth - Foreign born (%) - Other Race
Residents speaking English at home (%)
Residents speaking English at home - Born in the United States (%)
Residents speaking English at home - Native, born elsewhere (%)
Residents speaking English at home - Foreign born (%)
Residents speaking Spanish at home (%)
Residents speaking Spanish at home - Born in the United States (%)
Residents speaking Spanish at home - Native, born elsewhere (%)
Residents speaking Spanish at home - Foreign born (%)
Residents speaking other language at home (%)
Residents speaking other language at home - Born in the United States (%)
Residents speaking other language at home - Native, born elsewhere (%)
Residents speaking other language at home - Foreign born (%)
Marital status - Never married (%)
Marital status - Now married (%)
Marital status - Separated (%)
Marital status - Widowed (%)
Marital status - Divorced (%)
Ancestries Reported - Arab (%)
Ancestries Reported - Czech (%)
Ancestries Reported - Danish (%)
Ancestries Reported - Dutch (%)
Ancestries Reported - English (%)
Ancestries Reported - French (%)
Ancestries Reported - French Canadian (%)
Ancestries Reported - German (%)
Ancestries Reported - Greek (%)
Ancestries Reported - Hungarian (%)
Ancestries Reported - Irish (%)
Ancestries Reported - Italian (%)
Ancestries Reported - Lithuanian (%)
Ancestries Reported - Norwegian (%)
Ancestries Reported - Polish (%)
Ancestries Reported - Portuguese (%)
Ancestries Reported - Russian (%)
Ancestries Reported - Scotch-Irish (%)
Ancestries Reported - Scottish (%)
Ancestries Reported - Slovak (%)
Ancestries Reported - Subsaharan African (%)
Ancestries Reported - Swedish (%)
Ancestries Reported - Swiss (%)
Ancestries Reported - Ukrainian (%)
Ancestries Reported - United States (%)
Ancestries Reported - Welsh (%)
Ancestries Reported - West Indian (%)
Ancestries Reported - Other (%)
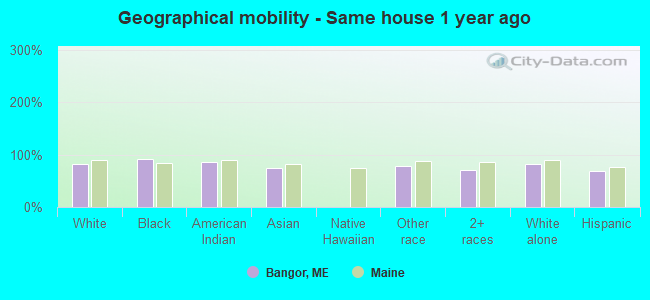
Geographical mobility - Same house 1 year ago (%)
Geographical mobility - Same house 1 year ago (%) - White
Geographical mobility - Same house 1 year ago (%) - Black or African American
Geographical mobility - Same house 1 year ago (%) - Asian
Geographical mobility - Same house 1 year ago (%) - Hispanic or Latino
Geographical mobility - Same house 1 year ago (%) - American Indian and Alaska Native
Geographical mobility - Same house 1 year ago (%) - Multirace
Geographical mobility - Same house 1 year ago (%) - Other Race
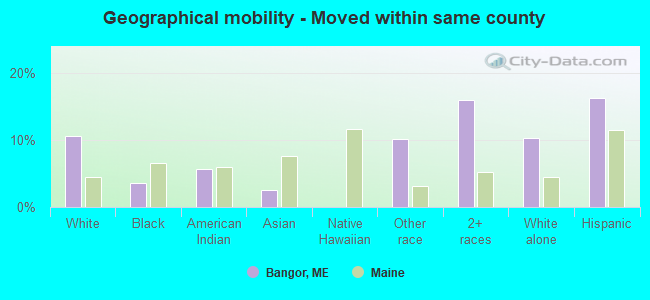
Geographical mobility - Moved within same county (%)
Geographical mobility - Moved within same county (%) - White
Geographical mobility - Moved within same county (%) - Black or African American
Geographical mobility - Moved within same county (%) - Asian
Geographical mobility - Moved within same county (%) - Hispanic or Latino
Geographical mobility - Moved within same county (%) - American Indian and Alaska Native
Geographical mobility - Moved within same county (%) - Multirace
Geographical mobility - Moved within same county (%) - Other Race
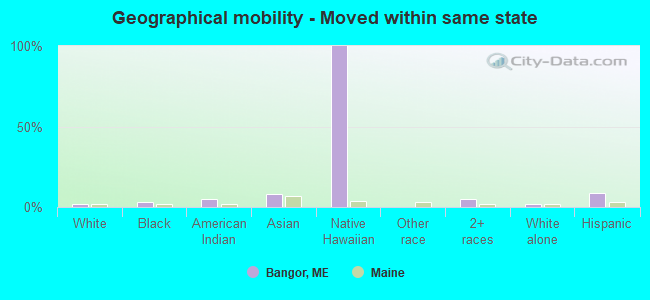
Geographical mobility - Moved from different county within same state (%)
Geographical mobility - Moved from different county within same state (%) - White
Geographical mobility - Moved from different county within same state (%) - Black or African American
Geographical mobility - Moved from different county within same state (%) - Asian
Geographical mobility - Moved from different county within same state (%) - Hispanic or Latino
Geographical mobility - Moved from different county within same state (%) - American Indian and Alaska Native
Geographical mobility - Moved from different county within same state (%) - Multirace
Geographical mobility - Moved from different county within same state (%) - Other Race
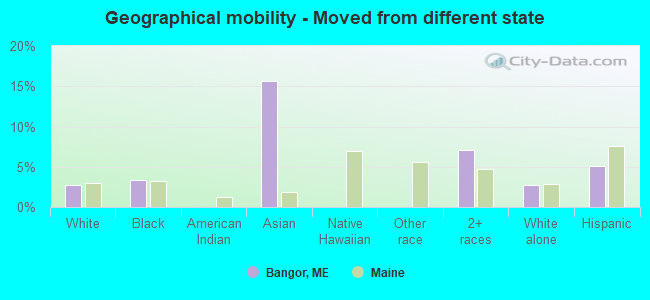
Geographical mobility - Moved from different state (%)
Geographical mobility - Moved from different state (%) - White
Geographical mobility - Moved from different state (%) - Black or African American
Geographical mobility - Moved from different state (%) - Asian
Geographical mobility - Moved from different state (%) - Hispanic or Latino
Geographical mobility - Moved from different state (%) - American Indian and Alaska Native
Geographical mobility - Moved from different state (%) - Multirace
Geographical mobility - Moved from different state (%) - Other Race
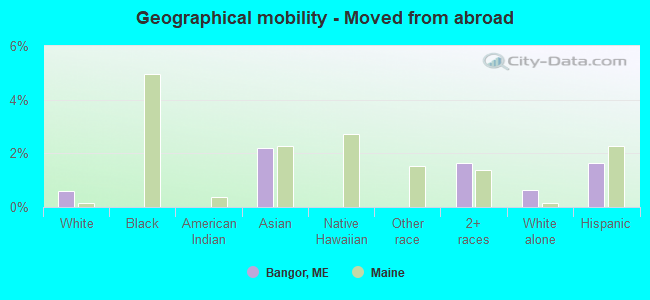
Geographical mobility - Moved from abroad (%)
Geographical mobility - Moved from abroad (%) - White
Geographical mobility - Moved from abroad (%) - Black or African American
Geographical mobility - Moved from abroad (%) - Asian
Geographical mobility - Moved from abroad (%) - Hispanic or Latino
Geographical mobility - Moved from abroad (%) - American Indian and Alaska Native
Geographical mobility - Moved from abroad (%) - Multirace
Geographical mobility - Moved from abroad (%) - Other Race
Place of birth for the foreign-born population - Ireland (%)
Place of birth for the foreign-born population - Denmark (%)
Place of birth for the foreign-born population - Norway (%)
Place of birth for the foreign-born population - Sweden (%)
Place of birth for the foreign-born population - United Kingdom (%)
Place of birth for the foreign-born population - England (%)
Place of birth for the foreign-born population - Scotland (%)
Place of birth for the foreign-born population - Other Northern Europe (%)
Place of birth for the foreign-born population - Austria (%)
Place of birth for the foreign-born population - Belgium (%)
Place of birth for the foreign-born population - France (%)
Place of birth for the foreign-born population - Germany (%)
Place of birth for the foreign-born population - Netherlands (%)
Place of birth for the foreign-born population - Switzerland (%)
Place of birth for the foreign-born population - Other Western Europe (%)
Place of birth for the foreign-born population - Greece (%)
Place of birth for the foreign-born population - Italy (%)
Place of birth for the foreign-born population - Portugal (%)
Place of birth for the foreign-born population - Spain (%)
Place of birth for the foreign-born population - Other Southern Europe (%)
Place of birth for the foreign-born population - Albania (%)
Place of birth for the foreign-born population - Belarus (%)
Place of birth for the foreign-born population - Bosnia and Herzegovina (%)
Place of birth for the foreign-born population - Bulgaria (%)
Place of birth for the foreign-born population - Croatia (%)
Place of birth for the foreign-born population - Czechoslovakia (%)
Place of birth for the foreign-born population - Hungary (%)
Place of birth for the foreign-born population - Latvia (%)
Place of birth for the foreign-born population - Lithuania (%)
Place of birth for the foreign-born population - North Macedonia (Macedonia) (%)
Place of birth for the foreign-born population - Moldova (%)
Place of birth for the foreign-born population - Poland (%)
Place of birth for the foreign-born population - Romania (%)
Place of birth for the foreign-born population - Russia (%)
Place of birth for the foreign-born population - Serbia (%)
Place of birth for the foreign-born population - Ukraine (%)
Place of birth for the foreign-born population - Other Eastern Europe (%)
Place of birth for the foreign-born population - China (%)
Place of birth for the foreign-born population - Hong Kong (%)
Place of birth for the foreign-born population - Taiwan (%)
Place of birth for the foreign-born population - Japan (%)
Place of birth for the foreign-born population - Korea (%)
Place of birth for the foreign-born population - Other Eastern Asia (%)
Place of birth for the foreign-born population - Afghanistan (%)
Place of birth for the foreign-born population - Bangladesh (%)
Place of birth for the foreign-born population - India (%)
Place of birth for the foreign-born population - Iran (%)
Place of birth for the foreign-born population - Kazakhstan (%)
Place of birth for the foreign-born population - Nepal (%)
Place of birth for the foreign-born population - Pakistan (%)
Place of birth for the foreign-born population - Sri Lanka (%)
Place of birth for the foreign-born population - Uzbekistan (%)
Place of birth for the foreign-born population - Other South Central Asia (%)
Place of birth for the foreign-born population - Burma (%)
Place of birth for the foreign-born population - Cambodia (%)
Place of birth for the foreign-born population - Indonesia (%)
Place of birth for the foreign-born population - Laos (%)
Place of birth for the foreign-born population - Malaysia (%)
Place of birth for the foreign-born population - Philippines (%)
Place of birth for the foreign-born population - Singapore (%)
Place of birth for the foreign-born population - Thailand (%)
Place of birth for the foreign-born population - Vietnam (%)
Place of birth for the foreign-born population - Other South Eastern Asia (%)
Place of birth for the foreign-born population - Armenia (%)
Place of birth for the foreign-born population - Iraq (%)
Place of birth for the foreign-born population - Israel (%)
Place of birth for the foreign-born population - Jordan (%)
Place of birth for the foreign-born population - Kuwait (%)
Place of birth for the foreign-born population - Lebanon (%)
Place of birth for the foreign-born population - Saudi Arabia (%)
Place of birth for the foreign-born population - Syria (%)
Place of birth for the foreign-born population - Turkey (%)
Place of birth for the foreign-born population - Yemen (%)
Place of birth for the foreign-born population - Other Western Asia (%)
Place of birth for the foreign-born population - Eritrea (%)
Place of birth for the foreign-born population - Ethiopia (%)
Place of birth for the foreign-born population - Kenya (%)
Place of birth for the foreign-born population - Somalia (%)
Place of birth for the foreign-born population - Uganda (%)
Place of birth for the foreign-born population - Zimbabwe (%)
Place of birth for the foreign-born population - Other Eastern Africa (%)
Place of birth for the foreign-born population - Cameroon (%)
Place of birth for the foreign-born population - Congo (%)
Place of birth for the foreign-born population - Democratic Republic of Congo (Zaire) (%)
Place of birth for the foreign-born population - Other Middle Africa (%)
Place of birth for the foreign-born population - Egypt (%)
Place of birth for the foreign-born population - Morocco (%)
Place of birth for the foreign-born population - Sudan (%)
Place of birth for the foreign-born population - Other Northern Africa (%)
Place of birth for the foreign-born population - South Africa (%)
Place of birth for the foreign-born population - Other Southern Africa (%)
Place of birth for the foreign-born population - Cabo Verde (%)
Place of birth for the foreign-born population - Ghana (%)
Place of birth for the foreign-born population - Liberia (%)
Place of birth for the foreign-born population - Nigeria (%)
Place of birth for the foreign-born population - Senegal (%)
Place of birth for the foreign-born population - Sierra Leone (%)
Place of birth for the foreign-born population - Other Western Africa (%)
Place of birth for the foreign-born population - Australia (%)
Place of birth for the foreign-born population - New Zealand (%)
Place of birth for the foreign-born population - Fiji (%)
Place of birth for the foreign-born population - Micronesia (%)
Place of birth for the foreign-born population - Bahamas (%)
Place of birth for the foreign-born population - Barbados (%)
Place of birth for the foreign-born population - Cuba (%)
Place of birth for the foreign-born population - Dominica (%)
Place of birth for the foreign-born population - Dominican Republic (%)
Place of birth for the foreign-born population - Grenada (%)
Place of birth for the foreign-born population - Haiti (%)
Place of birth for the foreign-born population - Jamaica (%)
Place of birth for the foreign-born population - St. Vincent and the Grenadines (%)
Place of birth for the foreign-born population - Trinidad and Tobago (%)
Place of birth for the foreign-born population - West Indies (%)
Place of birth for the foreign-born population - Other Caribbean (%)
Place of birth for the foreign-born population - Belize (%)
Place of birth for the foreign-born population - Costa Rica (%)
Place of birth for the foreign-born population - El Salvador (%)
Place of birth for the foreign-born population - Guatemala (%)
Place of birth for the foreign-born population - Honduras (%)
Place of birth for the foreign-born population - Mexico (%)
Place of birth for the foreign-born population - Nicaragua (%)
Place of birth for the foreign-born population - Panama (%)
Place of birth for the foreign-born population - Other Central America (%)
Place of birth for the foreign-born population - Argentina (%)
Place of birth for the foreign-born population - Bolivia (%)
Place of birth for the foreign-born population - Brazil (%)
Place of birth for the foreign-born population - Chile (%)
Place of birth for the foreign-born population - Colombia (%)
Place of birth for the foreign-born population - Ecuador (%)
Place of birth for the foreign-born population - Guyana (%)
Place of birth for the foreign-born population - Peru (%)
Place of birth for the foreign-born population - Uruguay (%)
Place of birth for the foreign-born population - Venezuela (%)
Place of birth for the foreign-born population - Other South America (%)
Place of birth for the foreign-born population - Canada (%)
Place of birth for the foreign-born population - Other Northern America (%)
Place of birth for the foreign-born population - Other (%)
Latest news about races in Bangor, ME collected exclusively by city-data.com from local newspapers, TV, and radio stations
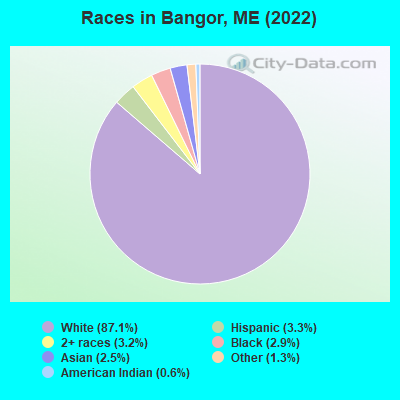
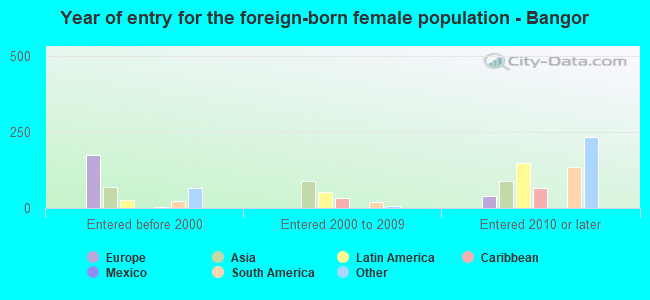
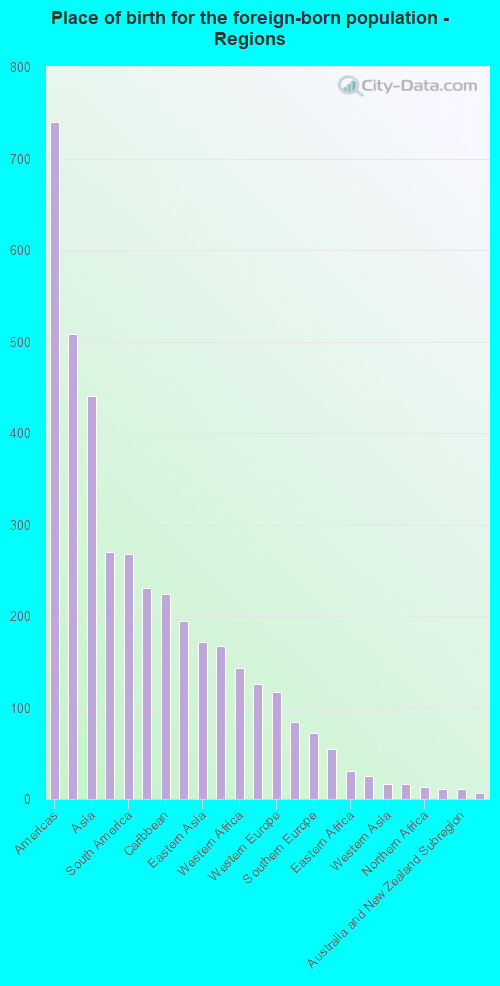
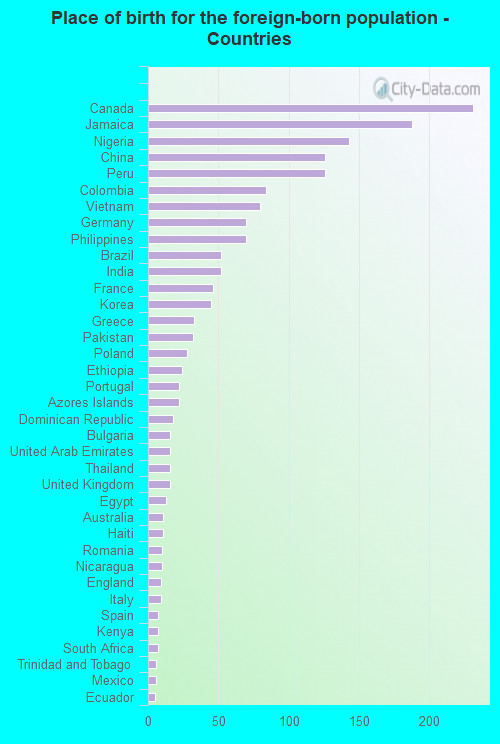
According to 2022 data, the most numerous races in Bangor, ME are White alone (27,814 residents), Two or more races (1,032 residents), and Hispanic (1,062 residents). 92.7% of Bangor residents speak English at home. 5.2% of Bangor, ME residents are foreign-born (1.6% born in Latin America, 1.4% born in Asia, 0.8% born in Europe, 0.7% born in North America, 0.6% born in Africa), which is 42.2% greater than the foreign-born rate of 3.0% across the entire state of Maine.
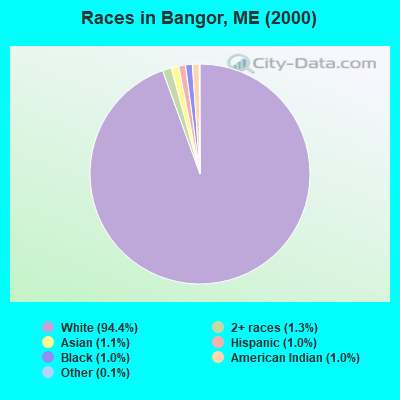
Race distribution in Bangor
2000 2022
1,230,297 96.5% White alone 11,731 0.9% Two or more races 9,360 0.7% Hispanic 9,014 0.7% Asian alone 6,440 0.5% Black alone 6,911 0.5% American Indian alone 836 0.07% Other race alone 334 0.03% Native Hawaiian and Other
1,249,233 90.2% White alone 58,357 4.2% Two or more races 28,717 2.1% Hispanic 21,583 1.6% Black alone 16,151 1.2% Asian alone 5,873 0.4% Other race alone 5,205 0.4% American Indian alone 221 0.02% Native Hawaiian and Other
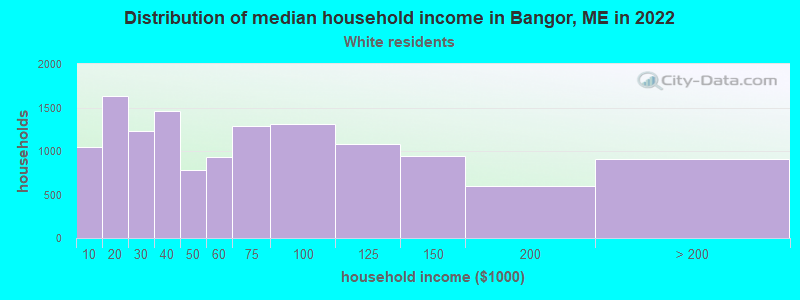
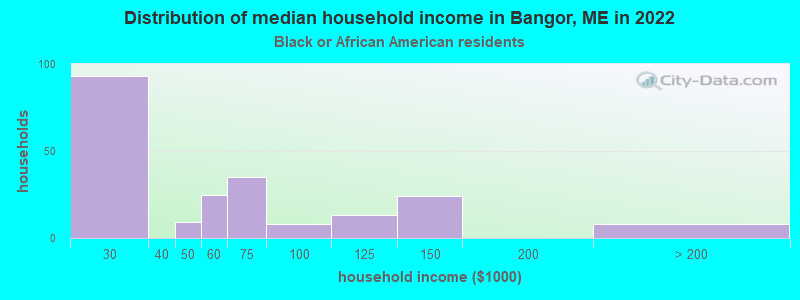
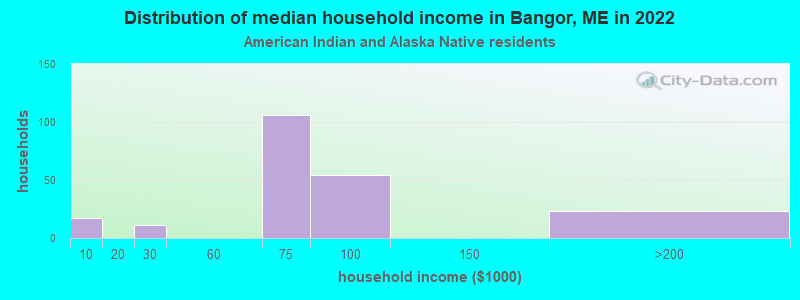
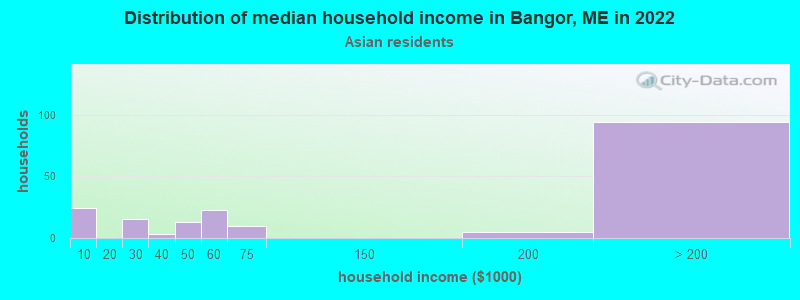
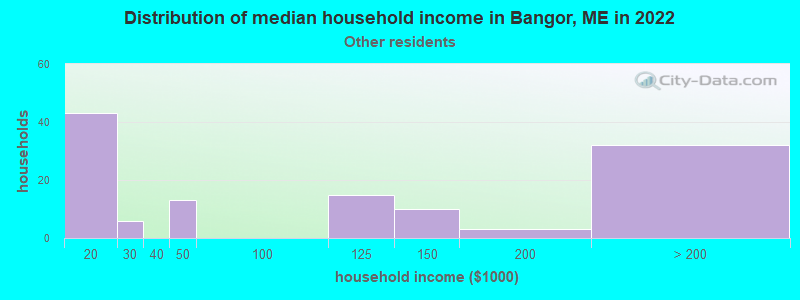
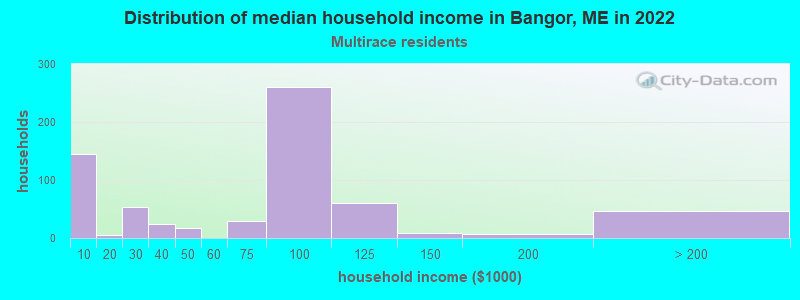
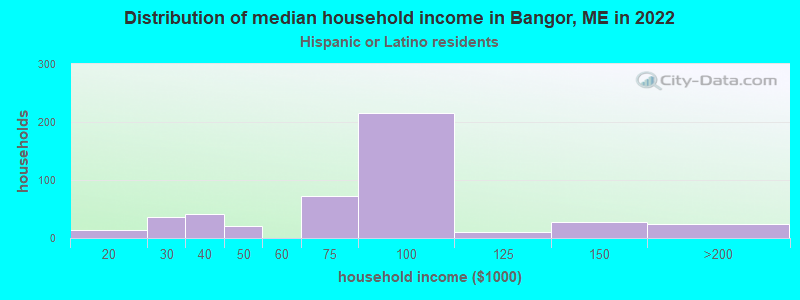
Income and house value in Bangor Median household income in 2022 $53,416 White non-Hispanic householders$69,417 American Indian and Alaska Native householders$38,030 Two or more races householders$75,239 Hispanic or Latino race householdersMedian 2022 house value $224,968 White Non-Hispanic householders$216,703 Black or African American householders$400,346 American Indian or Alaska Native householders $333,191 Asian householders$197,073 Two or more races householders$271,202 Hispanic or Latino householders
Median age by race in Bangor
41.6 Median age for White residents40.2 43.3 36.9 Median age for Black or African American residents46.6 14.2 20.0 Median age for American Indian / Alaska Native residents20.6 19.8 34.6 Median age for Asian residents69.8 24.5 -661,818,181.2 Median age for Native Hawaiian / Pacific Islander residents-666,666,666.0 -453,900,708.8 41.7 Median age for Other race residents42.8 39.7 41.4 Median age for Two or more races residents39.1 39.5 41.7 Median age for White alone residents40.5 43.1 36.2 Median age for Hispanic or Latino residents38.4 26.0
Owner/renter occupied households by race in Bangor
House owners and renters - White residents 5,988 44.8% Owner occupied7,389 55.2% Renter occupiedHouse owners and renters - Black or African American residents 72 25.8% Owner occupied207 74.2% Renter occupiedHouse owners and renters - American Indian / Alaska Native residents 14 6.9% Owner occupied191 93.1% Renter occupiedHouse owners and renters - Asian residents 124 53.1% Owner occupied109 46.9% Renter occupiedHouse owners and renters - Native Hawaiian / Pacific Islander residents 13 100.0% Owner occupiedHouse owners and renters - Other race residents 93 50.1% Owner occupied92 49.9% Renter occupiedHouse owners and renters - Two or more races residents 286 64.5% Owner occupied157 35.5% Renter occupiedHouse owners and renters - White alone residents 5,893 44.7% Owner occupied7,293 55.3% Renter occupiedHouse owners and renters - Hispanic or Latino residents 235 36.1% Owner occupied415 63.9% Renter occupied
Language usage in Bangor
English speakers - Total 92.7% of residents of Bangor speak English at home.
1.9% of residents speak Spanish at home 501 87.7% Speak English very well70 12.3% Speak English less than very well5.8% of residents speak other language at home 1,183 66.9% Speak English very well585 33.1% Speak English less than very well
English speakers - Born in the United States 94.1% of residents of Bangor speak English at home.
3.3% of residents speak Spanish at home 261 88.2% Speak English very well35 11.8% Speak English less than very well3.1% of residents speak other language at home 182 67.2% Speak English very well89 32.8% Speak English less than very well
English speakers - Native, born elsewhere 84.3% of residents of Bangor speak English at home.
12.3% of residents speak other language at home 29 63.0% Speak English very well17 37.0% Speak English less than very well
English speakers - Foreign-born 26.3% of residents of Bangor speak English at home.
11.5% of residents speak Spanish at home 153 78.9% Speak English very well41 21.1% Speak English less than very well66.9% of residents speak other language at home 722 63.9% Speak English very well408 36.1% Speak English less than very well
White (Caucasian) - Speak only English Native:
98.0% (26,090)Foreign-born:
58.8% (261)
White (Caucasian) - Speak another language Native:
2.0% (525)Foreign-born:
40.7% (181)
Black or African American - Speak only English Native:
92.3% (339)Foreign-born:
37.7% (186)
Black or African American - Speak another language Native:
20.0% (73)Foreign-born:
68.8% (340)
Asian - Speak only English Native:
44.8% (72)Foreign-born:
13.5% (56)
Asian - Speak another language Native:
41.0% (66)Foreign-born:
91.3% (381)
Other race - Speak another language Native:
30.8% (93)Foreign-born:
82.2% (78)
Two or more races - Speak only English Native:
98.0% (1,225)Foreign-born:
15.8% (45)
Two or more races - Speak another language Native:
2.8% (36)Foreign-born:
81.4% (232)
White alone - Speak only English Native:
98.3% (25,844)Foreign-born:
58.3% (266)
White alone - Speak another language Native:
1.7% (437)Foreign-born:
41.3% (189)
Hispanic or Latino - Speak only English Native:
68.3% (457)Foreign-born:
5.9% (15)
Hispanic or Latino - Speak another language Native:
25.1% (168)Foreign-born:
88.9% (229)
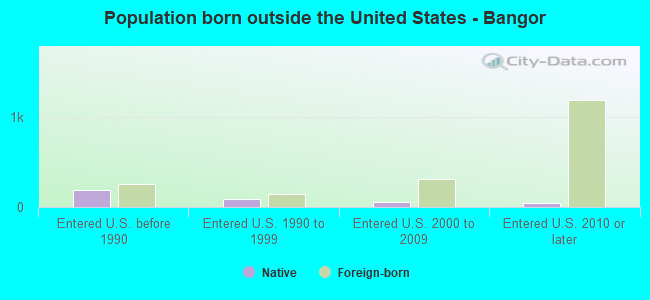
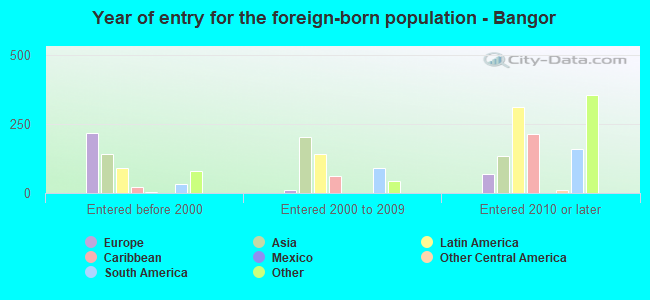
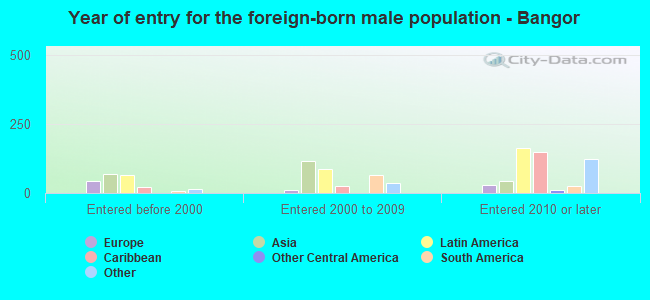
Foreign-born residents in Bangor 1,658 residents are foreign born (1.6% Latin America , 1.4% Asia , 0.8% Europe , 0.7% North America , 0.6% Africa ).
Marital status for residents in Bangor Marital status - White (Caucasian) population 15 years and over
Males 43.7% Never married37.6% Now married1.3% Separated3.1% Widowed14.2% DivorcedFemales 35.2% Never married33.9% Now married1.6% Separated10.7% Widowed18.5% DivorcedWomen who gave birth in the past 12 months Now married:
62.3% (284)Unmarried:
37.7% (171)
Women who did not give birth in the past 12 months Now married:
30.0% (1,934)Unmarried:
70.0% (4,518)
Marital status - Black or African American population 15 years and over
Males 60.2% Never married39.8% Now married0.0% Separated0.0% Widowed0.0% DivorcedFemales 45.9% Never married33.2% Now married0.0% Separated16.3% Widowed4.6% DivorcedWomen who gave birth in the past 12 months Now married:
0.0% (0)Unmarried:
98.5% (1)
Women who did not give birth in the past 12 months Now married:
29.6% (58)Unmarried:
70.4% (138)
Marital status - American Indian / Alaska Native population 15 years and over
Males 66.7% Never married8.0% Now married0.0% Separated0.0% Widowed25.3% DivorcedFemales 80.9% Never married19.1% Now married0.0% Separated0.0% Widowed0.0% DivorcedWomen who gave birth in the past 12 months Now married:
0.0% (0)Unmarried:
100.0% (7)
Women who did not give birth in the past 12 months Now married:
13.2% (11)Unmarried:
86.8% (72)
Marital status - Asian population 15 years and over
Males 16.8% Never married83.2% Now married0.0% Separated0.0% Widowed0.0% DivorcedFemales 39.7% Never married58.4% Now married0.0% Separated1.9% Widowed0.0% DivorcedWomen who did not give birth in the past 12 months Now married:
52.3% (107)Unmarried:
47.7% (98)
Marital status - Other race population 15 years and over
Males 22.0% Never married78.0% Now married0.0% Separated0.0% Widowed0.0% DivorcedFemales 20.7% Never married47.0% Now married0.0% Separated0.0% Widowed32.3% DivorcedWomen who did not give birth in the past 12 months Now married:
45.4% (78)Unmarried:
54.6% (94)
Marital status - Two or more races population 15 years and over
Males 31.9% Never married42.8% Now married0.0% Separated0.0% Widowed25.3% DivorcedFemales 42.3% Never married25.3% Now married6.9% Separated4.0% Widowed21.5% DivorcedWomen who did not give birth in the past 12 months Now married:
18.5% (103)Unmarried:
81.5% (454)
Marital status - White alone, not Hispanic / Latino population 15 years and over
Males 43.4% Never married37.8% Now married1.3% Separated3.2% Widowed14.4% DivorcedFemales 35.1% Never married34.1% Now married1.4% Separated10.7% Widowed18.7% DivorcedWomen who gave birth in the past 12 months Now married:
61.2% (272)Unmarried:
38.8% (172)
Women who did not give birth in the past 12 months Now married:
30.2% (1,942)Unmarried:
69.8% (4,483)
Marital status - Hispanic or Latino population 15 years and over
Males 38.9% Never married28.2% Now married0.0% Separated0.0% Widowed32.9% DivorcedFemales 38.8% Never married15.1% Now married7.9% Separated17.5% Widowed20.8% DivorcedWomen who gave birth in the past 12 months Now married:
68.4% (14)Unmarried:
31.6% (6)
Women who did not give birth in the past 12 months Now married:
12.8% (31)Unmarried:
87.2% (214)
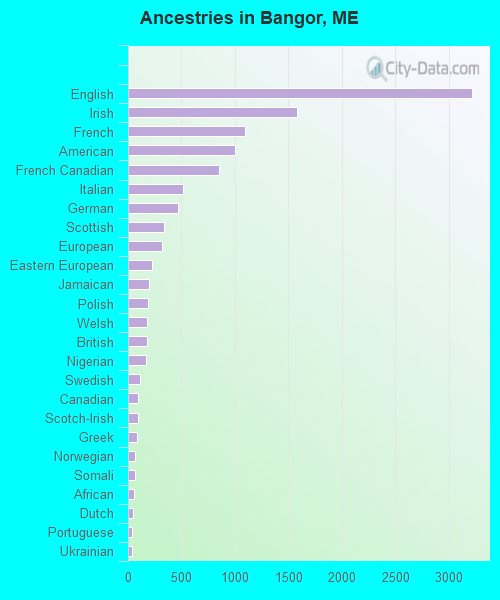
Ancestries in Bangor
3,214 23.6% English1,577 11.6% Irish1,096 8.0% French1,004 7.4% American848 6.2% French Canadian511 3.8% Italian468 3.4% German339 2.5% Scottish320 2.3% European227 1.7% Eastern European195 1.4% Jamaican183 1.3% Polish179 1.3% Welsh178 1.3% British165 1.2% Nigerian110 0.8% Swedish91 0.7% Canadian90 0.7% Scotch-Irish87 0.6% Greek70 0.5% Norwegian62 0.5% Somali52 0.4% African47 0.3% Dutch39 0.3% Portuguese38 0.3% Ukrainian36 0.3% Scandinavian30 0.2% Russian29 0.2% Brazilian26 0.2% Ethiopian18 0.1% Celtic15 0.1% Albanian15 0.1% Bulgarian14 0.1% Swiss11 0.08% Arab10 0.07% Australian7 0.05% Hungarian6 0.04% Czech6 0.04% Trinidadian and Tobagonian4 0.03% Slovak1 0.01% Sudanese1 0.01% Haitian
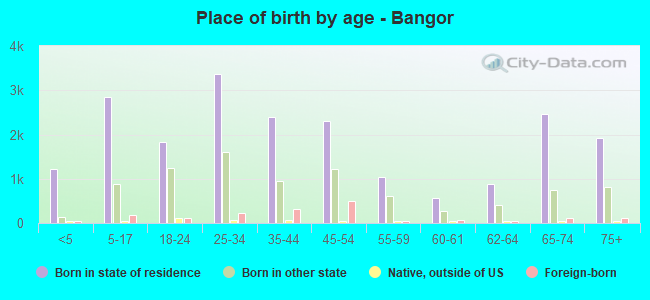
Children Nativity (place of birth) in Bangor
Children under 6 years - Living with two parents Both parents native 797 100.0% NativeBoth parents foreign-born 71 100.0% NativeOne native, one foreign-born parent 72 100.0% NativeChildren under 6 years - Living with one parent Native parent 559 100.0% NativeForeign-born parent 26 100.0% NativeChildren 6 to 17 years - Living with two parents Both parents native 1,549 97.2% Native44 2.8% Foreign-bornBoth parents foreign-born 103 45.7% Native123 54.3% Foreign-bornOne native, one foreign-born parent 113 100.0% NativeChildren 6 to 17 years - Living with one parent Native parent 1,475 98.4% Native23 1.6% Foreign-bornForeign-born parent 103 66.8% Native51 33.2% Foreign-born
Grandparents responsible for own grandchildren in Bangor
Grandparents (30 to 59 years) White / Caucasian 22 26.2% Responsible for grandchildren61 73.8% Not responsible for grandchildrenOther race 42 100.0% Not responsible for grandchildrenWhite alone, not Hispanic / Latino 22 26.2% Responsible for grandchildren61 73.8% Not responsible for grandchildrenGrandparents (60 years and over) White / Caucasian 15 17.2% Responsible for grandchildren74 82.8% Not responsible for grandchildrenWhite alone, not Hispanic / Latino 15 17.2% Responsible for grandchildren74 82.8% Not responsible for grandchildren