Races in Bar Nunn, Wyoming (WY) Detailed Stats
Data:
Races - White alone (%)
Races - White alone (% change since 2000)
Races - Black alone (%)
Races - Black alone (% change since 2000)
Races - American Indian alone (%)
Races - American Indian alone (% change since 2000)
Races - Asian alone (%)
Races - Asian alone (% change since 2000)
Races - Hispanic (%)
Races - Hispanic (% change since 2000)
Races - Native Hawaiian and Other Pacific Islander alone (%)
Races - Native Hawaiian and Other Pacific Islander alone (% change since 2000)
Races - Two or more races(%)
Races - Two or more races(% change since 2000)
Races - Other race alone (%)
Races - Other race alone (% change since 2000)
Racial diversity
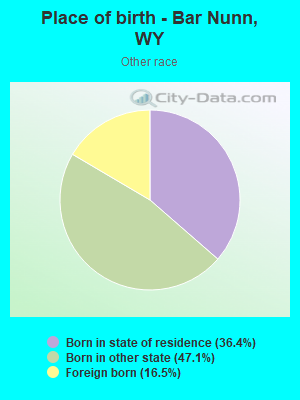
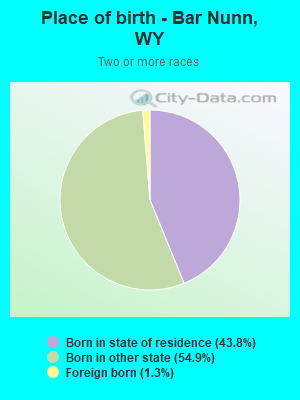
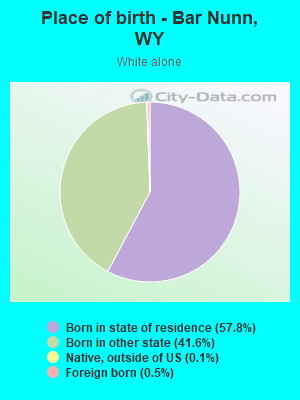
Place of birth - Born in state of residence (%)
Place of birth - Born in state of residence (%) - White
Place of birth - Born in state of residence (%) - Black or African American
Place of birth - Born in state of residence (%) - Asian
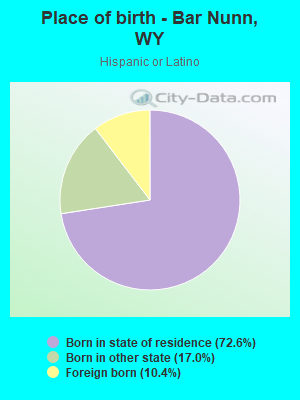
Place of birth - Born in state of residence (%) - Hispanic or Latino
Place of birth - Born in state of residence (%) - American Indian and Alaska Native
Place of birth - Born in state of residence (%) - Multirace
Place of birth - Born in state of residence (%) - Other Race
Place of birth - Born in other state (%)
Place of birth - Born in other state (%) - White
Place of birth - Born in other state (%) - Black or African American
Place of birth - Born in other state (%) - Asian
Place of birth - Born in other state (%) - Hispanic or Latino
Place of birth - Born in other state (%) - American Indian and Alaska Native
Place of birth - Born in other state (%) - Multirace
Place of birth - Born in other state (%) - Other Race
Place of birth - Native, outside of US (%)
Place of birth - Native, outside of US (%) - White
Place of birth - Native, outside of US (%) - Black or African American
Place of birth - Native, outside of US (%) - Asian
Place of birth - Native, outside of US (%) - Hispanic or Latino
Place of birth - Native, outside of US (%) - American Indian and Alaska Native
Place of birth - Native, outside of US (%) - Multirace
Place of birth - Native, outside of US (%) - Other Race
Place of birth - Foreign born (%)
Place of birth - Foreign born (%) - White
Place of birth - Foreign born (%) - Black or African American
Place of birth - Foreign born (%) - Asian
Place of birth - Foreign born (%) - Hispanic or Latino
Place of birth - Foreign born (%) - American Indian and Alaska Native
Place of birth - Foreign born (%) - Multirace
Place of birth - Foreign born (%) - Other Race
Residents speaking English at home (%)
Residents speaking English at home - Born in the United States (%)
Residents speaking English at home - Native, born elsewhere (%)
Residents speaking English at home - Foreign born (%)
Residents speaking Spanish at home (%)
Residents speaking Spanish at home - Born in the United States (%)
Residents speaking Spanish at home - Native, born elsewhere (%)
Residents speaking Spanish at home - Foreign born (%)
Residents speaking other language at home (%)
Residents speaking other language at home - Born in the United States (%)
Residents speaking other language at home - Native, born elsewhere (%)
Residents speaking other language at home - Foreign born (%)
Marital status - Never married (%)
Marital status - Now married (%)
Marital status - Separated (%)
Marital status - Widowed (%)
Marital status - Divorced (%)
Ancestries Reported - Arab (%)
Ancestries Reported - Czech (%)
Ancestries Reported - Danish (%)
Ancestries Reported - Dutch (%)
Ancestries Reported - English (%)
Ancestries Reported - French (%)
Ancestries Reported - French Canadian (%)
Ancestries Reported - German (%)
Ancestries Reported - Greek (%)
Ancestries Reported - Hungarian (%)
Ancestries Reported - Irish (%)
Ancestries Reported - Italian (%)
Ancestries Reported - Lithuanian (%)
Ancestries Reported - Norwegian (%)
Ancestries Reported - Polish (%)
Ancestries Reported - Portuguese (%)
Ancestries Reported - Russian (%)
Ancestries Reported - Scotch-Irish (%)
Ancestries Reported - Scottish (%)
Ancestries Reported - Slovak (%)
Ancestries Reported - Subsaharan African (%)
Ancestries Reported - Swedish (%)
Ancestries Reported - Swiss (%)
Ancestries Reported - Ukrainian (%)
Ancestries Reported - United States (%)
Ancestries Reported - Welsh (%)
Ancestries Reported - West Indian (%)
Ancestries Reported - Other (%)
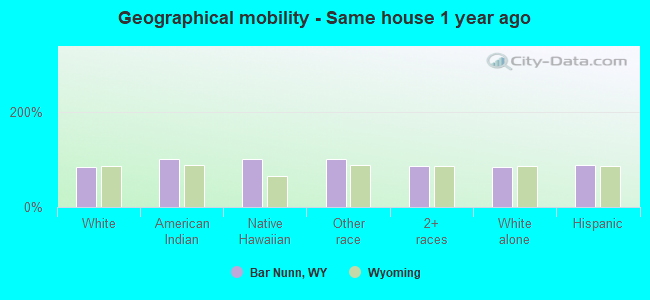
Geographical mobility - Same house 1 year ago (%)
Geographical mobility - Same house 1 year ago (%) - White
Geographical mobility - Same house 1 year ago (%) - Black or African American
Geographical mobility - Same house 1 year ago (%) - Asian
Geographical mobility - Same house 1 year ago (%) - Hispanic or Latino
Geographical mobility - Same house 1 year ago (%) - American Indian and Alaska Native
Geographical mobility - Same house 1 year ago (%) - Multirace
Geographical mobility - Same house 1 year ago (%) - Other Race
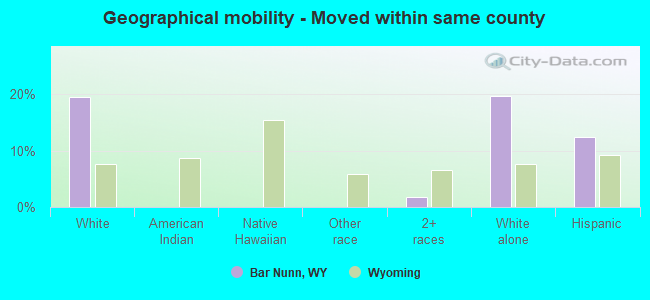
Geographical mobility - Moved within same county (%)
Geographical mobility - Moved within same county (%) - White
Geographical mobility - Moved within same county (%) - Black or African American
Geographical mobility - Moved within same county (%) - Asian
Geographical mobility - Moved within same county (%) - Hispanic or Latino
Geographical mobility - Moved within same county (%) - American Indian and Alaska Native
Geographical mobility - Moved within same county (%) - Multirace
Geographical mobility - Moved within same county (%) - Other Race
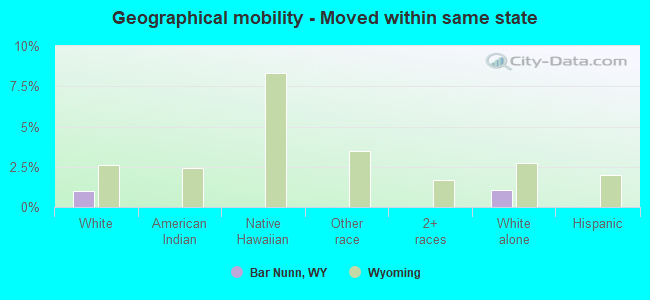
Geographical mobility - Moved from different county within same state (%)
Geographical mobility - Moved from different county within same state (%) - White
Geographical mobility - Moved from different county within same state (%) - Black or African American
Geographical mobility - Moved from different county within same state (%) - Asian
Geographical mobility - Moved from different county within same state (%) - Hispanic or Latino
Geographical mobility - Moved from different county within same state (%) - American Indian and Alaska Native
Geographical mobility - Moved from different county within same state (%) - Multirace
Geographical mobility - Moved from different county within same state (%) - Other Race
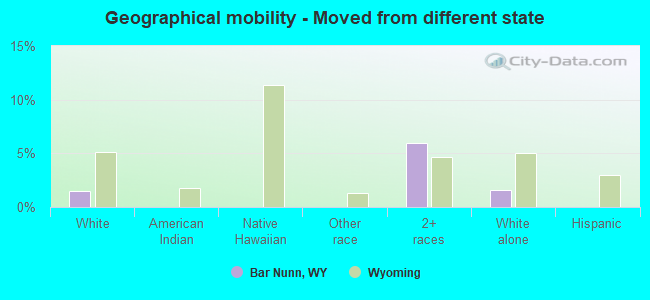
Geographical mobility - Moved from different state (%)
Geographical mobility - Moved from different state (%) - White
Geographical mobility - Moved from different state (%) - Black or African American
Geographical mobility - Moved from different state (%) - Asian
Geographical mobility - Moved from different state (%) - Hispanic or Latino
Geographical mobility - Moved from different state (%) - American Indian and Alaska Native
Geographical mobility - Moved from different state (%) - Multirace
Geographical mobility - Moved from different state (%) - Other Race
Geographical mobility - Moved from abroad (%)
Geographical mobility - Moved from abroad (%) - White
Geographical mobility - Moved from abroad (%) - Black or African American
Geographical mobility - Moved from abroad (%) - Asian
Geographical mobility - Moved from abroad (%) - Hispanic or Latino
Geographical mobility - Moved from abroad (%) - American Indian and Alaska Native
Geographical mobility - Moved from abroad (%) - Multirace
Geographical mobility - Moved from abroad (%) - Other Race
Place of birth for the foreign-born population - Ireland (%)
Place of birth for the foreign-born population - Denmark (%)
Place of birth for the foreign-born population - Norway (%)
Place of birth for the foreign-born population - Sweden (%)
Place of birth for the foreign-born population - United Kingdom (%)
Place of birth for the foreign-born population - England (%)
Place of birth for the foreign-born population - Scotland (%)
Place of birth for the foreign-born population - Other Northern Europe (%)
Place of birth for the foreign-born population - Austria (%)
Place of birth for the foreign-born population - Belgium (%)
Place of birth for the foreign-born population - France (%)
Place of birth for the foreign-born population - Germany (%)
Place of birth for the foreign-born population - Netherlands (%)
Place of birth for the foreign-born population - Switzerland (%)
Place of birth for the foreign-born population - Other Western Europe (%)
Place of birth for the foreign-born population - Greece (%)
Place of birth for the foreign-born population - Italy (%)
Place of birth for the foreign-born population - Portugal (%)
Place of birth for the foreign-born population - Spain (%)
Place of birth for the foreign-born population - Other Southern Europe (%)
Place of birth for the foreign-born population - Albania (%)
Place of birth for the foreign-born population - Belarus (%)
Place of birth for the foreign-born population - Bosnia and Herzegovina (%)
Place of birth for the foreign-born population - Bulgaria (%)
Place of birth for the foreign-born population - Croatia (%)
Place of birth for the foreign-born population - Czechoslovakia (%)
Place of birth for the foreign-born population - Hungary (%)
Place of birth for the foreign-born population - Latvia (%)
Place of birth for the foreign-born population - Lithuania (%)
Place of birth for the foreign-born population - North Macedonia (Macedonia) (%)
Place of birth for the foreign-born population - Moldova (%)
Place of birth for the foreign-born population - Poland (%)
Place of birth for the foreign-born population - Romania (%)
Place of birth for the foreign-born population - Russia (%)
Place of birth for the foreign-born population - Serbia (%)
Place of birth for the foreign-born population - Ukraine (%)
Place of birth for the foreign-born population - Other Eastern Europe (%)
Place of birth for the foreign-born population - China (%)
Place of birth for the foreign-born population - Hong Kong (%)
Place of birth for the foreign-born population - Taiwan (%)
Place of birth for the foreign-born population - Japan (%)
Place of birth for the foreign-born population - Korea (%)
Place of birth for the foreign-born population - Other Eastern Asia (%)
Place of birth for the foreign-born population - Afghanistan (%)
Place of birth for the foreign-born population - Bangladesh (%)
Place of birth for the foreign-born population - India (%)
Place of birth for the foreign-born population - Iran (%)
Place of birth for the foreign-born population - Kazakhstan (%)
Place of birth for the foreign-born population - Nepal (%)
Place of birth for the foreign-born population - Pakistan (%)
Place of birth for the foreign-born population - Sri Lanka (%)
Place of birth for the foreign-born population - Uzbekistan (%)
Place of birth for the foreign-born population - Other South Central Asia (%)
Place of birth for the foreign-born population - Burma (%)
Place of birth for the foreign-born population - Cambodia (%)
Place of birth for the foreign-born population - Indonesia (%)
Place of birth for the foreign-born population - Laos (%)
Place of birth for the foreign-born population - Malaysia (%)
Place of birth for the foreign-born population - Philippines (%)
Place of birth for the foreign-born population - Singapore (%)
Place of birth for the foreign-born population - Thailand (%)
Place of birth for the foreign-born population - Vietnam (%)
Place of birth for the foreign-born population - Other South Eastern Asia (%)
Place of birth for the foreign-born population - Armenia (%)
Place of birth for the foreign-born population - Iraq (%)
Place of birth for the foreign-born population - Israel (%)
Place of birth for the foreign-born population - Jordan (%)
Place of birth for the foreign-born population - Kuwait (%)
Place of birth for the foreign-born population - Lebanon (%)
Place of birth for the foreign-born population - Saudi Arabia (%)
Place of birth for the foreign-born population - Syria (%)
Place of birth for the foreign-born population - Turkey (%)
Place of birth for the foreign-born population - Yemen (%)
Place of birth for the foreign-born population - Other Western Asia (%)
Place of birth for the foreign-born population - Eritrea (%)
Place of birth for the foreign-born population - Ethiopia (%)
Place of birth for the foreign-born population - Kenya (%)
Place of birth for the foreign-born population - Somalia (%)
Place of birth for the foreign-born population - Uganda (%)
Place of birth for the foreign-born population - Zimbabwe (%)
Place of birth for the foreign-born population - Other Eastern Africa (%)
Place of birth for the foreign-born population - Cameroon (%)
Place of birth for the foreign-born population - Congo (%)
Place of birth for the foreign-born population - Democratic Republic of Congo (Zaire) (%)
Place of birth for the foreign-born population - Other Middle Africa (%)
Place of birth for the foreign-born population - Egypt (%)
Place of birth for the foreign-born population - Morocco (%)
Place of birth for the foreign-born population - Sudan (%)
Place of birth for the foreign-born population - Other Northern Africa (%)
Place of birth for the foreign-born population - South Africa (%)
Place of birth for the foreign-born population - Other Southern Africa (%)
Place of birth for the foreign-born population - Cabo Verde (%)
Place of birth for the foreign-born population - Ghana (%)
Place of birth for the foreign-born population - Liberia (%)
Place of birth for the foreign-born population - Nigeria (%)
Place of birth for the foreign-born population - Senegal (%)
Place of birth for the foreign-born population - Sierra Leone (%)
Place of birth for the foreign-born population - Other Western Africa (%)
Place of birth for the foreign-born population - Australia (%)
Place of birth for the foreign-born population - New Zealand (%)
Place of birth for the foreign-born population - Fiji (%)
Place of birth for the foreign-born population - Micronesia (%)
Place of birth for the foreign-born population - Bahamas (%)
Place of birth for the foreign-born population - Barbados (%)
Place of birth for the foreign-born population - Cuba (%)
Place of birth for the foreign-born population - Dominica (%)
Place of birth for the foreign-born population - Dominican Republic (%)
Place of birth for the foreign-born population - Grenada (%)
Place of birth for the foreign-born population - Haiti (%)
Place of birth for the foreign-born population - Jamaica (%)
Place of birth for the foreign-born population - St. Vincent and the Grenadines (%)
Place of birth for the foreign-born population - Trinidad and Tobago (%)
Place of birth for the foreign-born population - West Indies (%)
Place of birth for the foreign-born population - Other Caribbean (%)
Place of birth for the foreign-born population - Belize (%)
Place of birth for the foreign-born population - Costa Rica (%)
Place of birth for the foreign-born population - El Salvador (%)
Place of birth for the foreign-born population - Guatemala (%)
Place of birth for the foreign-born population - Honduras (%)
Place of birth for the foreign-born population - Mexico (%)
Place of birth for the foreign-born population - Nicaragua (%)
Place of birth for the foreign-born population - Panama (%)
Place of birth for the foreign-born population - Other Central America (%)
Place of birth for the foreign-born population - Argentina (%)
Place of birth for the foreign-born population - Bolivia (%)
Place of birth for the foreign-born population - Brazil (%)
Place of birth for the foreign-born population - Chile (%)
Place of birth for the foreign-born population - Colombia (%)
Place of birth for the foreign-born population - Ecuador (%)
Place of birth for the foreign-born population - Guyana (%)
Place of birth for the foreign-born population - Peru (%)
Place of birth for the foreign-born population - Uruguay (%)
Place of birth for the foreign-born population - Venezuela (%)
Place of birth for the foreign-born population - Other South America (%)
Place of birth for the foreign-born population - Canada (%)
Place of birth for the foreign-born population - Other Northern America (%)
Place of birth for the foreign-born population - Other (%)
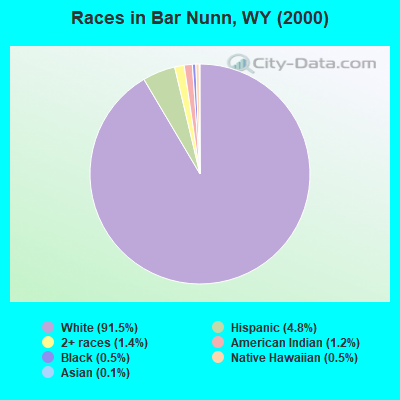
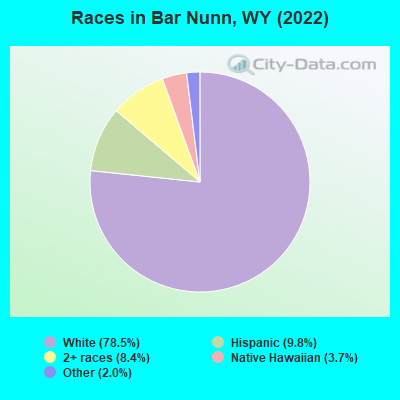
According to 2022 data, the most numerous races in Bar Nunn, WY are White alone (2,314 residents), Hispanic (289 residents), and Two or more races (248 residents). 96.1% of Bar Nunn residents speak English at home. 1.2% of Bar Nunn, WY residents are foreign-born , which is 145.8% less than the foreign-born rate of 3.0% across the entire state of Wyoming.
Race distribution in Bar Nunn
2000 2022
438,799 88.9% White alone 31,669 6.4% Hispanic 10,238 2.1% American Indian alone 6,164 1.2% Two or more races 3,504 0.7% Black alone 2,670 0.5% Asian alone 474 0.10% Other race alone 264 0.05% Native Hawaiian and Other
473,220 81.4% White alone 62,803 10.8% Hispanic 22,911 3.9% Two or more races 9,589 1.6% American Indian alone 4,997 0.9% Other race alone 3,990 0.7% Black alone 3,577 0.6% Asian alone 294 0.05% Native Hawaiian and Other
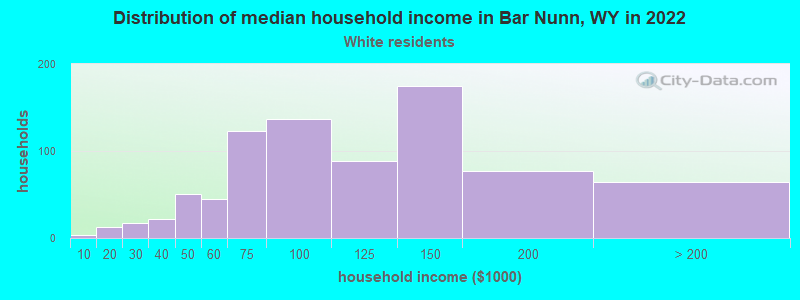
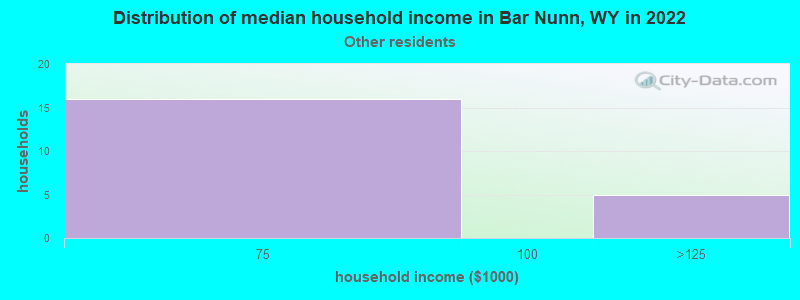
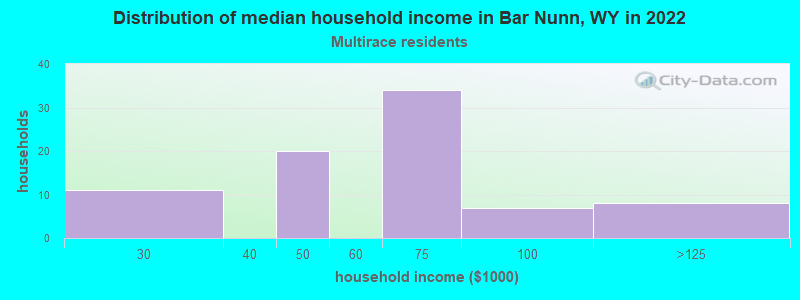
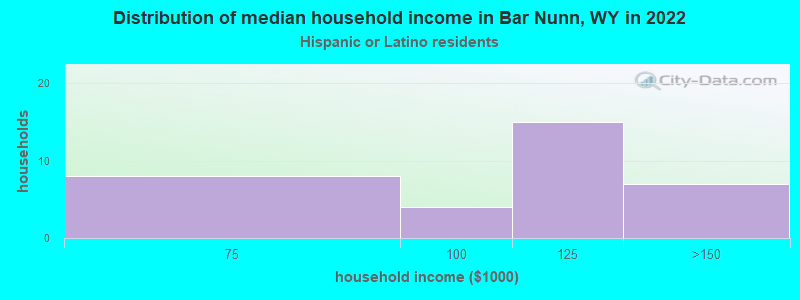
Income and house value in Bar Nunn Median household income in 2022 $101,683 White non-Hispanic householders$64,232 Some other race householders$85,562 Two or more races householders$127,634 Hispanic or Latino race householdersMedian 2022 house value $336,461 White Non-Hispanic householders$357,938 Some other race householders$357,938 Two or more races householders$350,779 Hispanic or Latino householders
Median age by race in Bar Nunn
33.2 Median age for White residents35.0 31.4 -1,324,384,786.1 Median age for Black or African American residents-558,558,558.0 -746,302,615.9 6.9 Median age for American Indian / Alaska Native residents12.6 -642,934,195.7 -1,197,943,443.5 Median age for Asian residents-684,684,684.0 -929,503,915.5 43.3 Median age for Native Hawaiian / Pacific Islander residents-652,729,383.8 -666,666,666.0 75.4 Median age for Other race residents95.0 70.5 39.9 Median age for Two or more races residents33.1 77.1 32.3 Median age for White alone residents35.1 30.5 11.8 Median age for Hispanic or Latino residents9.9 46.5
Owner/renter occupied households by race in Bar Nunn
House owners and renters - White residents 772 95.1% Owner occupied40 4.9% Renter occupiedHouse owners and renters - American Indian / Alaska Native residents 5 100.0% Owner occupiedHouse owners and renters - Native Hawaiian / Pacific Islander residents 38 100.0% Owner occupiedHouse owners and renters - Other race residents 32 100.0% Owner occupiedHouse owners and renters - Two or more races residents 87 100.0% Owner occupiedHouse owners and renters - White alone residents 779 95.1% Owner occupied40 4.9% Renter occupiedHouse owners and renters - Hispanic or Latino residents 36 100.0% Owner occupied
Language usage in Bar Nunn
English speakers - Total 96.1% of residents of Bar Nunn speak English at home.
3.1% of residents speak Spanish at home 88 100.0% Speak English very well0.9% of residents speak other language at home 25 100.0% Speak English very well
English speakers - Born in the United States 98.3% of residents of Bar Nunn speak English at home.
1.0% of residents speak Spanish at home 12 100.0% Speak English very well0.8% of residents speak other language at home 10 100.0% Speak English very well
All residents speak only English at home
English speakers - Foreign-born 31.2% of residents of Bar Nunn speak English at home.
31.2% of residents speak Spanish at home 10 100.0% Speak English very well28.1% of residents speak other language at home 9 100.0% Speak English very well
White (Caucasian) - Speak only English Native:
96.9% (2,136)Foreign-born:
34.4% (3)
White (Caucasian) - Speak another language Native:
2.5% (55)Foreign-born:
62.2% (6)
Other race - Speak another language Native:
12.9% (7)Foreign-born:
100.0% (14)
Two or more races - Speak only English Native:
97.4% (457)Foreign-born:
32.8% (3)
White alone - Speak only English Native:
96.6% (2,111)Foreign-born:
28.9% (4)
White alone - Speak another language Native:
2.8% (62)Foreign-born:
72.5% (10)
Hispanic or Latino - Speak only English Native:
93.7% (235)Foreign-born:
43.4% (8)
Hispanic or Latino - Speak another language Native:
6.1% (15)Foreign-born:
67.5% (12)
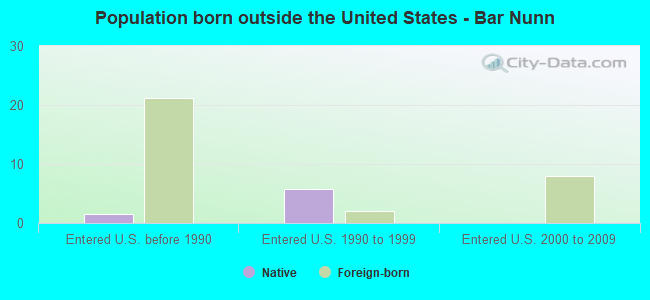
Foreign-born residents in Bar Nunn 36 residents are foreign born
This city:
1.2%Wyoming:
3.4%
Marital status for residents in Bar Nunn Marital status - White (Caucasian) population 15 years and over
Males 22.5% Never married60.7% Now married0.7% Separated3.2% Widowed12.9% DivorcedFemales 17.8% Never married69.4% Now married2.6% Separated2.2% Widowed8.1% DivorcedWomen who gave birth in the past 12 months Now married:
90.2% (35)Unmarried:
9.8% (4)
Women who did not give birth in the past 12 months Now married:
66.8% (372)Unmarried:
33.2% (185)
Marital status - Native Hawaiian / Pacific Islander population 15 years and over
Males 52.9% Never married47.1% Now married0.0% Separated0.0% Widowed0.0% DivorcedFemales 0.0% Never married100.0% Now married0.0% Separated0.0% Widowed0.0% DivorcedWomen who did not give birth in the past 12 months Now married:
100.0% (42)Unmarried:
0.0% (0)
Marital status - Other race population 15 years and over
Males 0.0% Never married75.0% Now married0.0% Separated25.0% Widowed0.0% DivorcedFemales 0.0% Never married79.3% Now married0.0% Separated0.0% Widowed20.7% DivorcedWomen who did not give birth in the past 12 months Now married:
100.0% (10)Unmarried:
0.0% (0)
Marital status - Two or more races population 15 years and over
Males 18.0% Never married74.7% Now married0.0% Separated0.0% Widowed7.3% DivorcedFemales 27.1% Never married60.4% Now married0.0% Separated0.0% Widowed12.5% DivorcedWomen who did not give birth in the past 12 months Now married:
81.2% (39)Unmarried:
18.8% (9)
Marital status - White alone, not Hispanic / Latino population 15 years and over
Males 22.1% Never married60.9% Now married0.7% Separated3.3% Widowed13.0% DivorcedFemales 18.3% Never married68.9% Now married2.6% Separated2.3% Widowed7.8% DivorcedWomen who gave birth in the past 12 months Now married:
90.2% (36)Unmarried:
9.8% (4)
Women who did not give birth in the past 12 months Now married:
66.6% (376)Unmarried:
33.4% (189)
Marital status - Hispanic or Latino population 15 years and over
Males 31.4% Never married60.0% Now married0.0% Separated8.6% Widowed0.0% DivorcedFemales 0.0% Never married78.4% Now married0.0% Separated0.0% Widowed21.6% DivorcedWomen who did not give birth in the past 12 months Now married:
88.5% (23)Unmarried:
11.5% (3)
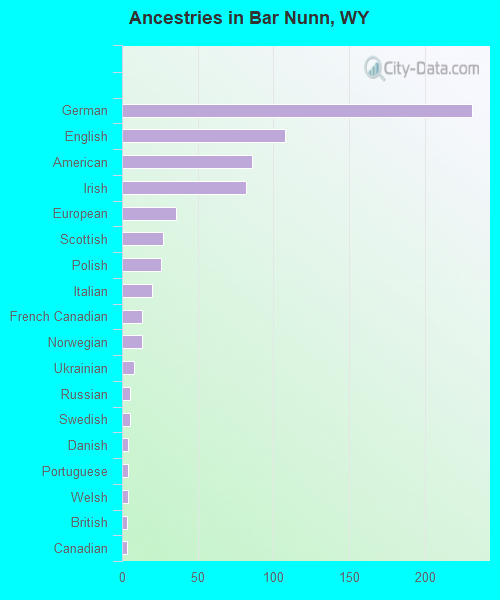
Ancestries in Bar Nunn
231 16.7% German108 7.8% English86 6.2% American82 5.9% Irish36 2.6% European27 2.0% Scottish26 1.9% Polish20 1.4% Italian13 0.9% French Canadian13 0.9% Norwegian8 0.6% Ukrainian5 0.4% Russian5 0.4% Swedish4 0.3% Danish4 0.3% Portuguese4 0.3% Welsh3 0.2% British3 0.2% Canadian
Children Nativity (place of birth) in Bar Nunn
Children under 6 years - Living with two parents Both parents native 174 100.0% NativeChildren under 6 years - Living with one parent Native parent 42 100.0% Native
Children 6 to 17 years - Living with two parents Both parents native 498 100.0% NativeOne native, one foreign-born parent 10 100.0% NativeChildren 6 to 17 years - Living with one parent Native parent 143 100.0% Native
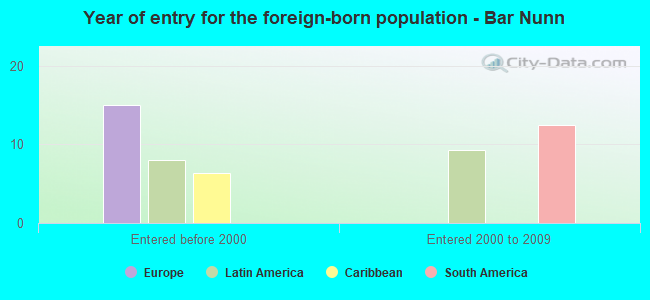
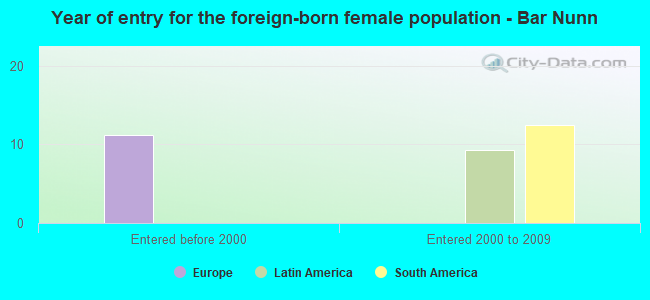
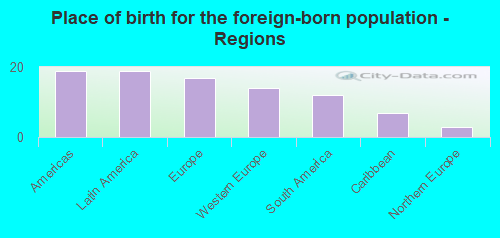
Place of birth for residents in Bar Nunn 19 Americas19 Latin America17 Europe14 Western Europe12 South America7 Caribbean3 Northern Europe
Grandparents responsible for own grandchildren in Bar Nunn
Grandparents (30 to 59 years) White / Caucasian 6 25.7% Responsible for grandchildren18 74.3% Not responsible for grandchildrenAmerican Indian / Alaska Native 4 100.0% Responsible for grandchildrenWhite alone, not Hispanic / Latino 8 30.6% Responsible for grandchildren19 69.4% Not responsible for grandchildrenHispanic or Latino 6 100.0% Responsible for grandchildrenGrandparents (60 years and over) White / Caucasian 7 49.1% Responsible for grandchildren7 50.9% Not responsible for grandchildrenWhite alone, not Hispanic / Latino 8 50.8% Responsible for grandchildren7 49.2% Not responsible for grandchildren