Races in Baraboo, Wisconsin (WI) Detailed Stats
Data:
Races - White alone (%)
Races - White alone (% change since 2000)
Races - Black alone (%)
Races - Black alone (% change since 2000)
Races - American Indian alone (%)
Races - American Indian alone (% change since 2000)
Races - Asian alone (%)
Races - Asian alone (% change since 2000)
Races - Hispanic (%)
Races - Hispanic (% change since 2000)
Races - Native Hawaiian and Other Pacific Islander alone (%)
Races - Native Hawaiian and Other Pacific Islander alone (% change since 2000)
Races - Two or more races(%)
Races - Two or more races(% change since 2000)
Races - Other race alone (%)
Races - Other race alone (% change since 2000)
Racial diversity
Place of birth - Born in state of residence (%)
Place of birth - Born in state of residence (%) - White
Place of birth - Born in state of residence (%) - Black or African American
Place of birth - Born in state of residence (%) - Asian
Place of birth - Born in state of residence (%) - Hispanic or Latino
Place of birth - Born in state of residence (%) - American Indian and Alaska Native
Place of birth - Born in state of residence (%) - Multirace
Place of birth - Born in state of residence (%) - Other Race
Place of birth - Born in other state (%)
Place of birth - Born in other state (%) - White
Place of birth - Born in other state (%) - Black or African American
Place of birth - Born in other state (%) - Asian
Place of birth - Born in other state (%) - Hispanic or Latino
Place of birth - Born in other state (%) - American Indian and Alaska Native
Place of birth - Born in other state (%) - Multirace
Place of birth - Born in other state (%) - Other Race
Place of birth - Native, outside of US (%)
Place of birth - Native, outside of US (%) - White
Place of birth - Native, outside of US (%) - Black or African American
Place of birth - Native, outside of US (%) - Asian
Place of birth - Native, outside of US (%) - Hispanic or Latino
Place of birth - Native, outside of US (%) - American Indian and Alaska Native
Place of birth - Native, outside of US (%) - Multirace
Place of birth - Native, outside of US (%) - Other Race
Place of birth - Foreign born (%)
Place of birth - Foreign born (%) - White
Place of birth - Foreign born (%) - Black or African American
Place of birth - Foreign born (%) - Asian
Place of birth - Foreign born (%) - Hispanic or Latino
Place of birth - Foreign born (%) - American Indian and Alaska Native
Place of birth - Foreign born (%) - Multirace
Place of birth - Foreign born (%) - Other Race
Residents speaking English at home (%)
Residents speaking English at home - Born in the United States (%)
Residents speaking English at home - Native, born elsewhere (%)
Residents speaking English at home - Foreign born (%)
Residents speaking Spanish at home (%)
Residents speaking Spanish at home - Born in the United States (%)
Residents speaking Spanish at home - Native, born elsewhere (%)
Residents speaking Spanish at home - Foreign born (%)
Residents speaking other language at home (%)
Residents speaking other language at home - Born in the United States (%)
Residents speaking other language at home - Native, born elsewhere (%)
Residents speaking other language at home - Foreign born (%)
Marital status - Never married (%)
Marital status - Now married (%)
Marital status - Separated (%)
Marital status - Widowed (%)
Marital status - Divorced (%)
Ancestries Reported - Arab (%)
Ancestries Reported - Czech (%)
Ancestries Reported - Danish (%)
Ancestries Reported - Dutch (%)
Ancestries Reported - English (%)
Ancestries Reported - French (%)
Ancestries Reported - French Canadian (%)
Ancestries Reported - German (%)
Ancestries Reported - Greek (%)
Ancestries Reported - Hungarian (%)
Ancestries Reported - Irish (%)
Ancestries Reported - Italian (%)
Ancestries Reported - Lithuanian (%)
Ancestries Reported - Norwegian (%)
Ancestries Reported - Polish (%)
Ancestries Reported - Portuguese (%)
Ancestries Reported - Russian (%)
Ancestries Reported - Scotch-Irish (%)
Ancestries Reported - Scottish (%)
Ancestries Reported - Slovak (%)
Ancestries Reported - Subsaharan African (%)
Ancestries Reported - Swedish (%)
Ancestries Reported - Swiss (%)
Ancestries Reported - Ukrainian (%)
Ancestries Reported - United States (%)
Ancestries Reported - Welsh (%)
Ancestries Reported - West Indian (%)
Ancestries Reported - Other (%)
Geographical mobility - Same house 1 year ago (%)
Geographical mobility - Same house 1 year ago (%) - White
Geographical mobility - Same house 1 year ago (%) - Black or African American
Geographical mobility - Same house 1 year ago (%) - Asian
Geographical mobility - Same house 1 year ago (%) - Hispanic or Latino
Geographical mobility - Same house 1 year ago (%) - American Indian and Alaska Native
Geographical mobility - Same house 1 year ago (%) - Multirace
Geographical mobility - Same house 1 year ago (%) - Other Race
Geographical mobility - Moved within same county (%)
Geographical mobility - Moved within same county (%) - White
Geographical mobility - Moved within same county (%) - Black or African American
Geographical mobility - Moved within same county (%) - Asian
Geographical mobility - Moved within same county (%) - Hispanic or Latino
Geographical mobility - Moved within same county (%) - American Indian and Alaska Native
Geographical mobility - Moved within same county (%) - Multirace
Geographical mobility - Moved within same county (%) - Other Race
Geographical mobility - Moved from different county within same state (%)
Geographical mobility - Moved from different county within same state (%) - White
Geographical mobility - Moved from different county within same state (%) - Black or African American
Geographical mobility - Moved from different county within same state (%) - Asian
Geographical mobility - Moved from different county within same state (%) - Hispanic or Latino
Geographical mobility - Moved from different county within same state (%) - American Indian and Alaska Native
Geographical mobility - Moved from different county within same state (%) - Multirace
Geographical mobility - Moved from different county within same state (%) - Other Race
Geographical mobility - Moved from different state (%)
Geographical mobility - Moved from different state (%) - White
Geographical mobility - Moved from different state (%) - Black or African American
Geographical mobility - Moved from different state (%) - Asian
Geographical mobility - Moved from different state (%) - Hispanic or Latino
Geographical mobility - Moved from different state (%) - American Indian and Alaska Native
Geographical mobility - Moved from different state (%) - Multirace
Geographical mobility - Moved from different state (%) - Other Race
Geographical mobility - Moved from abroad (%)
Geographical mobility - Moved from abroad (%) - White
Geographical mobility - Moved from abroad (%) - Black or African American
Geographical mobility - Moved from abroad (%) - Asian
Geographical mobility - Moved from abroad (%) - Hispanic or Latino
Geographical mobility - Moved from abroad (%) - American Indian and Alaska Native
Geographical mobility - Moved from abroad (%) - Multirace
Geographical mobility - Moved from abroad (%) - Other Race
Place of birth for the foreign-born population - Ireland (%)
Place of birth for the foreign-born population - Denmark (%)
Place of birth for the foreign-born population - Norway (%)
Place of birth for the foreign-born population - Sweden (%)
Place of birth for the foreign-born population - United Kingdom (%)
Place of birth for the foreign-born population - England (%)
Place of birth for the foreign-born population - Scotland (%)
Place of birth for the foreign-born population - Other Northern Europe (%)
Place of birth for the foreign-born population - Austria (%)
Place of birth for the foreign-born population - Belgium (%)
Place of birth for the foreign-born population - France (%)
Place of birth for the foreign-born population - Germany (%)
Place of birth for the foreign-born population - Netherlands (%)
Place of birth for the foreign-born population - Switzerland (%)
Place of birth for the foreign-born population - Other Western Europe (%)
Place of birth for the foreign-born population - Greece (%)
Place of birth for the foreign-born population - Italy (%)
Place of birth for the foreign-born population - Portugal (%)
Place of birth for the foreign-born population - Spain (%)
Place of birth for the foreign-born population - Other Southern Europe (%)
Place of birth for the foreign-born population - Albania (%)
Place of birth for the foreign-born population - Belarus (%)
Place of birth for the foreign-born population - Bosnia and Herzegovina (%)
Place of birth for the foreign-born population - Bulgaria (%)
Place of birth for the foreign-born population - Croatia (%)
Place of birth for the foreign-born population - Czechoslovakia (%)
Place of birth for the foreign-born population - Hungary (%)
Place of birth for the foreign-born population - Latvia (%)
Place of birth for the foreign-born population - Lithuania (%)
Place of birth for the foreign-born population - North Macedonia (Macedonia) (%)
Place of birth for the foreign-born population - Moldova (%)
Place of birth for the foreign-born population - Poland (%)
Place of birth for the foreign-born population - Romania (%)
Place of birth for the foreign-born population - Russia (%)
Place of birth for the foreign-born population - Serbia (%)
Place of birth for the foreign-born population - Ukraine (%)
Place of birth for the foreign-born population - Other Eastern Europe (%)
Place of birth for the foreign-born population - China (%)
Place of birth for the foreign-born population - Hong Kong (%)
Place of birth for the foreign-born population - Taiwan (%)
Place of birth for the foreign-born population - Japan (%)
Place of birth for the foreign-born population - Korea (%)
Place of birth for the foreign-born population - Other Eastern Asia (%)
Place of birth for the foreign-born population - Afghanistan (%)
Place of birth for the foreign-born population - Bangladesh (%)
Place of birth for the foreign-born population - India (%)
Place of birth for the foreign-born population - Iran (%)
Place of birth for the foreign-born population - Kazakhstan (%)
Place of birth for the foreign-born population - Nepal (%)
Place of birth for the foreign-born population - Pakistan (%)
Place of birth for the foreign-born population - Sri Lanka (%)
Place of birth for the foreign-born population - Uzbekistan (%)
Place of birth for the foreign-born population - Other South Central Asia (%)
Place of birth for the foreign-born population - Burma (%)
Place of birth for the foreign-born population - Cambodia (%)
Place of birth for the foreign-born population - Indonesia (%)
Place of birth for the foreign-born population - Laos (%)
Place of birth for the foreign-born population - Malaysia (%)
Place of birth for the foreign-born population - Philippines (%)
Place of birth for the foreign-born population - Singapore (%)
Place of birth for the foreign-born population - Thailand (%)
Place of birth for the foreign-born population - Vietnam (%)
Place of birth for the foreign-born population - Other South Eastern Asia (%)
Place of birth for the foreign-born population - Armenia (%)
Place of birth for the foreign-born population - Iraq (%)
Place of birth for the foreign-born population - Israel (%)
Place of birth for the foreign-born population - Jordan (%)
Place of birth for the foreign-born population - Kuwait (%)
Place of birth for the foreign-born population - Lebanon (%)
Place of birth for the foreign-born population - Saudi Arabia (%)
Place of birth for the foreign-born population - Syria (%)
Place of birth for the foreign-born population - Turkey (%)
Place of birth for the foreign-born population - Yemen (%)
Place of birth for the foreign-born population - Other Western Asia (%)
Place of birth for the foreign-born population - Eritrea (%)
Place of birth for the foreign-born population - Ethiopia (%)
Place of birth for the foreign-born population - Kenya (%)
Place of birth for the foreign-born population - Somalia (%)
Place of birth for the foreign-born population - Uganda (%)
Place of birth for the foreign-born population - Zimbabwe (%)
Place of birth for the foreign-born population - Other Eastern Africa (%)
Place of birth for the foreign-born population - Cameroon (%)
Place of birth for the foreign-born population - Congo (%)
Place of birth for the foreign-born population - Democratic Republic of Congo (Zaire) (%)
Place of birth for the foreign-born population - Other Middle Africa (%)
Place of birth for the foreign-born population - Egypt (%)
Place of birth for the foreign-born population - Morocco (%)
Place of birth for the foreign-born population - Sudan (%)
Place of birth for the foreign-born population - Other Northern Africa (%)
Place of birth for the foreign-born population - South Africa (%)
Place of birth for the foreign-born population - Other Southern Africa (%)
Place of birth for the foreign-born population - Cabo Verde (%)
Place of birth for the foreign-born population - Ghana (%)
Place of birth for the foreign-born population - Liberia (%)
Place of birth for the foreign-born population - Nigeria (%)
Place of birth for the foreign-born population - Senegal (%)
Place of birth for the foreign-born population - Sierra Leone (%)
Place of birth for the foreign-born population - Other Western Africa (%)
Place of birth for the foreign-born population - Australia (%)
Place of birth for the foreign-born population - New Zealand (%)
Place of birth for the foreign-born population - Fiji (%)
Place of birth for the foreign-born population - Micronesia (%)
Place of birth for the foreign-born population - Bahamas (%)
Place of birth for the foreign-born population - Barbados (%)
Place of birth for the foreign-born population - Cuba (%)
Place of birth for the foreign-born population - Dominica (%)
Place of birth for the foreign-born population - Dominican Republic (%)
Place of birth for the foreign-born population - Grenada (%)
Place of birth for the foreign-born population - Haiti (%)
Place of birth for the foreign-born population - Jamaica (%)
Place of birth for the foreign-born population - St. Vincent and the Grenadines (%)
Place of birth for the foreign-born population - Trinidad and Tobago (%)
Place of birth for the foreign-born population - West Indies (%)
Place of birth for the foreign-born population - Other Caribbean (%)
Place of birth for the foreign-born population - Belize (%)
Place of birth for the foreign-born population - Costa Rica (%)
Place of birth for the foreign-born population - El Salvador (%)
Place of birth for the foreign-born population - Guatemala (%)
Place of birth for the foreign-born population - Honduras (%)
Place of birth for the foreign-born population - Mexico (%)
Place of birth for the foreign-born population - Nicaragua (%)
Place of birth for the foreign-born population - Panama (%)
Place of birth for the foreign-born population - Other Central America (%)
Place of birth for the foreign-born population - Argentina (%)
Place of birth for the foreign-born population - Bolivia (%)
Place of birth for the foreign-born population - Brazil (%)
Place of birth for the foreign-born population - Chile (%)
Place of birth for the foreign-born population - Colombia (%)
Place of birth for the foreign-born population - Ecuador (%)
Place of birth for the foreign-born population - Guyana (%)
Place of birth for the foreign-born population - Peru (%)
Place of birth for the foreign-born population - Uruguay (%)
Place of birth for the foreign-born population - Venezuela (%)
Place of birth for the foreign-born population - Other South America (%)
Place of birth for the foreign-born population - Canada (%)
Place of birth for the foreign-born population - Other Northern America (%)
Place of birth for the foreign-born population - Other (%)
Latest news about races in Baraboo, WI collected exclusively by city-data.com from local newspapers, TV, and radio stations
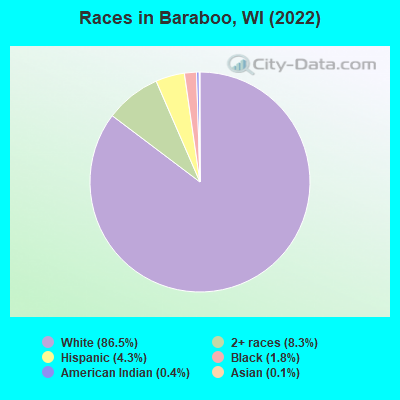
According to 2022 data, the most numerous races in Baraboo, WI are White alone (10,868 residents), Hispanic (536 residents), and Black alone (223 residents). 93.8% of Baraboo residents speak English at home. 2.3% of Baraboo, WI residents are foreign-born (1.3% born in Latin America, 0.8% born in Europe), which is 119.6% less than the foreign-born rate of 5.0% across the entire state of Wisconsin.
Race distribution in Baraboo
2000 2022
4,681,630 87.3% White alone 300,245 5.6% Black alone 192,921 3.6% Hispanic 87,995 1.6% Asian alone 51,921 1.0% Two or more races 43,980 0.8% American Indian alone 3,637 0.07% Other race alone 1,346 0.03% Native Hawaiian and Other
4,654,031 79.0% White alone 447,022 7.6% Hispanic 345,678 5.9% Black alone 217,532 3.7% Two or more races 172,242 2.9% Asian alone 33,762 0.6% American Indian alone 19,680 0.3% Other race alone 2,592 0.04% Native Hawaiian and Other
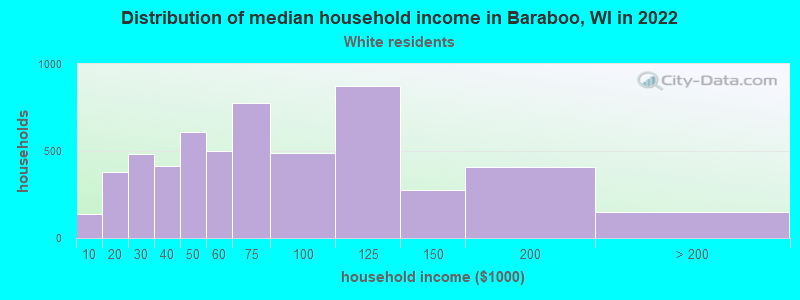
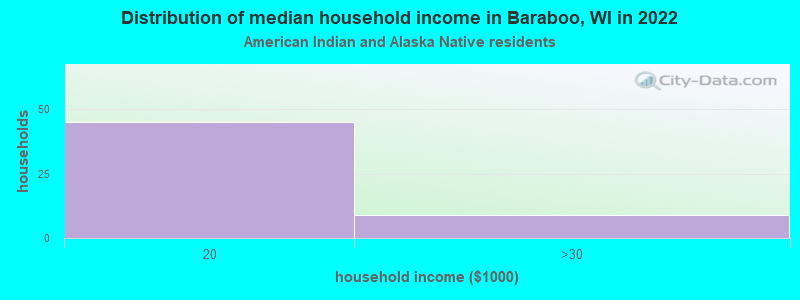
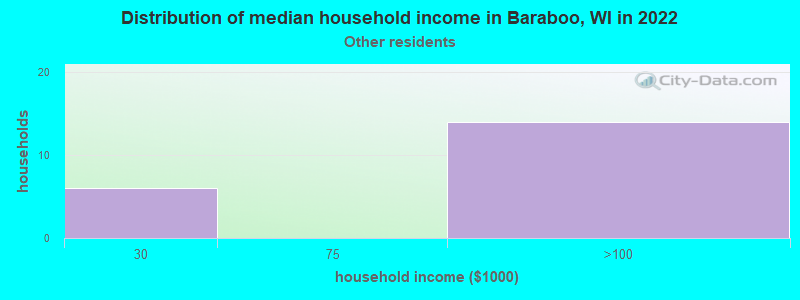
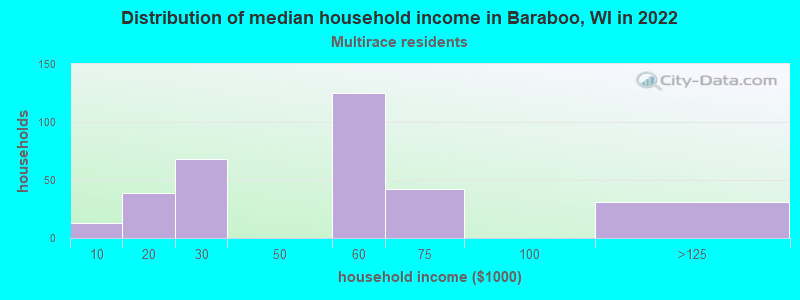
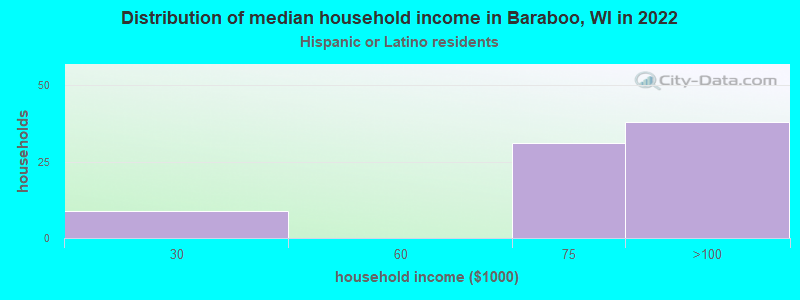
Income and house value in Baraboo Median household income in 2022 $65,666 White non-Hispanic householders$59,053 Two or more races householders$51,703 Hispanic or Latino race householdersMedian 2022 house value $230,008 White Non-Hispanic householders$160,931 Black or African American householders$383,760 Two or more races householders$136,173 Hispanic or Latino householders
Median age by race in Baraboo
43.4 Median age for White residents43.9 42.6 41.0 Median age for Black or African American residents39.0 69.8 43.0 Median age for American Indian / Alaska Native residents-1,053,459,118.4 84.2 -612,179,486.6 Median age for Asian residents-584,415,583.8 -576,051,779.4 -666,666,666.0 Median age for Native Hawaiian / Pacific Islander residents-666,666,666.0 -666,666,666.0 34.5 Median age for Other race residents23.9 43.7 31.1 Median age for Two or more races residents28.9 24.2 43.4 Median age for White alone residents43.8 42.2 28.3 Median age for Hispanic or Latino residents29.9 39.6
Owner/renter occupied households by race in Baraboo
House owners and renters - White residents 3,738 69.2% Owner occupied1,664 30.8% Renter occupiedHouse owners and renters - American Indian / Alaska Native residents 52 100.0% Owner occupiedHouse owners and renters - Asian residents 18 100.0% Renter occupiedHouse owners and renters - Other race residents 10 57.7% Owner occupied8 42.3% Renter occupiedHouse owners and renters - Two or more races residents 171 50.6% Owner occupied167 49.4% Renter occupiedHouse owners and renters - White alone residents 3,803 69.7% Owner occupied1,651 30.3% Renter occupiedHouse owners and renters - Hispanic or Latino residents 20 26.0% Owner occupied56 74.0% Renter occupied
Language usage in Baraboo
English speakers - Total 93.8% of residents of Baraboo speak English at home.
3.7% of residents speak Spanish at home 316 70.7% Speak English very well131 29.3% Speak English less than very well2.0% of residents speak other language at home 151 64.5% Speak English very well83 35.5% Speak English less than very well
English speakers - Born in the United States 94.9% of residents of Baraboo speak English at home.
5.0% of residents speak Spanish at home 189 92.6% Speak English very well15 7.4% Speak English less than very well0.9% of residents speak other language at home 11 31.4% Speak English very well24 68.6% Speak English less than very well
English speakers - Native, born elsewhere 59.4% of residents of Baraboo speak English at home.
51.0% of residents speak Spanish at home 10 20.4% Speak English very well39 79.6% Speak English less than very well
English speakers - Foreign-born 5.0% of residents of Baraboo speak English at home.
35.6% of residents speak Spanish at home 103 85.1% Speak English very well18 14.9% Speak English less than very well42.4% of residents speak other language at home 59 41.0% Speak English very well85 59.0% Speak English less than very well
White (Caucasian) - Speak only English Native:
99.3% (10,220)Foreign-born:
8.6% (6)
White (Caucasian) - Speak another language Native:
1.4% (144)Foreign-born:
89.9% (68)
Black or African American - Speak another language Native:
3.3% (3)Foreign-born:
100.0% (69)
Other race - Speak only English Native:
41.5% (34)Foreign-born:
13.1% (12)
Other race - Speak another language Native:
50.4% (41)Foreign-born:
87.3% (80)
White alone - Speak only English Native:
99.2% (10,275)Foreign-born:
8.2% (8)
White alone - Speak another language Native:
1.2% (119)Foreign-born:
93.1% (92)
Hispanic or Latino - Speak only English Native:
20.8% (56)Foreign-born:
7.4% (11)
Hispanic or Latino - Speak another language Native:
88.3% (239)Foreign-born:
97.7% (141)
Foreign-born residents in Baraboo 286 residents are foreign born (1.3% Latin America , 0.8% Europe ).
This city:
2.3%Wisconsin:
5.0%
Marital status for residents in Baraboo Marital status - White (Caucasian) population 15 years and over
Males 37.4% Never married44.8% Now married0.5% Separated3.5% Widowed13.9% DivorcedFemales 23.3% Never married44.9% Now married3.7% Separated10.2% Widowed17.9% DivorcedWomen who gave birth in the past 12 months Now married:
94.9% (156)Unmarried:
5.1% (8)
Women who did not give birth in the past 12 months Now married:
43.2% (933)Unmarried:
56.8% (1,229)
Marital status - Black or African American population 15 years and over
Males 70.0% Never married30.0% Now married0.0% Separated0.0% Widowed0.0% DivorcedFemales 36.4% Never married40.9% Now married0.0% Separated0.0% Widowed22.7% DivorcedWomen who did not give birth in the past 12 months Now married:
90.0% (9)Unmarried:
10.0% (1)
Marital status - American Indian / Alaska Native population 15 years and over
Males 91.1% Never married0.0% Now married0.0% Separated0.0% Widowed8.9% DivorcedFemales 29.2% Never married0.0% Now married0.0% Separated33.3% Widowed37.5% DivorcedMarital status - Other race population 15 years and over
Males 50.8% Never married42.6% Now married0.0% Separated6.6% Widowed0.0% DivorcedFemales 10.5% Never married89.5% Now married0.0% Separated0.0% Widowed0.0% DivorcedWomen who gave birth in the past 12 months Now married:
0.0% (0)Unmarried:
100.0% (8)
Women who did not give birth in the past 12 months Now married:
100.0% (17)Unmarried:
0.0% (0)
Marital status - Two or more races population 15 years and over
Males 55.9% Never married30.7% Now married0.0% Separated0.0% Widowed13.4% DivorcedFemales 32.8% Never married21.2% Now married0.0% Separated0.0% Widowed46.0% DivorcedWomen who gave birth in the past 12 months Now married:
0.0% (0)Unmarried:
100.0% (163)
Women who did not give birth in the past 12 months Now married:
42.3% (80)Unmarried:
57.7% (110)
Marital status - White alone, not Hispanic / Latino population 15 years and over
Males 38.1% Never married43.7% Now married0.5% Separated3.5% Widowed14.0% DivorcedFemales 23.1% Never married44.8% Now married3.7% Separated10.3% Widowed18.1% DivorcedWomen who gave birth in the past 12 months Now married:
94.3% (143)Unmarried:
5.7% (9)
Women who did not give birth in the past 12 months Now married:
43.4% (962)Unmarried:
56.6% (1,253)
Marital status - Hispanic or Latino population 15 years and over
Males 30.2% Never married65.6% Now married0.0% Separated1.9% Widowed2.4% DivorcedFemales 16.6% Never married83.4% Now married0.0% Separated0.0% Widowed0.0% DivorcedWomen who gave birth in the past 12 months Now married:
67.9% (20)Unmarried:
32.1% (9)
Women who did not give birth in the past 12 months Now married:
74.6% (46)Unmarried:
25.4% (16)
Ancestries in Baraboo
1,518 33.9% German310 6.9% American235 5.3% Norwegian210 4.7% English208 4.6% Polish207 4.6% European195 4.4% Irish158 3.5% Italian110 2.5% Dutch70 1.6% French46 1.0% Slovene45 1.0% Scottish39 0.9% Swedish34 0.8% Haitian30 0.7% Slovak22 0.5% Jamaican19 0.4% Pennsylvania German17 0.4% British14 0.3% French Canadian11 0.2% Ukrainian6 0.1% Czechoslovakian6 0.1% Russian3 0.07% Scandinavian
Children Nativity (place of birth) in Baraboo
Children under 6 years - Living with two parents Both parents native 483 100.0% NativeBoth parents foreign-born 43 100.0% NativeOne native, one foreign-born parent 32 100.0% NativeChildren under 6 years - Living with one parent Native parent 115 100.0% Native
Children 6 to 17 years - Living with two parents Both parents native 893 99.8% Native2 0.2% Foreign-bornOne native, one foreign-born parent 10 100.0% Foreign-bornChildren 6 to 17 years - Living with one parent Native parent 573 98.8% Native7 1.2% Foreign-born
Grandparents responsible for own grandchildren in Baraboo
Grandparents (30 to 59 years) White / Caucasian 52 100.0% Responsible for grandchildrenWhite alone, not Hispanic / Latino 54 100.0% Responsible for grandchildren
Grandparents (60 years and over) White / Caucasian 26 100.0% Not responsible for grandchildrenWhite alone, not Hispanic / Latino 27 100.0% Not responsible for grandchildren