Races in Barclay-Kingston, New Jersey (NJ) Detailed Stats
Ancestries, Foreign-born residents, place of birth

Recent posts about races in Barclay-Kingston, New Jersey on our local forum with over 2,400,000 registered users:
 | Cherry Hill- Barclay-Kingston or Erlton-Ellisburg sections? (3 replies) |
9.2% of Barclay-Kingston, NJ residents are foreign-born (6.0% born in Asia, 1.9% born in Europe), which is 150.2% less than the foreign-born rate of 23.0% across the entire state of New Jersey.
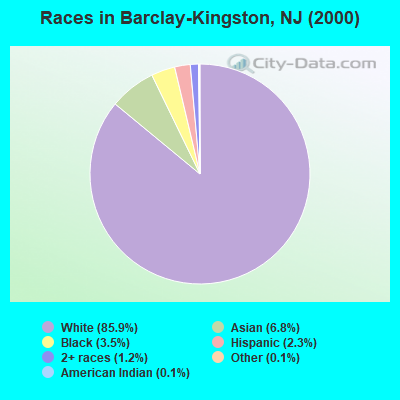
Race distribution in Barclay-Kingston

- 9,21985.9%White alone
- 7296.8%Asian alone
- 3753.5%Black alone
- 2442.3%Hispanic
- 1331.2%Two or more races
- 150.1%Other race alone
- 120.1%American Indian alone
- 10.01%Native Hawaiian and Other
Pacific Islander alone
2000
2022
-
- 5,557,20966.0%White alone
- 1,117,19113.3%Hispanic
- 1,096,17113.0%Black alone
- 477,0125.7%Asian alone
- 133,6891.6%Two or more races
- 19,5650.2%Other race alone
- 11,3380.1%American Indian alone
- 2,1750.03%Native Hawaiian and Other
Pacific Islander alone

-
- 4,766,47651.5%White alone
- 2,028,47021.9%Hispanic
- 1,111,63212.0%Black alone
- 923,54610.0%Asian alone
- 332,2373.6%Two or more races
- 89,8471.0%Other race alone
- 8,5570.09%American Indian alone
- 9340.01%Native Hawaiian and Other
Pacific Islander alone

Income and house value in Barclay-Kingston
- Median household income in 2022
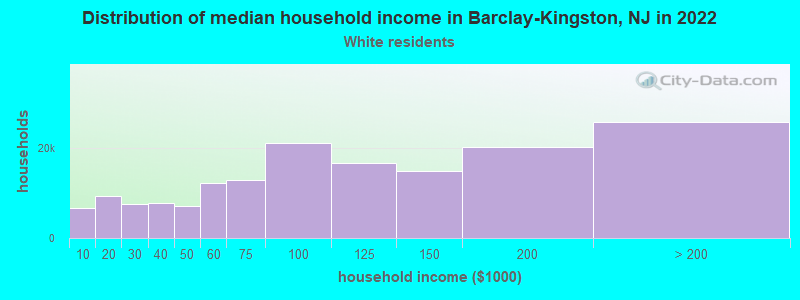
- $125,117White non-Hispanic householders
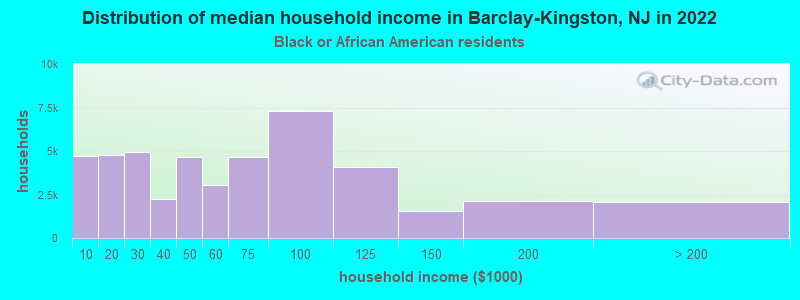
- $69,162Black householders
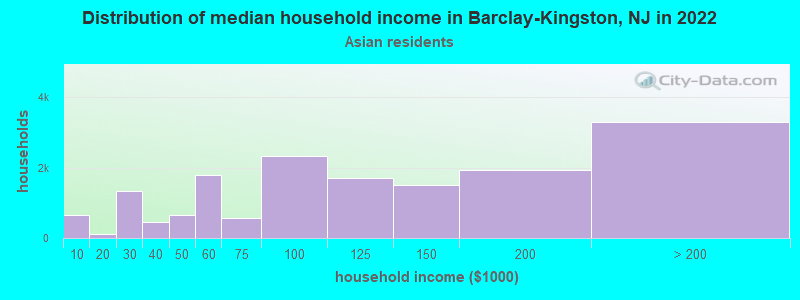
- $157,964Asian householders
- $93,379Some other race householders
- $121,950Two or more races householders
- $71,716Hispanic or Latino race householders
- Median 2022 house value
- $367,559White Non-Hispanic householders
- $331,616Black or African American householders
- $350,326Asian householders
- $293,949Two or more races householders
- $307,735Hispanic or Latino householders
Household income for White non-Hispanic householders
Household income for Black householders
Household income for Asian householders
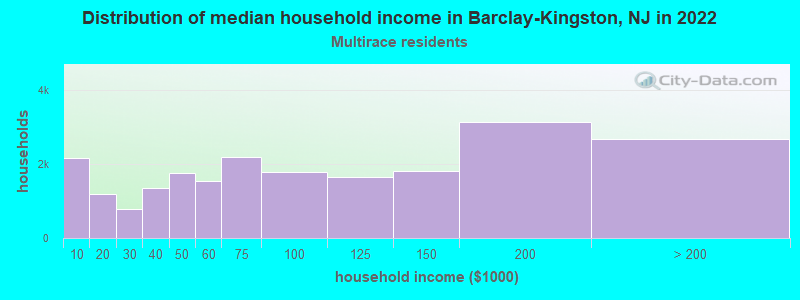
Household income for Two or more races householders
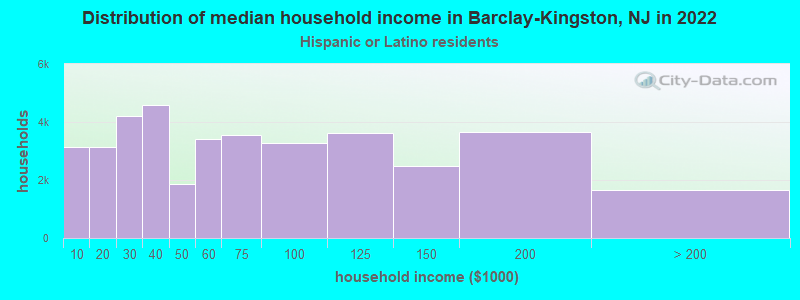
Household income for Hispanic or Latino race householders
Foreign-born residents in Barclay-Kingston
986 residents are foreign born (6.0% Asia, 1.9% Europe).
| This city: | 9.2% |
| New Jersey: | 17.5% |
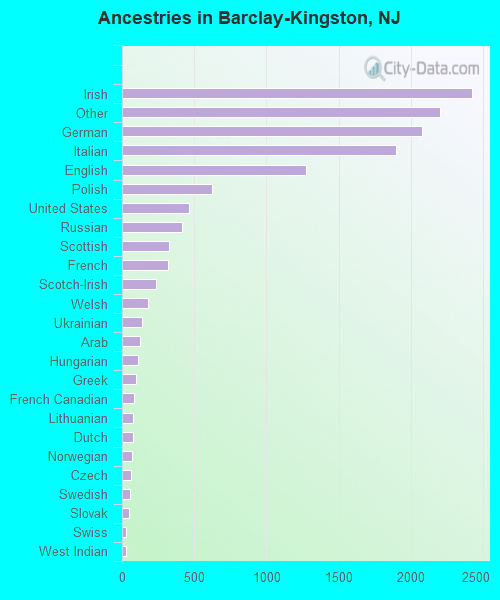
Ancestries in Barclay-Kingston

- 2,42018.0%Irish
- 2,20116.4%Other
- 2,07715.5%German
- 1,89514.1%Italian
- 1,2759.5%English
- 6234.6%Polish
- 4623.4%United States
- 4133.1%Russian
- 3242.4%Scottish
- 3182.4%French
- 2331.7%Scotch-Irish
- 1781.3%Welsh
- 1361.0%Ukrainian
- 1250.9%Arab
- 1140.8%Hungarian
- 940.7%Greek
- 850.6%French Canadian
- 780.6%Lithuanian
- 730.5%Dutch
- 680.5%Norwegian
- 640.5%Czech
- 520.4%Swedish
- 470.4%Slovak
- 260.2%Swiss
- 250.2%West Indian
- 140.1%Subsaharan African
- 60.04%Danish
Zip codes: 08034.