Races in Bardmoor, Florida (FL) Detailed Stats
Data:
Races - White alone (%)
Races - White alone (% change since 2000)
Races - Black alone (%)
Races - Black alone (% change since 2000)
Races - American Indian alone (%)
Races - American Indian alone (% change since 2000)
Races - Asian alone (%)
Races - Asian alone (% change since 2000)
Races - Hispanic (%)
Races - Hispanic (% change since 2000)
Races - Native Hawaiian and Other Pacific Islander alone (%)
Races - Native Hawaiian and Other Pacific Islander alone (% change since 2000)
Races - Two or more races(%)
Races - Two or more races(% change since 2000)
Races - Other race alone (%)
Races - Other race alone (% change since 2000)
Racial diversity
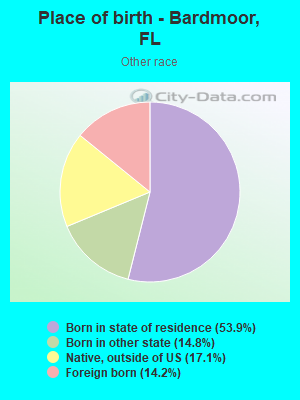
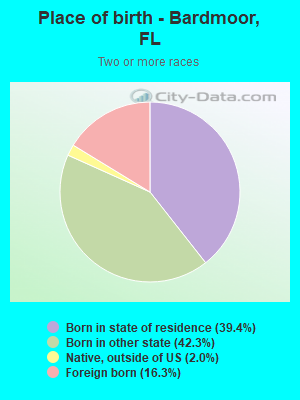
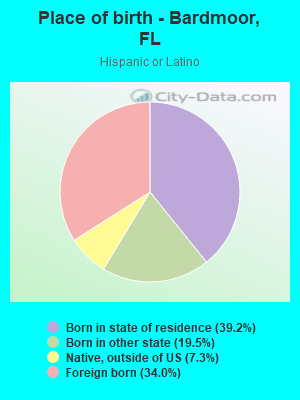
Place of birth - Born in state of residence (%)
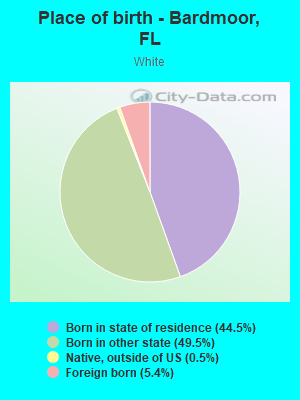
Place of birth - Born in state of residence (%) - White
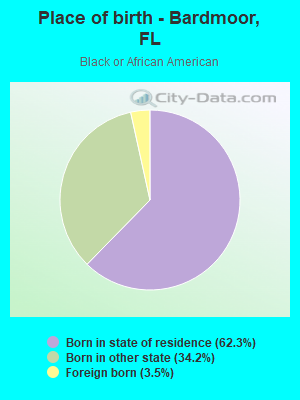
Place of birth - Born in state of residence (%) - Black or African American
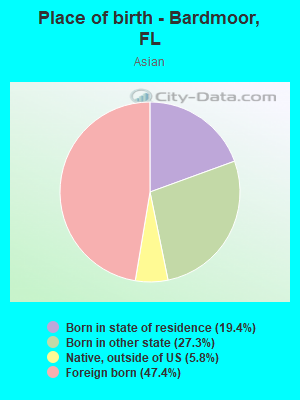
Place of birth - Born in state of residence (%) - Asian
Place of birth - Born in state of residence (%) - Hispanic or Latino
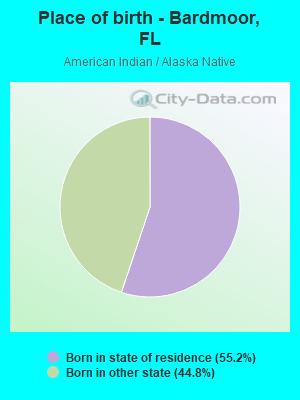
Place of birth - Born in state of residence (%) - American Indian and Alaska Native
Place of birth - Born in state of residence (%) - Multirace
Place of birth - Born in state of residence (%) - Other Race
Place of birth - Born in other state (%)
Place of birth - Born in other state (%) - White
Place of birth - Born in other state (%) - Black or African American
Place of birth - Born in other state (%) - Asian
Place of birth - Born in other state (%) - Hispanic or Latino
Place of birth - Born in other state (%) - American Indian and Alaska Native
Place of birth - Born in other state (%) - Multirace
Place of birth - Born in other state (%) - Other Race
Place of birth - Native, outside of US (%)
Place of birth - Native, outside of US (%) - White
Place of birth - Native, outside of US (%) - Black or African American
Place of birth - Native, outside of US (%) - Asian
Place of birth - Native, outside of US (%) - Hispanic or Latino
Place of birth - Native, outside of US (%) - American Indian and Alaska Native
Place of birth - Native, outside of US (%) - Multirace
Place of birth - Native, outside of US (%) - Other Race
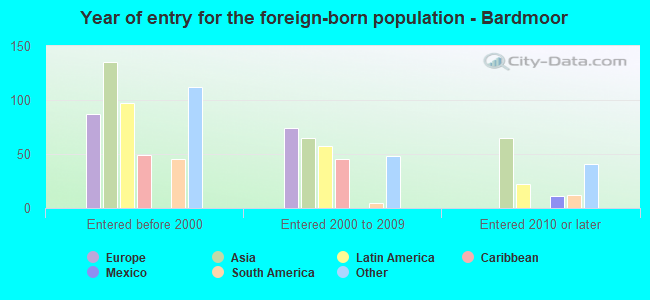
Place of birth - Foreign born (%)
Place of birth - Foreign born (%) - White
Place of birth - Foreign born (%) - Black or African American
Place of birth - Foreign born (%) - Asian
Place of birth - Foreign born (%) - Hispanic or Latino
Place of birth - Foreign born (%) - American Indian and Alaska Native
Place of birth - Foreign born (%) - Multirace
Place of birth - Foreign born (%) - Other Race
Residents speaking English at home (%)
Residents speaking English at home - Born in the United States (%)
Residents speaking English at home - Native, born elsewhere (%)
Residents speaking English at home - Foreign born (%)
Residents speaking Spanish at home (%)
Residents speaking Spanish at home - Born in the United States (%)
Residents speaking Spanish at home - Native, born elsewhere (%)
Residents speaking Spanish at home - Foreign born (%)
Residents speaking other language at home (%)
Residents speaking other language at home - Born in the United States (%)
Residents speaking other language at home - Native, born elsewhere (%)
Residents speaking other language at home - Foreign born (%)
Marital status - Never married (%)
Marital status - Now married (%)
Marital status - Separated (%)
Marital status - Widowed (%)
Marital status - Divorced (%)
Ancestries Reported - Arab (%)
Ancestries Reported - Czech (%)
Ancestries Reported - Danish (%)
Ancestries Reported - Dutch (%)
Ancestries Reported - English (%)
Ancestries Reported - French (%)
Ancestries Reported - French Canadian (%)
Ancestries Reported - German (%)
Ancestries Reported - Greek (%)
Ancestries Reported - Hungarian (%)
Ancestries Reported - Irish (%)
Ancestries Reported - Italian (%)
Ancestries Reported - Lithuanian (%)
Ancestries Reported - Norwegian (%)
Ancestries Reported - Polish (%)
Ancestries Reported - Portuguese (%)
Ancestries Reported - Russian (%)
Ancestries Reported - Scotch-Irish (%)
Ancestries Reported - Scottish (%)
Ancestries Reported - Slovak (%)
Ancestries Reported - Subsaharan African (%)
Ancestries Reported - Swedish (%)
Ancestries Reported - Swiss (%)
Ancestries Reported - Ukrainian (%)
Ancestries Reported - United States (%)
Ancestries Reported - Welsh (%)
Ancestries Reported - West Indian (%)
Ancestries Reported - Other (%)
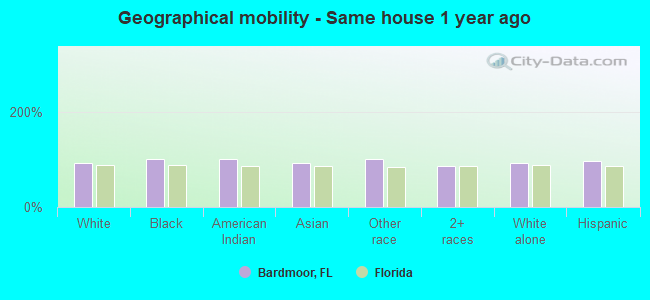
Geographical mobility - Same house 1 year ago (%)
Geographical mobility - Same house 1 year ago (%) - White
Geographical mobility - Same house 1 year ago (%) - Black or African American
Geographical mobility - Same house 1 year ago (%) - Asian
Geographical mobility - Same house 1 year ago (%) - Hispanic or Latino
Geographical mobility - Same house 1 year ago (%) - American Indian and Alaska Native
Geographical mobility - Same house 1 year ago (%) - Multirace
Geographical mobility - Same house 1 year ago (%) - Other Race
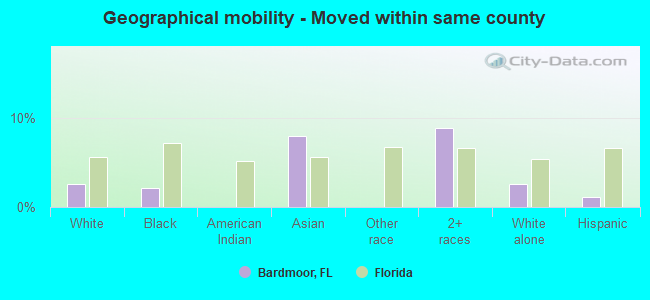
Geographical mobility - Moved within same county (%)
Geographical mobility - Moved within same county (%) - White
Geographical mobility - Moved within same county (%) - Black or African American
Geographical mobility - Moved within same county (%) - Asian
Geographical mobility - Moved within same county (%) - Hispanic or Latino
Geographical mobility - Moved within same county (%) - American Indian and Alaska Native
Geographical mobility - Moved within same county (%) - Multirace
Geographical mobility - Moved within same county (%) - Other Race
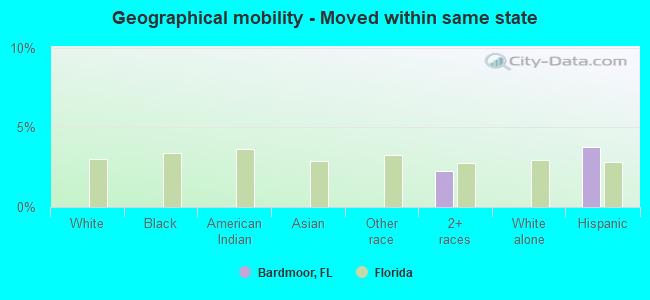
Geographical mobility - Moved from different county within same state (%)
Geographical mobility - Moved from different county within same state (%) - White
Geographical mobility - Moved from different county within same state (%) - Black or African American
Geographical mobility - Moved from different county within same state (%) - Asian
Geographical mobility - Moved from different county within same state (%) - Hispanic or Latino
Geographical mobility - Moved from different county within same state (%) - American Indian and Alaska Native
Geographical mobility - Moved from different county within same state (%) - Multirace
Geographical mobility - Moved from different county within same state (%) - Other Race
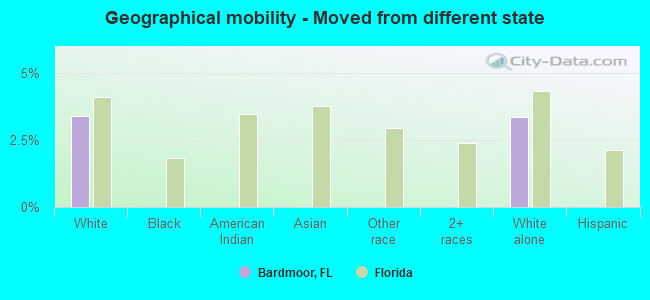
Geographical mobility - Moved from different state (%)
Geographical mobility - Moved from different state (%) - White
Geographical mobility - Moved from different state (%) - Black or African American
Geographical mobility - Moved from different state (%) - Asian
Geographical mobility - Moved from different state (%) - Hispanic or Latino
Geographical mobility - Moved from different state (%) - American Indian and Alaska Native
Geographical mobility - Moved from different state (%) - Multirace
Geographical mobility - Moved from different state (%) - Other Race
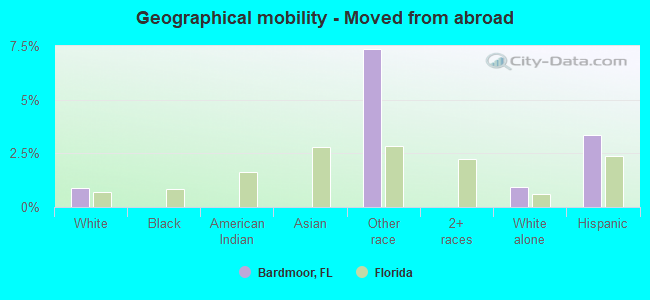
Geographical mobility - Moved from abroad (%)
Geographical mobility - Moved from abroad (%) - White
Geographical mobility - Moved from abroad (%) - Black or African American
Geographical mobility - Moved from abroad (%) - Asian
Geographical mobility - Moved from abroad (%) - Hispanic or Latino
Geographical mobility - Moved from abroad (%) - American Indian and Alaska Native
Geographical mobility - Moved from abroad (%) - Multirace
Geographical mobility - Moved from abroad (%) - Other Race
Place of birth for the foreign-born population - Ireland (%)
Place of birth for the foreign-born population - Denmark (%)
Place of birth for the foreign-born population - Norway (%)
Place of birth for the foreign-born population - Sweden (%)
Place of birth for the foreign-born population - United Kingdom (%)
Place of birth for the foreign-born population - England (%)
Place of birth for the foreign-born population - Scotland (%)
Place of birth for the foreign-born population - Other Northern Europe (%)
Place of birth for the foreign-born population - Austria (%)
Place of birth for the foreign-born population - Belgium (%)
Place of birth for the foreign-born population - France (%)
Place of birth for the foreign-born population - Germany (%)
Place of birth for the foreign-born population - Netherlands (%)
Place of birth for the foreign-born population - Switzerland (%)
Place of birth for the foreign-born population - Other Western Europe (%)
Place of birth for the foreign-born population - Greece (%)
Place of birth for the foreign-born population - Italy (%)
Place of birth for the foreign-born population - Portugal (%)
Place of birth for the foreign-born population - Spain (%)
Place of birth for the foreign-born population - Other Southern Europe (%)
Place of birth for the foreign-born population - Albania (%)
Place of birth for the foreign-born population - Belarus (%)
Place of birth for the foreign-born population - Bosnia and Herzegovina (%)
Place of birth for the foreign-born population - Bulgaria (%)
Place of birth for the foreign-born population - Croatia (%)
Place of birth for the foreign-born population - Czechoslovakia (%)
Place of birth for the foreign-born population - Hungary (%)
Place of birth for the foreign-born population - Latvia (%)
Place of birth for the foreign-born population - Lithuania (%)
Place of birth for the foreign-born population - North Macedonia (Macedonia) (%)
Place of birth for the foreign-born population - Moldova (%)
Place of birth for the foreign-born population - Poland (%)
Place of birth for the foreign-born population - Romania (%)
Place of birth for the foreign-born population - Russia (%)
Place of birth for the foreign-born population - Serbia (%)
Place of birth for the foreign-born population - Ukraine (%)
Place of birth for the foreign-born population - Other Eastern Europe (%)
Place of birth for the foreign-born population - China (%)
Place of birth for the foreign-born population - Hong Kong (%)
Place of birth for the foreign-born population - Taiwan (%)
Place of birth for the foreign-born population - Japan (%)
Place of birth for the foreign-born population - Korea (%)
Place of birth for the foreign-born population - Other Eastern Asia (%)
Place of birth for the foreign-born population - Afghanistan (%)
Place of birth for the foreign-born population - Bangladesh (%)
Place of birth for the foreign-born population - India (%)
Place of birth for the foreign-born population - Iran (%)
Place of birth for the foreign-born population - Kazakhstan (%)
Place of birth for the foreign-born population - Nepal (%)
Place of birth for the foreign-born population - Pakistan (%)
Place of birth for the foreign-born population - Sri Lanka (%)
Place of birth for the foreign-born population - Uzbekistan (%)
Place of birth for the foreign-born population - Other South Central Asia (%)
Place of birth for the foreign-born population - Burma (%)
Place of birth for the foreign-born population - Cambodia (%)
Place of birth for the foreign-born population - Indonesia (%)
Place of birth for the foreign-born population - Laos (%)
Place of birth for the foreign-born population - Malaysia (%)
Place of birth for the foreign-born population - Philippines (%)
Place of birth for the foreign-born population - Singapore (%)
Place of birth for the foreign-born population - Thailand (%)
Place of birth for the foreign-born population - Vietnam (%)
Place of birth for the foreign-born population - Other South Eastern Asia (%)
Place of birth for the foreign-born population - Armenia (%)
Place of birth for the foreign-born population - Iraq (%)
Place of birth for the foreign-born population - Israel (%)
Place of birth for the foreign-born population - Jordan (%)
Place of birth for the foreign-born population - Kuwait (%)
Place of birth for the foreign-born population - Lebanon (%)
Place of birth for the foreign-born population - Saudi Arabia (%)
Place of birth for the foreign-born population - Syria (%)
Place of birth for the foreign-born population - Turkey (%)
Place of birth for the foreign-born population - Yemen (%)
Place of birth for the foreign-born population - Other Western Asia (%)
Place of birth for the foreign-born population - Eritrea (%)
Place of birth for the foreign-born population - Ethiopia (%)
Place of birth for the foreign-born population - Kenya (%)
Place of birth for the foreign-born population - Somalia (%)
Place of birth for the foreign-born population - Uganda (%)
Place of birth for the foreign-born population - Zimbabwe (%)
Place of birth for the foreign-born population - Other Eastern Africa (%)
Place of birth for the foreign-born population - Cameroon (%)
Place of birth for the foreign-born population - Congo (%)
Place of birth for the foreign-born population - Democratic Republic of Congo (Zaire) (%)
Place of birth for the foreign-born population - Other Middle Africa (%)
Place of birth for the foreign-born population - Egypt (%)
Place of birth for the foreign-born population - Morocco (%)
Place of birth for the foreign-born population - Sudan (%)
Place of birth for the foreign-born population - Other Northern Africa (%)
Place of birth for the foreign-born population - South Africa (%)
Place of birth for the foreign-born population - Other Southern Africa (%)
Place of birth for the foreign-born population - Cabo Verde (%)
Place of birth for the foreign-born population - Ghana (%)
Place of birth for the foreign-born population - Liberia (%)
Place of birth for the foreign-born population - Nigeria (%)
Place of birth for the foreign-born population - Senegal (%)
Place of birth for the foreign-born population - Sierra Leone (%)
Place of birth for the foreign-born population - Other Western Africa (%)
Place of birth for the foreign-born population - Australia (%)
Place of birth for the foreign-born population - New Zealand (%)
Place of birth for the foreign-born population - Fiji (%)
Place of birth for the foreign-born population - Micronesia (%)
Place of birth for the foreign-born population - Bahamas (%)
Place of birth for the foreign-born population - Barbados (%)
Place of birth for the foreign-born population - Cuba (%)
Place of birth for the foreign-born population - Dominica (%)
Place of birth for the foreign-born population - Dominican Republic (%)
Place of birth for the foreign-born population - Grenada (%)
Place of birth for the foreign-born population - Haiti (%)
Place of birth for the foreign-born population - Jamaica (%)
Place of birth for the foreign-born population - St. Vincent and the Grenadines (%)
Place of birth for the foreign-born population - Trinidad and Tobago (%)
Place of birth for the foreign-born population - West Indies (%)
Place of birth for the foreign-born population - Other Caribbean (%)
Place of birth for the foreign-born population - Belize (%)
Place of birth for the foreign-born population - Costa Rica (%)
Place of birth for the foreign-born population - El Salvador (%)
Place of birth for the foreign-born population - Guatemala (%)
Place of birth for the foreign-born population - Honduras (%)
Place of birth for the foreign-born population - Mexico (%)
Place of birth for the foreign-born population - Nicaragua (%)
Place of birth for the foreign-born population - Panama (%)
Place of birth for the foreign-born population - Other Central America (%)
Place of birth for the foreign-born population - Argentina (%)
Place of birth for the foreign-born population - Bolivia (%)
Place of birth for the foreign-born population - Brazil (%)
Place of birth for the foreign-born population - Chile (%)
Place of birth for the foreign-born population - Colombia (%)
Place of birth for the foreign-born population - Ecuador (%)
Place of birth for the foreign-born population - Guyana (%)
Place of birth for the foreign-born population - Peru (%)
Place of birth for the foreign-born population - Uruguay (%)
Place of birth for the foreign-born population - Venezuela (%)
Place of birth for the foreign-born population - Other South America (%)
Place of birth for the foreign-born population - Canada (%)
Place of birth for the foreign-born population - Other Northern America (%)
Place of birth for the foreign-born population - Other (%)
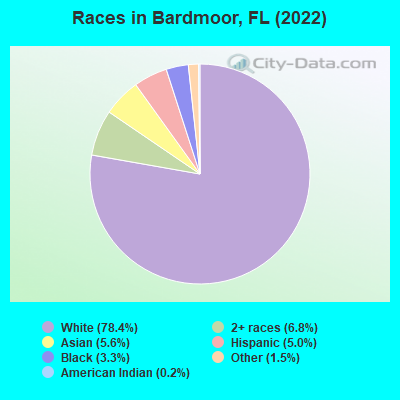
According to 2022 data, the most numerous races in Bardmoor, FL are White alone (7,726 residents), Hispanic (496 residents), and Black alone (321 residents). 89.0% of Bardmoor residents speak English at home.
Race distribution in Bardmoor 7,726 78.4% White alone 670 6.8% Two or more races 552 5.6% Asian alone 496 5.0% Hispanic 321 3.3% Black alone 146 1.5% Other race alone 18 0.2% American Indian alone
2000 2022
10,458,509 65.4% White alone 2,682,715 16.8% Hispanic 2,264,268 14.2% Black alone 261,693 1.6% Asian alone 236,954 1.5% Two or more races 42,358 0.3% American Indian alone 28,994 0.2% Other race alone 6,887 0.04% Native Hawaiian and Other
11,309,403 50.8% White alone 6,025,039 27.1% Hispanic 3,241,015 14.6% Black alone 861,630 3.9% Two or more races 623,692 2.8% Asian alone 152,054 0.7% Other race alone 22,504 0.1% American Indian alone 9,486 0.04% Native Hawaiian and Other
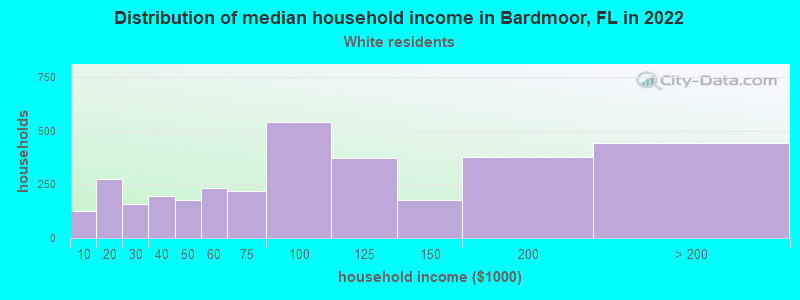
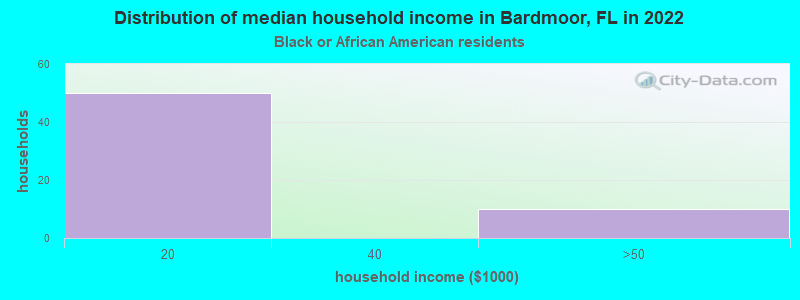
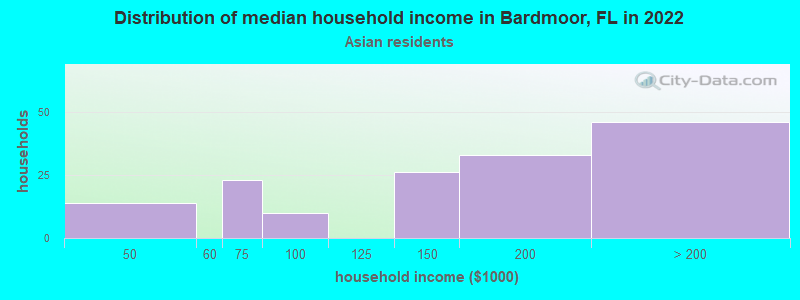
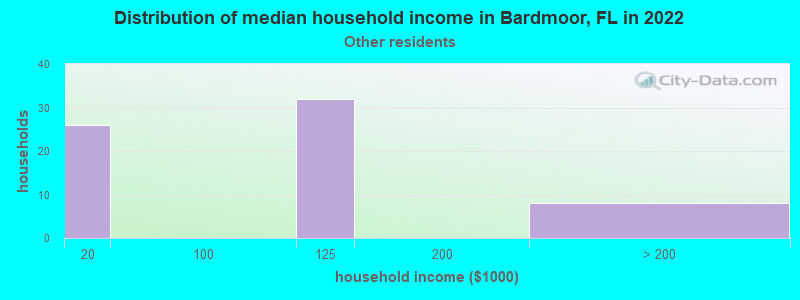
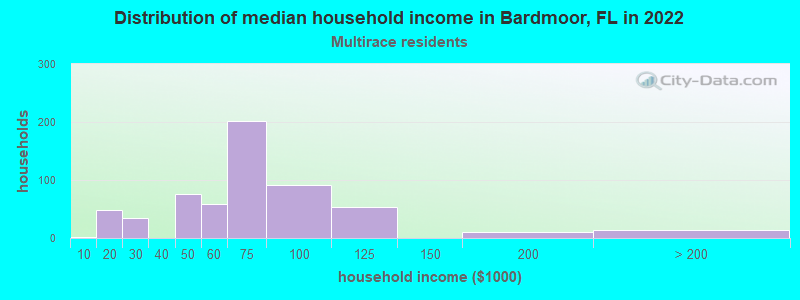
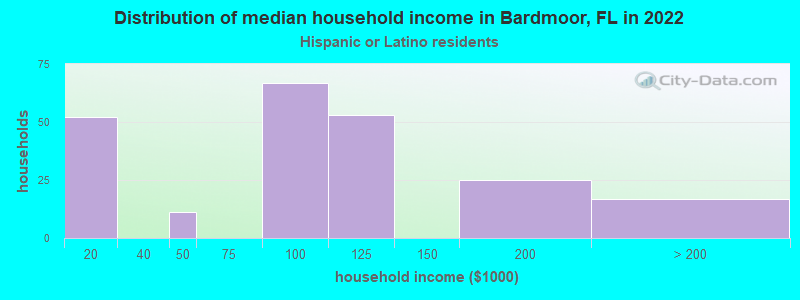
Income and house value in Bardmoor Median household income in 2022 $85,074 White non-Hispanic householders$178,033 Asian householders$61,668 Two or more races householders$91,864 Hispanic or Latino race householders
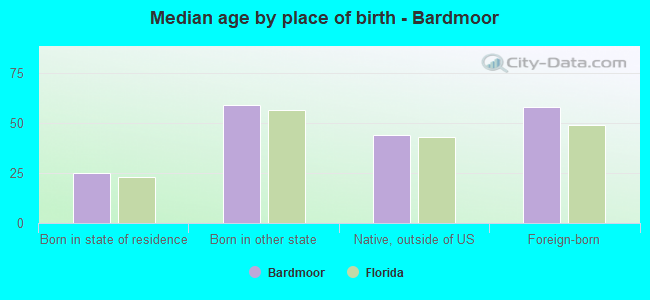
Median age by race in Bardmoor
52.3 Median age for White residents52.3 52.4 12.1 Median age for Black or African American residents39.8 11.5 21.0 Median age for American Indian / Alaska Native residents-535,303,776.1 -323,863,636.0 48.2 Median age for Asian residents62.2 41.8 -556,089,743.0 Median age for Native Hawaiian / Pacific Islander residents-663,446,054.1 -373,522,458.3 10.8 Median age for Other race residents10.0 45.9 39.3 Median age for Two or more races residents38.9 42.7 52.3 Median age for White alone residents52.1 52.5 38.5 Median age for Hispanic or Latino residents36.7 40.7
Owner/renter occupied households by race in Bardmoor
House owners and renters - White residents 3,054 92.9% Owner occupied234 7.1% Renter occupiedHouse owners and renters - Black or African American residents 68 100.0% Renter occupiedHouse owners and renters - American Indian / Alaska Native residents 13 100.0% Owner occupiedHouse owners and renters - Asian residents 135 91.1% Owner occupied13 8.9% Renter occupiedHouse owners and renters - Other race residents 26 45.6% Owner occupied31 54.4% Renter occupiedHouse owners and renters - Two or more races residents 571 92.2% Owner occupied48 7.8% Renter occupiedHouse owners and renters - White alone residents 3,041 92.6% Owner occupied243 7.4% Renter occupiedHouse owners and renters - Hispanic or Latino residents 144 69.1% Owner occupied64 30.9% Renter occupied
Language usage in Bardmoor
English speakers - Total 89.0% of residents of Bardmoor speak English at home.
5.2% of residents speak Spanish at home 173 36.0% Speak English very well307 64.0% Speak English less than very well6.1% of residents speak other language at home 289 51.6% Speak English very well271 48.4% Speak English less than very well
English speakers - Born in the United States 94.7% of residents of Bardmoor speak English at home.
1.5% of residents speak Spanish at home 24 36.9% Speak English very well41 63.1% Speak English less than very well4.1% of residents speak other language at home 100 54.9% Speak English very well82 45.1% Speak English less than very well
English speakers - Native, born elsewhere 73.5% of residents of Bardmoor speak English at home.
25.0% of residents speak Spanish at home 33 100.0% Speak English very well
English speakers - Foreign-born 46.0% of residents of Bardmoor speak English at home.
20.2% of residents speak Spanish at home 64 35.8% Speak English very well115 64.2% Speak English less than very well32.9% of residents speak other language at home 113 38.8% Speak English very well178 61.2% Speak English less than very well
White (Caucasian) - Speak only English Native:
97.7% (6,663)Foreign-born:
78.0% (320)
White (Caucasian) - Speak another language Native:
2.6% (178)Foreign-born:
23.0% (95)
Black or African American - Speak only English Native:
88.9% (230)Foreign-born:
100.0% (11)
Asian - Speak only English Native:
53.4% (153)Foreign-born:
23.6% (59)
Asian - Speak another language Native:
46.6% (134)Foreign-born:
76.5% (192)
Other race - Speak another language Native:
73.4% (126)Foreign-born:
100.0% (32)
Two or more races - Speak another language Native:
8.4% (69)Foreign-born:
99.3% (174)
White alone - Speak only English Native:
98.4% (6,735)Foreign-born:
80.8% (337)
White alone - Speak another language Native:
1.8% (122)Foreign-born:
14.1% (59)
Hispanic or Latino - Speak another language Native:
69.7% (201)Foreign-born:
100.0% (169)
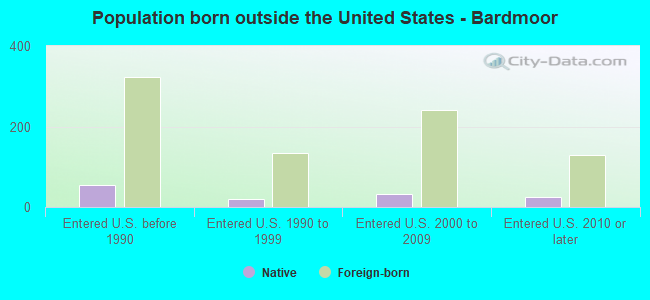
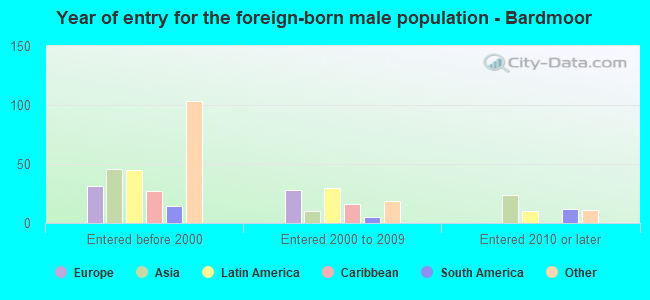
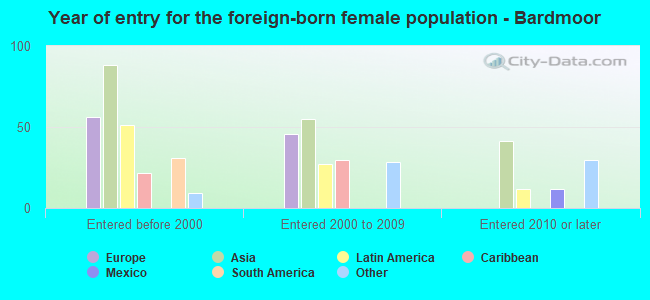
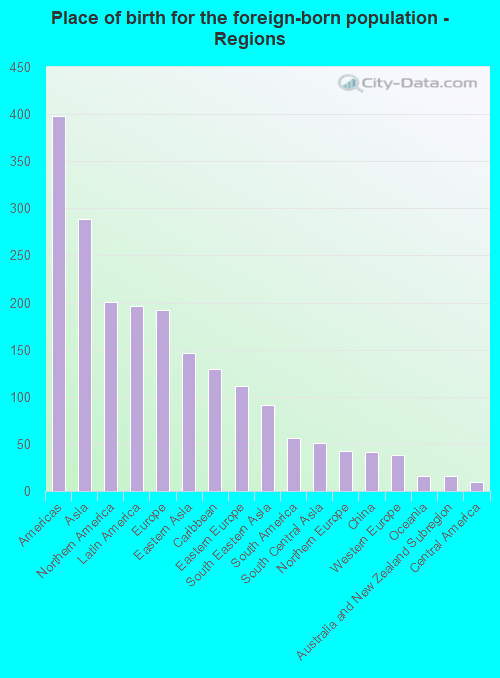
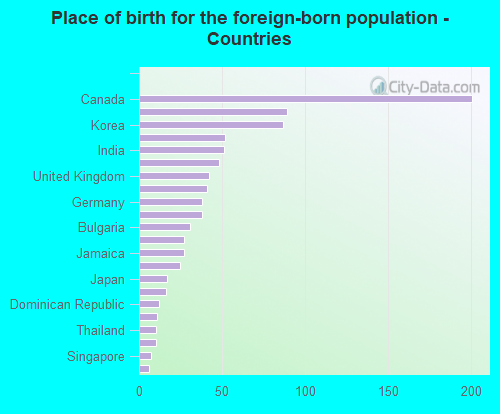
Foreign-born residents in Bardmoor
Marital status for residents in Bardmoor Marital status - White (Caucasian) population 15 years and over
Males 29.5% Never married56.0% Now married0.6% Separated4.0% Widowed9.9% DivorcedFemales 25.2% Never married50.9% Now married1.6% Separated12.3% Widowed10.0% DivorcedWomen who gave birth in the past 12 months Now married:
100.0% (43)Unmarried:
0.0% (0)
Women who did not give birth in the past 12 months Now married:
38.4% (514)Unmarried:
61.6% (825)
Marital status - Black or African American population 15 years and over
Males 10.9% Never married20.7% Now married0.0% Separated0.0% Widowed68.5% DivorcedFemales 0.0% Never married100.0% Now married0.0% Separated0.0% Widowed0.0% DivorcedWomen who gave birth in the past 12 months Now married:
100.0% (19)Unmarried:
0.0% (0)
Marital status - American Indian / Alaska Native population 15 years and over
Males 0.0% Never married100.0% Now married0.0% Separated0.0% Widowed0.0% DivorcedFemales 0.0% Never married100.0% Now married0.0% Separated0.0% Widowed0.0% DivorcedMarital status - Asian population 15 years and over
Males 19.7% Never married80.3% Now married0.0% Separated0.0% Widowed0.0% DivorcedFemales 36.0% Never married42.9% Now married0.0% Separated8.9% Widowed12.2% DivorcedWomen who did not give birth in the past 12 months Now married:
23.8% (43)Unmarried:
76.2% (137)
Marital status - Other race population 15 years and over
Males 25.7% Never married74.3% Now married0.0% Separated0.0% Widowed0.0% DivorcedFemales 0.0% Never married69.4% Now married0.0% Separated0.0% Widowed30.6% DivorcedWomen who did not give birth in the past 12 months Now married:
100.0% (41)Unmarried:
0.0% (0)
Marital status - Two or more races population 15 years and over
Males 64.3% Never married31.8% Now married0.0% Separated0.0% Widowed3.9% DivorcedFemales 31.8% Never married39.1% Now married0.0% Separated1.1% Widowed27.9% DivorcedWomen who gave birth in the past 12 months Now married:
48.9% (32)Unmarried:
51.1% (34)
Women who did not give birth in the past 12 months Now married:
26.1% (34)Unmarried:
73.9% (95)
Marital status - White alone, not Hispanic / Latino population 15 years and over
Males 30.0% Never married55.4% Now married0.7% Separated4.0% Widowed9.9% DivorcedFemales 24.5% Never married51.1% Now married1.7% Separated12.5% Widowed10.2% DivorcedWomen who gave birth in the past 12 months Now married:
100.0% (45)Unmarried:
0.0% (0)
Women who did not give birth in the past 12 months Now married:
38.8% (516)Unmarried:
61.2% (816)
Marital status - Hispanic or Latino population 15 years and over
Males 37.3% Never married59.6% Now married0.0% Separated0.0% Widowed3.1% DivorcedFemales 38.9% Never married45.1% Now married0.0% Separated0.0% Widowed16.1% DivorcedWomen who did not give birth in the past 12 months Now married:
31.2% (51)Unmarried:
68.8% (113)
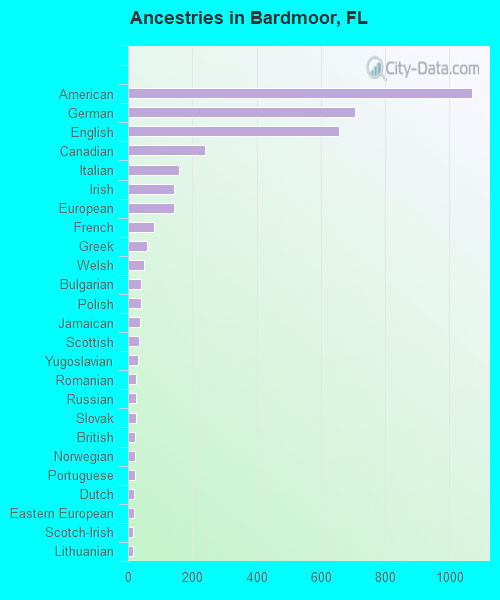
Ancestries in Bardmoor
1,070 22.5% American707 14.8% German657 13.8% English240 5.0% Canadian159 3.3% Italian143 3.0% Irish142 3.0% European82 1.7% French58 1.2% Greek51 1.1% Welsh41 0.9% Bulgarian41 0.9% Polish38 0.8% Jamaican35 0.7% Scottish30 0.6% Yugoslavian26 0.5% Romanian26 0.5% Russian24 0.5% Slovak23 0.5% British22 0.5% Norwegian22 0.5% Portuguese20 0.4% Dutch20 0.4% Eastern European17 0.4% Scotch-Irish16 0.3% Lithuanian14 0.3% Swedish9 0.2% Brazilian8 0.2% Danish7 0.1% Belgian6 0.1% Lebanese6 0.1% Pennsylvania German6 0.1% Slovene4 0.08% Czechoslovakian4 0.08% French Canadian
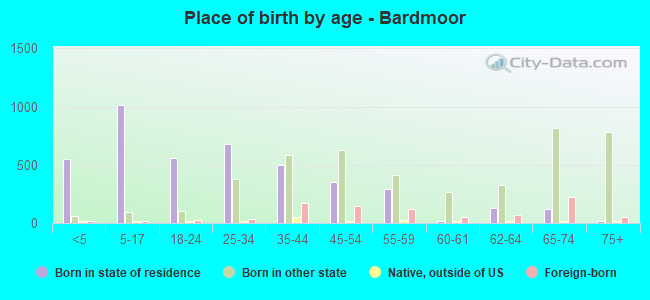
Children Nativity (place of birth) in Bardmoor
Children under 6 years - Living with two parents Both parents native 350 100.0% NativeBoth parents foreign-born 13 100.0% NativeChildren under 6 years - Living with one parent Native parent 113 100.0% NativeForeign-born parent 59 100.0% NativeChildren 6 to 17 years - Living with two parents Both parents native 487 100.0% NativeBoth parents foreign-born 55 100.0% NativeOne native, one foreign-born parent 42 100.0% NativeChildren 6 to 17 years - Living with one parent Native parent 345 100.0% NativeForeign-born parent 18 50.7% Native18 49.3% Foreign-born
Grandparents responsible for own grandchildren in Bardmoor
Grandparents (30 to 59 years) White / Caucasian 41 57.1% Responsible for grandchildren31 42.9% Not responsible for grandchildrenTwo or more races 25 100.0% Not responsible for grandchildrenWhite alone, not Hispanic / Latino 48 60.6% Responsible for grandchildren31 39.4% Not responsible for grandchildrenGrandparents (60 years and over) White / Caucasian 10 9.1% Responsible for grandchildren103 90.9% Not responsible for grandchildrenWhite alone, not Hispanic / Latino 10 8.8% Responsible for grandchildren103 91.2% Not responsible for grandchildren