Races in Barrington, New Hampshire (NH) Detailed Stats
Ancestries, Foreign-born residents, place of birth

Recent posts about races in Barrington, New Hampshire on our local forum with over 2,400,000 registered users:
 | Yet Another Guy Looking to Relocate to Southern NH (27 replies) |
| BBQ review Barrington NH (14 replies) |
| Thinking of moving to New Hampshire from WA (40 replies) |
| Thoughts on the Free State Project (82 replies) |
| MD to...Anywhere in the US (37 replies) |
| Leaving Tahoe for NH, need help with specifics (26 replies) |
Latest news about races in Barrington, NH collected exclusively by city-data.com from local newspapers, TV, and radio stations
1.9% of Barrington, NH residents are foreign-born , which is 163.2% less than the foreign-born rate of 5.0% across the entire state of New Hampshire.
Race distribution in Barrington

- 7,28997.5%White alone
- 690.9%Hispanic
- 530.7%Two or more races
- 310.4%Asian alone
- 180.2%Black alone
- 100.1%American Indian alone
- 50.07%Other race alone
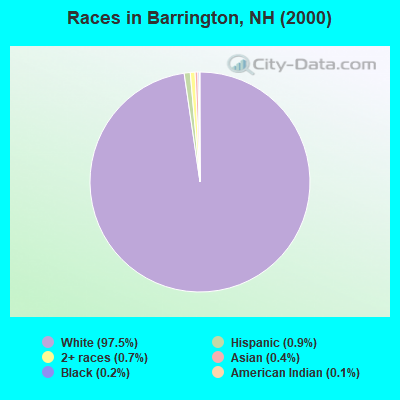
2000
2022
-
- 1,175,25295.1%White alone
- 20,4891.7%Hispanic
- 15,8031.3%Asian alone
- 11,6060.9%Two or more races
- 8,3540.7%Black alone
- 2,6980.2%American Indian alone
- 1,2540.1%Other race alone
- 3300.03%Native Hawaiian and Other
Pacific Islander alone

-
- 1,208,10186.6%White alone
- 63,4794.5%Hispanic
- 60,7244.4%Two or more races
- 36,5192.6%Asian alone
- 17,9311.3%Black alone
- 6,6150.5%Other race alone
- 1,0140.07%American Indian alone
- 8480.06%Native Hawaiian and Other
Pacific Islander alone

Income and house value in Barrington
- Median household income in 2022
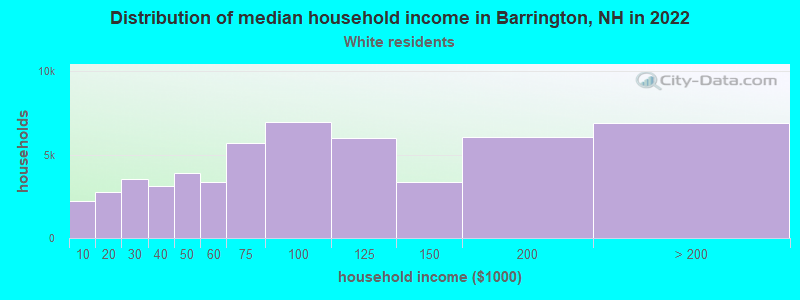
- $94,077White non-Hispanic householders
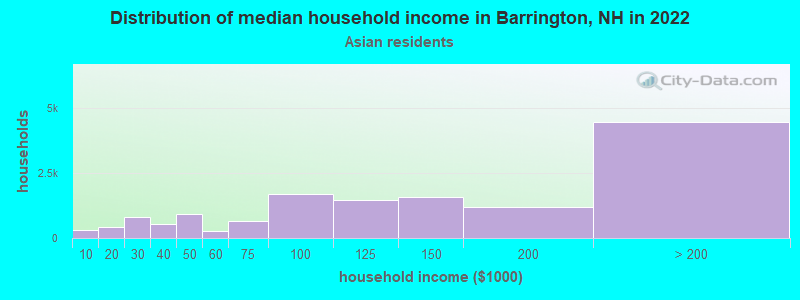
- $137,227Asian householders
- $135,203Some other race householders
- over $200,000Two or more races householders
- $85,559Hispanic or Latino race householders
- Median 2022 house value
- $425,185White Non-Hispanic householders
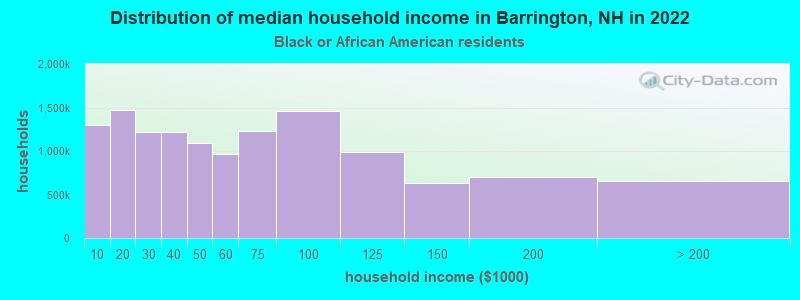
- $263,416Black or African American householders
- $503,590Some other race householders
- $348,639Two or more races householders
- $377,770Hispanic or Latino householders
Household income for White non-Hispanic householders
Household income for Black householders
Household income for Asian householders
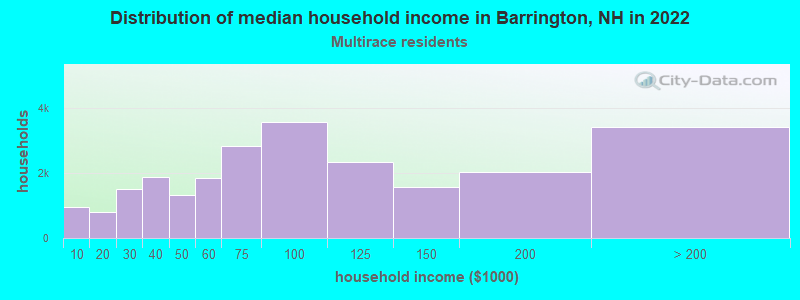
Household income for Two or more races householders
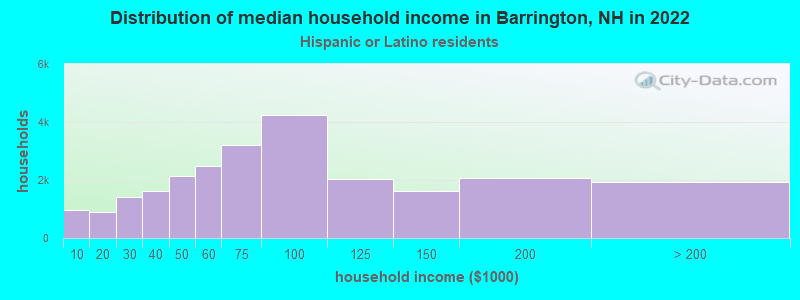
Household income for Hispanic or Latino race householders
Foreign-born residents in Barrington
142 residents are foreign born
| This city: | 1.9% |
| New Hampshire: | 4.4% |
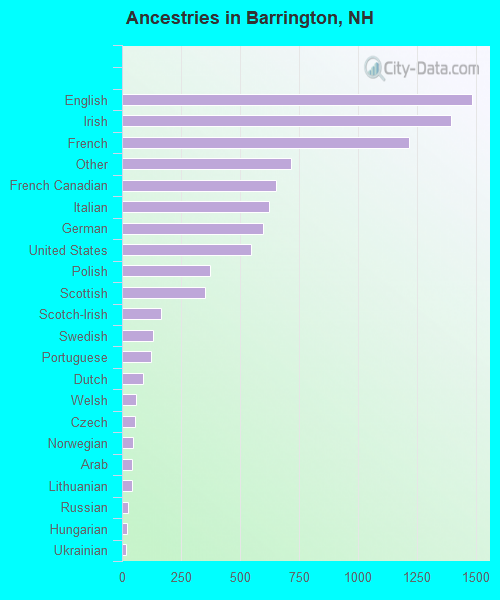
Ancestries in Barrington

- 1,48316.9%English
- 1,39415.8%Irish
- 1,21613.8%French
- 7178.2%Other
- 6547.4%French Canadian
- 6227.1%Italian
- 5986.8%German
- 5486.2%United States
- 3734.2%Polish
- 3544.0%Scottish
- 1671.9%Scotch-Irish
- 1311.5%Swedish
- 1231.4%Portuguese
- 871.0%Dutch
- 610.7%Welsh
- 560.6%Czech
- 480.5%Norwegian
- 440.5%Arab
- 410.5%Lithuanian
- 260.3%Russian
- 230.3%Hungarian
- 150.2%Ukrainian
- 80.09%Danish
- 80.09%Slovak
Zip codes: 03825.