Races in Battle Ground, Washington (WA) Detailed Stats
Data:
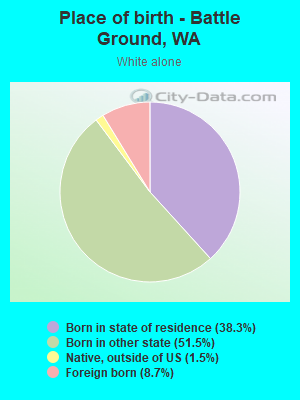
Races - White alone (%)
Races - White alone (% change since 2000)
Races - Black alone (%)
Races - Black alone (% change since 2000)
Races - American Indian alone (%)
Races - American Indian alone (% change since 2000)
Races - Asian alone (%)
Races - Asian alone (% change since 2000)
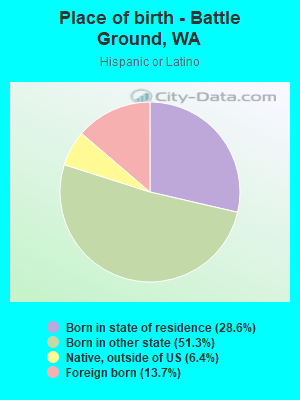
Races - Hispanic (%)
Races - Hispanic (% change since 2000)
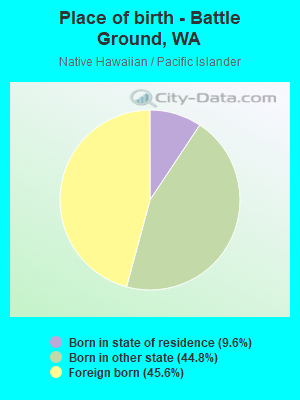
Races - Native Hawaiian and Other Pacific Islander alone (%)
Races - Native Hawaiian and Other Pacific Islander alone (% change since 2000)
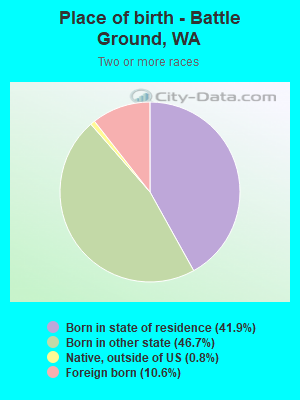
Races - Two or more races(%)
Races - Two or more races(% change since 2000)
Races - Other race alone (%)
Races - Other race alone (% change since 2000)
Racial diversity
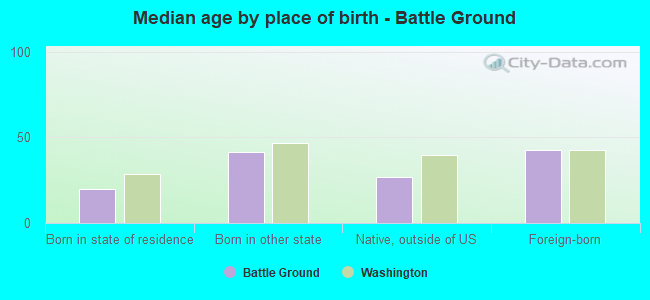
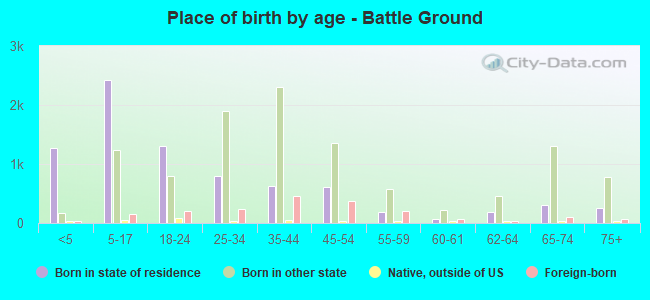
Place of birth - Born in state of residence (%)
Place of birth - Born in state of residence (%) - White
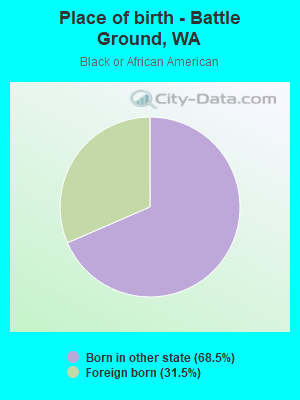
Place of birth - Born in state of residence (%) - Black or African American
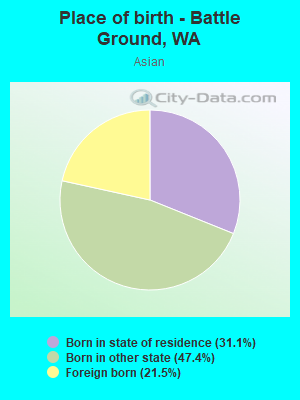
Place of birth - Born in state of residence (%) - Asian
Place of birth - Born in state of residence (%) - Hispanic or Latino
Place of birth - Born in state of residence (%) - American Indian and Alaska Native
Place of birth - Born in state of residence (%) - Multirace
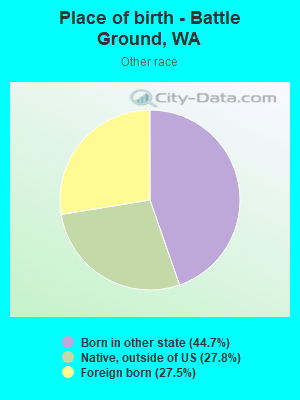
Place of birth - Born in state of residence (%) - Other Race
Place of birth - Born in other state (%)
Place of birth - Born in other state (%) - White
Place of birth - Born in other state (%) - Black or African American
Place of birth - Born in other state (%) - Asian
Place of birth - Born in other state (%) - Hispanic or Latino
Place of birth - Born in other state (%) - American Indian and Alaska Native
Place of birth - Born in other state (%) - Multirace
Place of birth - Born in other state (%) - Other Race
Place of birth - Native, outside of US (%)
Place of birth - Native, outside of US (%) - White
Place of birth - Native, outside of US (%) - Black or African American
Place of birth - Native, outside of US (%) - Asian
Place of birth - Native, outside of US (%) - Hispanic or Latino
Place of birth - Native, outside of US (%) - American Indian and Alaska Native
Place of birth - Native, outside of US (%) - Multirace
Place of birth - Native, outside of US (%) - Other Race
Place of birth - Foreign born (%)
Place of birth - Foreign born (%) - White
Place of birth - Foreign born (%) - Black or African American
Place of birth - Foreign born (%) - Asian
Place of birth - Foreign born (%) - Hispanic or Latino
Place of birth - Foreign born (%) - American Indian and Alaska Native
Place of birth - Foreign born (%) - Multirace
Place of birth - Foreign born (%) - Other Race
Residents speaking English at home (%)
Residents speaking English at home - Born in the United States (%)
Residents speaking English at home - Native, born elsewhere (%)
Residents speaking English at home - Foreign born (%)
Residents speaking Spanish at home (%)
Residents speaking Spanish at home - Born in the United States (%)
Residents speaking Spanish at home - Native, born elsewhere (%)
Residents speaking Spanish at home - Foreign born (%)
Residents speaking other language at home (%)
Residents speaking other language at home - Born in the United States (%)
Residents speaking other language at home - Native, born elsewhere (%)
Residents speaking other language at home - Foreign born (%)
Marital status - Never married (%)
Marital status - Now married (%)
Marital status - Separated (%)
Marital status - Widowed (%)
Marital status - Divorced (%)
Ancestries Reported - Arab (%)
Ancestries Reported - Czech (%)
Ancestries Reported - Danish (%)
Ancestries Reported - Dutch (%)
Ancestries Reported - English (%)
Ancestries Reported - French (%)
Ancestries Reported - French Canadian (%)
Ancestries Reported - German (%)
Ancestries Reported - Greek (%)
Ancestries Reported - Hungarian (%)
Ancestries Reported - Irish (%)
Ancestries Reported - Italian (%)
Ancestries Reported - Lithuanian (%)
Ancestries Reported - Norwegian (%)
Ancestries Reported - Polish (%)
Ancestries Reported - Portuguese (%)
Ancestries Reported - Russian (%)
Ancestries Reported - Scotch-Irish (%)
Ancestries Reported - Scottish (%)
Ancestries Reported - Slovak (%)
Ancestries Reported - Subsaharan African (%)
Ancestries Reported - Swedish (%)
Ancestries Reported - Swiss (%)
Ancestries Reported - Ukrainian (%)
Ancestries Reported - United States (%)
Ancestries Reported - Welsh (%)
Ancestries Reported - West Indian (%)
Ancestries Reported - Other (%)
Geographical mobility - Same house 1 year ago (%)
Geographical mobility - Same house 1 year ago (%) - White
Geographical mobility - Same house 1 year ago (%) - Black or African American
Geographical mobility - Same house 1 year ago (%) - Asian
Geographical mobility - Same house 1 year ago (%) - Hispanic or Latino
Geographical mobility - Same house 1 year ago (%) - American Indian and Alaska Native
Geographical mobility - Same house 1 year ago (%) - Multirace
Geographical mobility - Same house 1 year ago (%) - Other Race
Geographical mobility - Moved within same county (%)
Geographical mobility - Moved within same county (%) - White
Geographical mobility - Moved within same county (%) - Black or African American
Geographical mobility - Moved within same county (%) - Asian
Geographical mobility - Moved within same county (%) - Hispanic or Latino
Geographical mobility - Moved within same county (%) - American Indian and Alaska Native
Geographical mobility - Moved within same county (%) - Multirace
Geographical mobility - Moved within same county (%) - Other Race
Geographical mobility - Moved from different county within same state (%)
Geographical mobility - Moved from different county within same state (%) - White
Geographical mobility - Moved from different county within same state (%) - Black or African American
Geographical mobility - Moved from different county within same state (%) - Asian
Geographical mobility - Moved from different county within same state (%) - Hispanic or Latino
Geographical mobility - Moved from different county within same state (%) - American Indian and Alaska Native
Geographical mobility - Moved from different county within same state (%) - Multirace
Geographical mobility - Moved from different county within same state (%) - Other Race
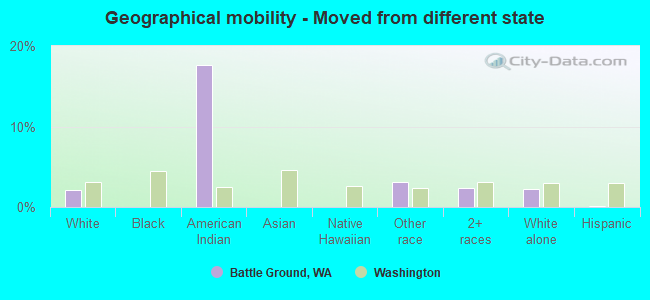
Geographical mobility - Moved from different state (%)
Geographical mobility - Moved from different state (%) - White
Geographical mobility - Moved from different state (%) - Black or African American
Geographical mobility - Moved from different state (%) - Asian
Geographical mobility - Moved from different state (%) - Hispanic or Latino
Geographical mobility - Moved from different state (%) - American Indian and Alaska Native
Geographical mobility - Moved from different state (%) - Multirace
Geographical mobility - Moved from different state (%) - Other Race
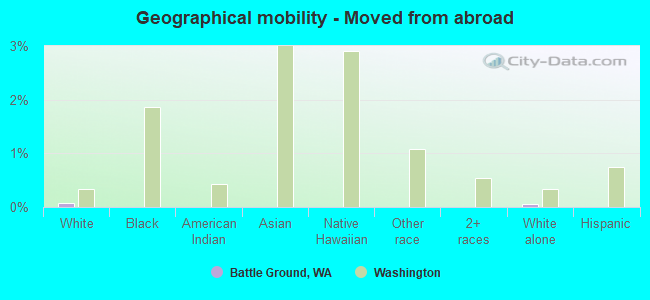
Geographical mobility - Moved from abroad (%)
Geographical mobility - Moved from abroad (%) - White
Geographical mobility - Moved from abroad (%) - Black or African American
Geographical mobility - Moved from abroad (%) - Asian
Geographical mobility - Moved from abroad (%) - Hispanic or Latino
Geographical mobility - Moved from abroad (%) - American Indian and Alaska Native
Geographical mobility - Moved from abroad (%) - Multirace
Geographical mobility - Moved from abroad (%) - Other Race
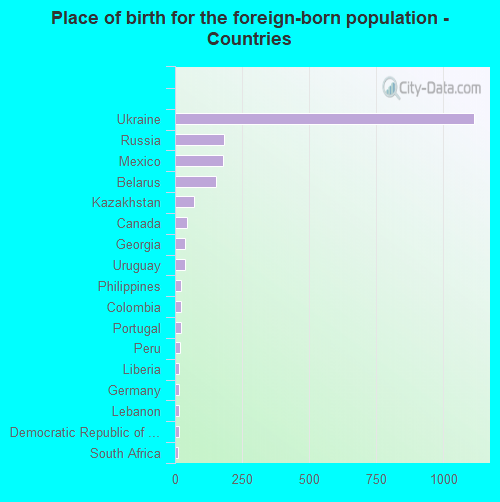
Place of birth for the foreign-born population - Ireland (%)
Place of birth for the foreign-born population - Denmark (%)
Place of birth for the foreign-born population - Norway (%)
Place of birth for the foreign-born population - Sweden (%)
Place of birth for the foreign-born population - United Kingdom (%)
Place of birth for the foreign-born population - England (%)
Place of birth for the foreign-born population - Scotland (%)
Place of birth for the foreign-born population - Other Northern Europe (%)
Place of birth for the foreign-born population - Austria (%)
Place of birth for the foreign-born population - Belgium (%)
Place of birth for the foreign-born population - France (%)
Place of birth for the foreign-born population - Germany (%)
Place of birth for the foreign-born population - Netherlands (%)
Place of birth for the foreign-born population - Switzerland (%)
Place of birth for the foreign-born population - Other Western Europe (%)
Place of birth for the foreign-born population - Greece (%)
Place of birth for the foreign-born population - Italy (%)
Place of birth for the foreign-born population - Portugal (%)
Place of birth for the foreign-born population - Spain (%)
Place of birth for the foreign-born population - Other Southern Europe (%)
Place of birth for the foreign-born population - Albania (%)
Place of birth for the foreign-born population - Belarus (%)
Place of birth for the foreign-born population - Bosnia and Herzegovina (%)
Place of birth for the foreign-born population - Bulgaria (%)
Place of birth for the foreign-born population - Croatia (%)
Place of birth for the foreign-born population - Czechoslovakia (%)
Place of birth for the foreign-born population - Hungary (%)
Place of birth for the foreign-born population - Latvia (%)
Place of birth for the foreign-born population - Lithuania (%)
Place of birth for the foreign-born population - North Macedonia (Macedonia) (%)
Place of birth for the foreign-born population - Moldova (%)
Place of birth for the foreign-born population - Poland (%)
Place of birth for the foreign-born population - Romania (%)
Place of birth for the foreign-born population - Russia (%)
Place of birth for the foreign-born population - Serbia (%)
Place of birth for the foreign-born population - Ukraine (%)
Place of birth for the foreign-born population - Other Eastern Europe (%)
Place of birth for the foreign-born population - China (%)
Place of birth for the foreign-born population - Hong Kong (%)
Place of birth for the foreign-born population - Taiwan (%)
Place of birth for the foreign-born population - Japan (%)
Place of birth for the foreign-born population - Korea (%)
Place of birth for the foreign-born population - Other Eastern Asia (%)
Place of birth for the foreign-born population - Afghanistan (%)
Place of birth for the foreign-born population - Bangladesh (%)
Place of birth for the foreign-born population - India (%)
Place of birth for the foreign-born population - Iran (%)
Place of birth for the foreign-born population - Kazakhstan (%)
Place of birth for the foreign-born population - Nepal (%)
Place of birth for the foreign-born population - Pakistan (%)
Place of birth for the foreign-born population - Sri Lanka (%)
Place of birth for the foreign-born population - Uzbekistan (%)
Place of birth for the foreign-born population - Other South Central Asia (%)
Place of birth for the foreign-born population - Burma (%)
Place of birth for the foreign-born population - Cambodia (%)
Place of birth for the foreign-born population - Indonesia (%)
Place of birth for the foreign-born population - Laos (%)
Place of birth for the foreign-born population - Malaysia (%)
Place of birth for the foreign-born population - Philippines (%)
Place of birth for the foreign-born population - Singapore (%)
Place of birth for the foreign-born population - Thailand (%)
Place of birth for the foreign-born population - Vietnam (%)
Place of birth for the foreign-born population - Other South Eastern Asia (%)
Place of birth for the foreign-born population - Armenia (%)
Place of birth for the foreign-born population - Iraq (%)
Place of birth for the foreign-born population - Israel (%)
Place of birth for the foreign-born population - Jordan (%)
Place of birth for the foreign-born population - Kuwait (%)
Place of birth for the foreign-born population - Lebanon (%)
Place of birth for the foreign-born population - Saudi Arabia (%)
Place of birth for the foreign-born population - Syria (%)
Place of birth for the foreign-born population - Turkey (%)
Place of birth for the foreign-born population - Yemen (%)
Place of birth for the foreign-born population - Other Western Asia (%)
Place of birth for the foreign-born population - Eritrea (%)
Place of birth for the foreign-born population - Ethiopia (%)
Place of birth for the foreign-born population - Kenya (%)
Place of birth for the foreign-born population - Somalia (%)
Place of birth for the foreign-born population - Uganda (%)
Place of birth for the foreign-born population - Zimbabwe (%)
Place of birth for the foreign-born population - Other Eastern Africa (%)
Place of birth for the foreign-born population - Cameroon (%)
Place of birth for the foreign-born population - Congo (%)
Place of birth for the foreign-born population - Democratic Republic of Congo (Zaire) (%)
Place of birth for the foreign-born population - Other Middle Africa (%)
Place of birth for the foreign-born population - Egypt (%)
Place of birth for the foreign-born population - Morocco (%)
Place of birth for the foreign-born population - Sudan (%)
Place of birth for the foreign-born population - Other Northern Africa (%)
Place of birth for the foreign-born population - South Africa (%)
Place of birth for the foreign-born population - Other Southern Africa (%)
Place of birth for the foreign-born population - Cabo Verde (%)
Place of birth for the foreign-born population - Ghana (%)
Place of birth for the foreign-born population - Liberia (%)
Place of birth for the foreign-born population - Nigeria (%)
Place of birth for the foreign-born population - Senegal (%)
Place of birth for the foreign-born population - Sierra Leone (%)
Place of birth for the foreign-born population - Other Western Africa (%)
Place of birth for the foreign-born population - Australia (%)
Place of birth for the foreign-born population - New Zealand (%)
Place of birth for the foreign-born population - Fiji (%)
Place of birth for the foreign-born population - Micronesia (%)
Place of birth for the foreign-born population - Bahamas (%)
Place of birth for the foreign-born population - Barbados (%)
Place of birth for the foreign-born population - Cuba (%)
Place of birth for the foreign-born population - Dominica (%)
Place of birth for the foreign-born population - Dominican Republic (%)
Place of birth for the foreign-born population - Grenada (%)
Place of birth for the foreign-born population - Haiti (%)
Place of birth for the foreign-born population - Jamaica (%)
Place of birth for the foreign-born population - St. Vincent and the Grenadines (%)
Place of birth for the foreign-born population - Trinidad and Tobago (%)
Place of birth for the foreign-born population - West Indies (%)
Place of birth for the foreign-born population - Other Caribbean (%)
Place of birth for the foreign-born population - Belize (%)
Place of birth for the foreign-born population - Costa Rica (%)
Place of birth for the foreign-born population - El Salvador (%)
Place of birth for the foreign-born population - Guatemala (%)
Place of birth for the foreign-born population - Honduras (%)
Place of birth for the foreign-born population - Mexico (%)
Place of birth for the foreign-born population - Nicaragua (%)
Place of birth for the foreign-born population - Panama (%)
Place of birth for the foreign-born population - Other Central America (%)
Place of birth for the foreign-born population - Argentina (%)
Place of birth for the foreign-born population - Bolivia (%)
Place of birth for the foreign-born population - Brazil (%)
Place of birth for the foreign-born population - Chile (%)
Place of birth for the foreign-born population - Colombia (%)
Place of birth for the foreign-born population - Ecuador (%)
Place of birth for the foreign-born population - Guyana (%)
Place of birth for the foreign-born population - Peru (%)
Place of birth for the foreign-born population - Uruguay (%)
Place of birth for the foreign-born population - Venezuela (%)
Place of birth for the foreign-born population - Other South America (%)
Place of birth for the foreign-born population - Canada (%)
Place of birth for the foreign-born population - Other Northern America (%)
Place of birth for the foreign-born population - Other (%)
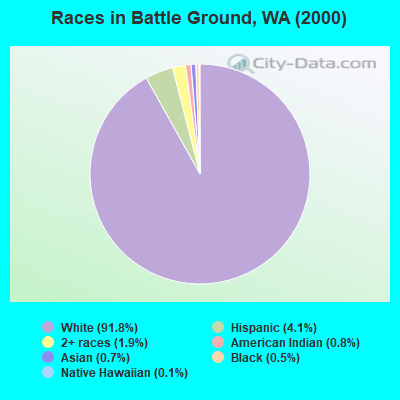
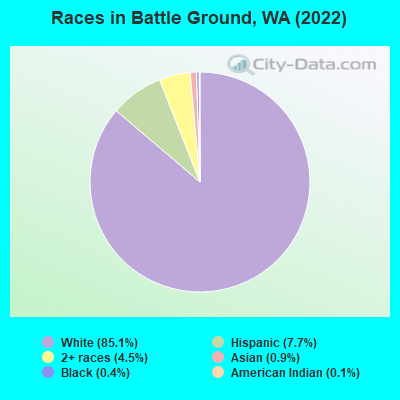
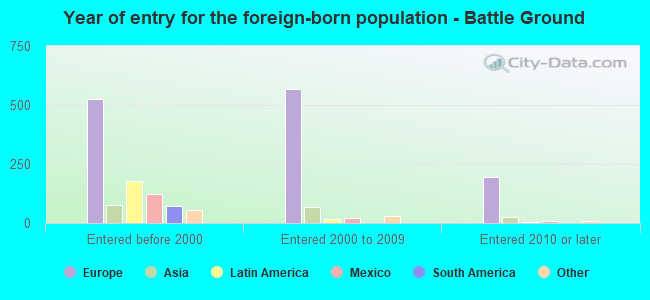
According to 2022 data, the most numerous races in Battle Ground, WA are White alone (18,226 residents), Hispanic (1,642 residents), and Asian alone (200 residents). 86.2% of Battle Ground residents speak English at home. 9.6% of Battle Ground, WA residents are foreign-born (7.0% born in Europe, 1.2% born in Latin America), which is 56.8% less than the foreign-born rate of 15.0% across the entire state of Washington.
Race distribution in Battle Ground
2000 2022
4,652,490 78.9% White alone 441,509 7.5% Hispanic 319,401 5.4% Asian alone 184,631 3.1% Black alone 175,926 3.0% Two or more races 85,396 1.4% American Indian alone 22,779 0.4% Native Hawaiian and Other 11,989 0.2% Other race alone
4,941,456 63.5% White alone 1,093,313 14.0% Hispanic 755,832 9.7% Asian alone 523,448 6.7% Two or more races 299,537 3.8% Black alone 69,024 0.9% American Indian alone 52,231 0.7% Native Hawaiian and Other 50,945 0.7% Other race alone
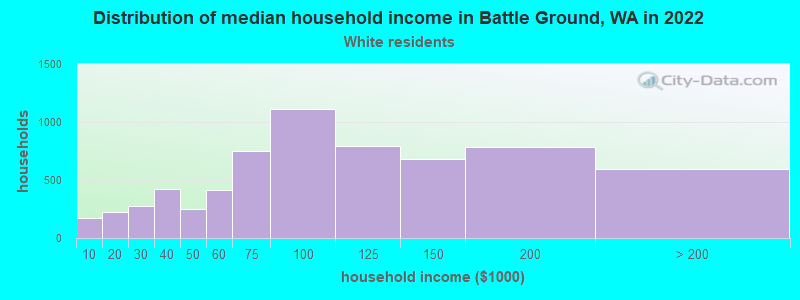
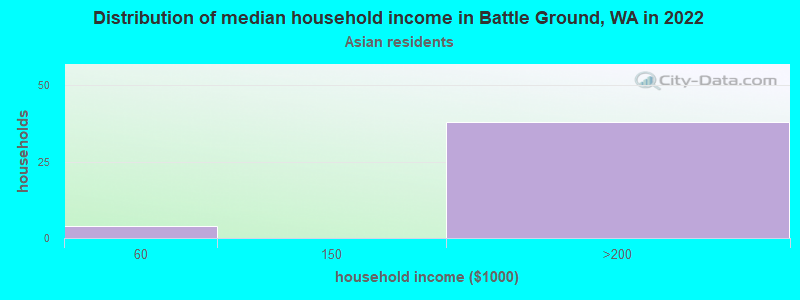
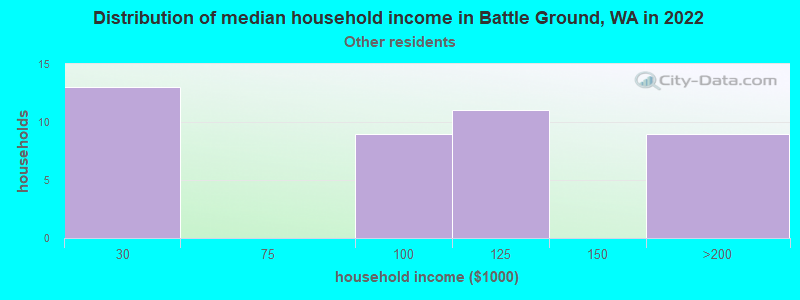
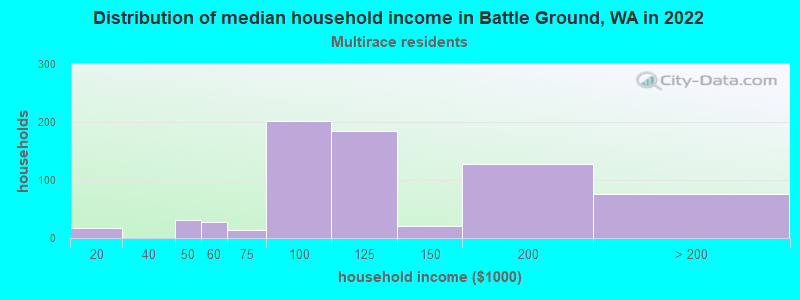
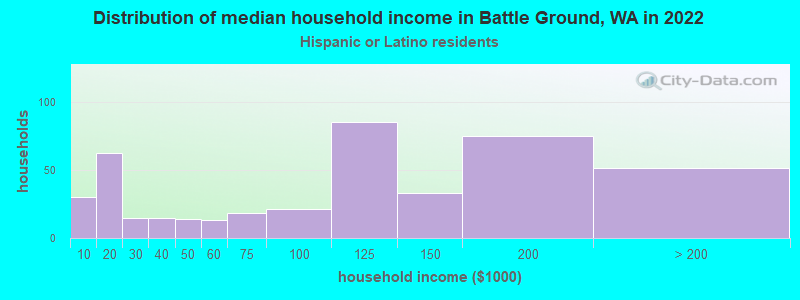
Income and house value in Battle Ground Median household income in 2022 $92,833 White non-Hispanic householders$168,117 Asian householders$126,475 Some other race householders$121,630 Two or more races householders$116,461 Hispanic or Latino race householdersMedian 2022 house value $501,711 White Non-Hispanic householders$505,386 American Indian or Alaska Native householders $614,550 Asian householders$505,386 Some other race householders$413,498 Two or more races householders$476,717 Hispanic or Latino householders
Median age by race in Battle Ground
36.6 Median age for White residents35.5 38.0 21.6 Median age for Black or African American residents-592,216,581.5 -698,955,364.9 54.9 Median age for American Indian / Alaska Native residents55.5 -640,557,005.5 42.8 Median age for Asian residents43.7 46.2 35.7 Median age for Native Hawaiian / Pacific Islander residents-779,310,344.0 42.0 38.5 Median age for Other race residents27.9 39.5 24.9 Median age for Two or more races residents23.3 29.3 36.7 Median age for White alone residents36.2 37.9 23.5 Median age for Hispanic or Latino residents23.3 23.5
Owner/renter occupied households by race in Battle Ground
House owners and renters - White residents 4,904 74.5% Owner occupied1,676 25.5% Renter occupiedHouse owners and renters - Black or African American residents 11 100.0% Owner occupiedHouse owners and renters - American Indian / Alaska Native residents 11 100.0% Owner occupiedHouse owners and renters - Asian residents 21 56.0% Owner occupied16 44.0% Renter occupiedHouse owners and renters - Native Hawaiian / Pacific Islander residents 3 100.0% Owner occupiedHouse owners and renters - Other race residents 31 81.8% Owner occupied7 18.2% Renter occupiedHouse owners and renters - Two or more races residents 550 72.8% Owner occupied206 27.2% Renter occupiedHouse owners and renters - White alone residents 4,906 74.7% Owner occupied1,662 25.3% Renter occupiedHouse owners and renters - Hispanic or Latino residents 195 47.7% Owner occupied214 52.3% Renter occupied
Language usage in Battle Ground
English speakers - Total 86.2% of residents of Battle Ground speak English at home.
3.0% of residents speak Spanish at home 446 73.8% Speak English very well158 26.2% Speak English less than very well10.2% of residents speak other language at home 1,034 51.2% Speak English very well986 48.8% Speak English less than very well
English speakers - Born in the United States 93.9% of residents of Battle Ground speak English at home.
3.1% of residents speak Spanish at home 329 97.3% Speak English very well9 2.7% Speak English less than very well2.4% of residents speak other language at home 246 92.1% Speak English very well21 7.9% Speak English less than very well
English speakers - Native, born elsewhere 87.5% of residents of Battle Ground speak English at home.
3.5% of residents speak Spanish at home 10 100.0% Speak English very well12.2% of residents speak other language at home 8 22.9% Speak English very well27 77.1% Speak English less than very well
English speakers - Foreign-born 8.9% of residents of Battle Ground speak English at home.
12.2% of residents speak Spanish at home 113 49.1% Speak English very well117 50.9% Speak English less than very well74.4% of residents speak other language at home 530 37.8% Speak English very well871 62.2% Speak English less than very well
White (Caucasian) - Speak only English Native:
95.5% (14,803)Foreign-born:
5.8% (83)
White (Caucasian) - Speak another language Native:
4.5% (694)Foreign-born:
89.1% (1,265)
Black or African American - Speak only English Native:
100.0% (49)Foreign-born:
100.0% (31)
Asian - Speak only English Native:
89.9% (138)Foreign-born:
5.7% (3)
Asian - Speak another language Native:
7.6% (12)Foreign-born:
90.9% (40)
Native Hawaiian / Pacific Islander - Speak another language Native:
48.9% (3)Foreign-born:
96.0% (5)
Other race - Speak only English Native:
100.0% (58)Foreign-born:
57.2% (15)
Two or more races - Speak only English Native:
85.9% (1,657)Foreign-born:
4.7% (11)
Two or more races - Speak another language Native:
10.1% (196)Foreign-born:
92.1% (220)
White alone - Speak only English Native:
95.4% (14,683)Foreign-born:
5.6% (87)
White alone - Speak another language Native:
4.7% (727)Foreign-born:
91.3% (1,430)
Hispanic or Latino - Speak only English Native:
76.4% (927)Foreign-born:
13.7% (31)
Hispanic or Latino - Speak another language Native:
22.9% (278)Foreign-born:
89.4% (206)
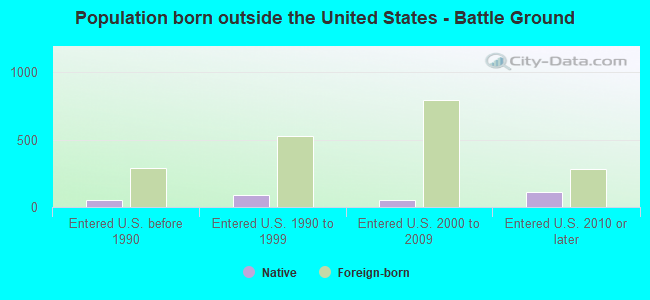
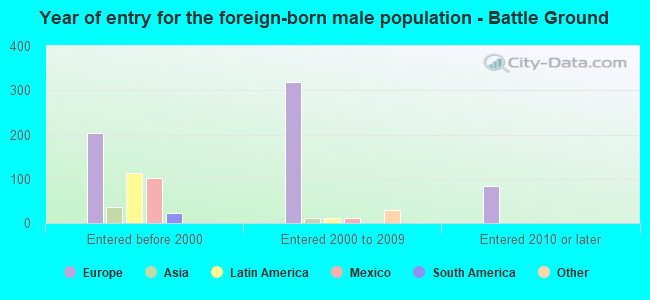
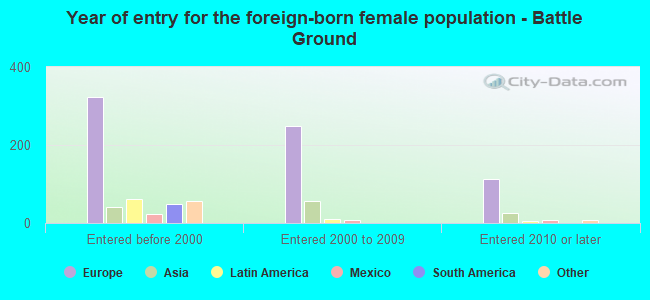
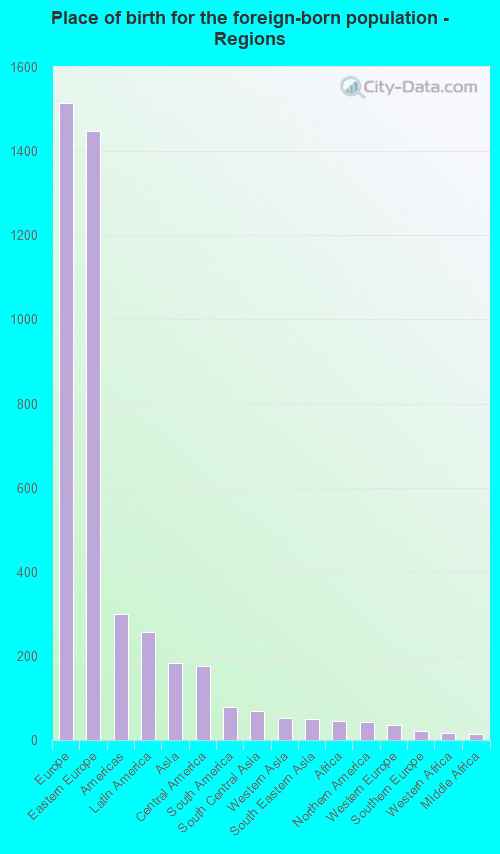
Foreign-born residents in Battle Ground 2,049 residents are foreign born (7.0% Europe , 1.2% Latin America ).
This city:
9.6%Washington:
14.9%
Marital status for residents in Battle Ground Marital status - White (Caucasian) population 15 years and over
Males 31.5% Never married55.6% Now married0.8% Separated2.1% Widowed10.1% DivorcedFemales 24.6% Never married54.7% Now married0.6% Separated7.0% Widowed13.0% DivorcedWomen who gave birth in the past 12 months Now married:
77.2% (233)Unmarried:
22.8% (69)
Women who did not give birth in the past 12 months Now married:
52.7% (2,356)Unmarried:
47.3% (2,117)
Marital status - Black or African American population 15 years and over
Males 100.0% Never married0.0% Now married0.0% Separated0.0% Widowed0.0% DivorcedFemales 68.8% Never married0.0% Now married0.0% Separated0.0% Widowed31.2% DivorcedWomen who did not give birth in the past 12 months Now married:
0.0% (0)Unmarried:
100.0% (48)
Marital status - American Indian / Alaska Native population 15 years and over
Males 31.0% Never married69.0% Now married0.0% Separated0.0% Widowed0.0% DivorcedFemales 53.8% Never married46.2% Now married0.0% Separated0.0% Widowed0.0% DivorcedWomen who did not give birth in the past 12 months Now married:
0.0% (0)Unmarried:
100.0% (8)
Marital status - Asian population 15 years and over
Males 12.1% Never married84.3% Now married0.0% Separated0.0% Widowed3.6% DivorcedFemales 50.0% Never married38.6% Now married0.0% Separated0.0% Widowed11.4% DivorcedWomen who did not give birth in the past 12 months Now married:
35.3% (13)Unmarried:
64.7% (23)
Marital status - Native Hawaiian / Pacific Islander population 15 years and over
Males 0.0% Never married100.0% Now married0.0% Separated0.0% Widowed0.0% DivorcedFemales 37.5% Never married50.0% Now married0.0% Separated0.0% Widowed12.5% DivorcedWomen who did not give birth in the past 12 months Now married:
42.9% (3)Unmarried:
57.1% (4)
Marital status - Other race population 15 years and over
Males 44.4% Never married55.6% Now married0.0% Separated0.0% Widowed0.0% DivorcedFemales 19.6% Never married80.4% Now married0.0% Separated0.0% Widowed0.0% DivorcedWomen who did not give birth in the past 12 months Now married:
68.8% (23)Unmarried:
31.2% (11)
Marital status - Two or more races population 15 years and over
Males 53.8% Never married44.8% Now married0.0% Separated0.0% Widowed1.4% DivorcedFemales 45.1% Never married34.6% Now married0.0% Separated0.0% Widowed20.3% DivorcedWomen who did not give birth in the past 12 months Now married:
23.1% (119)Unmarried:
76.9% (397)
Marital status - White alone, not Hispanic / Latino population 15 years and over
Males 31.3% Never married55.4% Now married0.8% Separated2.2% Widowed10.3% DivorcedFemales 24.6% Never married54.9% Now married0.6% Separated7.2% Widowed12.6% DivorcedWomen who gave birth in the past 12 months Now married:
81.0% (190)Unmarried:
19.0% (44)
Women who did not give birth in the past 12 months Now married:
52.7% (2,387)Unmarried:
47.3% (2,145)
Marital status - Hispanic or Latino population 15 years and over
Males 47.9% Never married52.1% Now married0.0% Separated0.0% Widowed0.0% DivorcedFemales 45.3% Never married38.8% Now married0.0% Separated0.0% Widowed15.9% DivorcedWomen who gave birth in the past 12 months Now married:
65.8% (57)Unmarried:
34.2% (30)
Women who did not give birth in the past 12 months Now married:
27.3% (100)Unmarried:
72.7% (267)
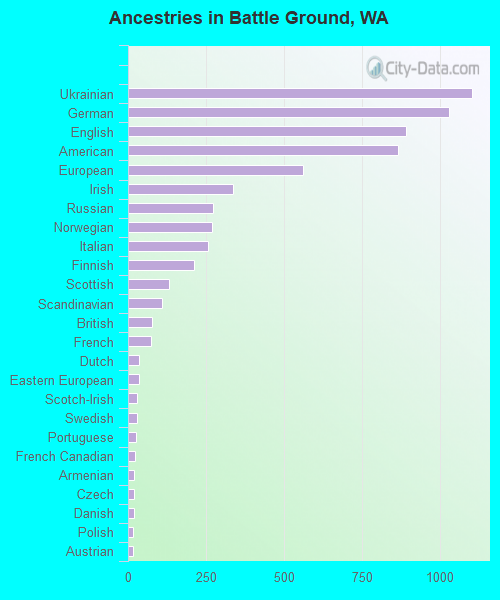
Ancestries in Battle Ground
1,102 13.4% Ukrainian1,030 12.5% German892 10.9% English864 10.5% American560 6.8% European337 4.1% Irish272 3.3% Russian270 3.3% Norwegian256 3.1% Italian213 2.6% Finnish132 1.6% Scottish110 1.3% Scandinavian76 0.9% British73 0.9% French35 0.4% Dutch34 0.4% Eastern European28 0.3% Scotch-Irish28 0.3% Swedish27 0.3% Portuguese22 0.3% French Canadian20 0.2% Armenian19 0.2% Czech18 0.2% Danish16 0.2% Polish15 0.2% Austrian15 0.2% African15 0.2% Swiss12 0.1% Lebanese12 0.1% Croatian9 0.1% Northern European7 0.09% Celtic6 0.07% Lithuanian4 0.05% Hungarian
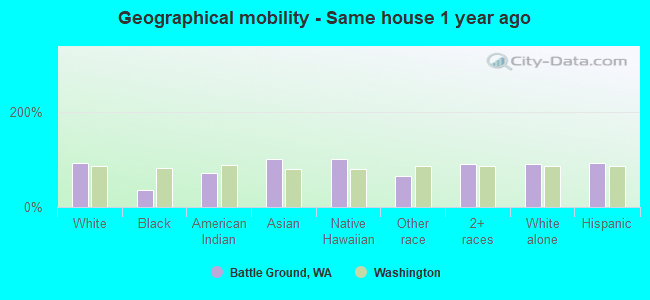
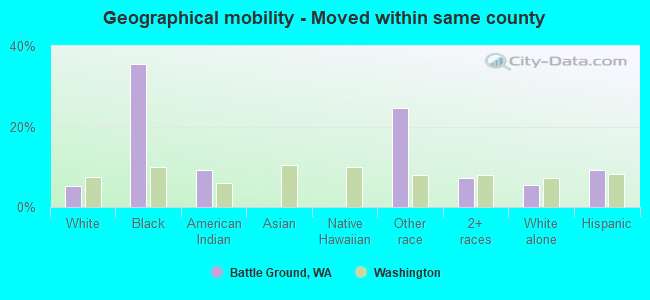
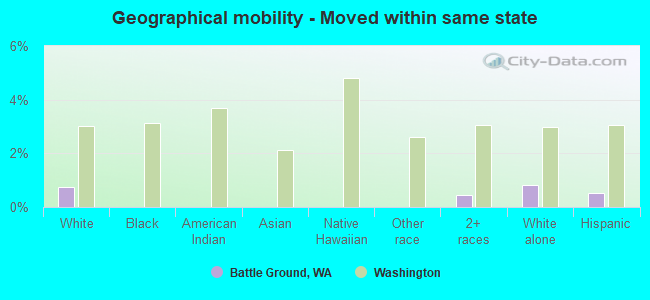
Geographical mobility in Battle Ground Same house 1 year ago 16,672 91.8% White (Caucasian)34 35.6% Black or African American33 72.1% American Indian / Alaska Native202 100.0% Asian12 100.0% Native Hawaiian / Pacific Islander54 64.5% Other race1,996 89.5% Two or more races16,504 91.1% White alone, not Hispanic / Latino1,431 92.7% Hispanic or LatinoMoved within same county 970 5.3% White / Caucasian34 35.5% Black or African American4 9.1% American Indian / Alaska Native21 24.6% Other race160 7.2% Two or more races1,007 5.6% White alone, not Hispanic / Latino141 9.1% Hispanic or LatinoMoved within same state 136 0.8% White / Caucasian10 0.4% Two or more races147 0.8% White alone, not Hispanic / Latino8 0.5% Hispanic or LatinoMoved from different state 372 2.1% White / Caucasian8 17.7% American Indian / Alaska Native3 3.1% Other race53 2.4% Two or more races396 2.2% White alone, not Hispanic / Latino3 0.2% Hispanic or LatinoMoved from abroad 15 0.1% White9 0.1% White alone, not Hispanic / Latino
Children Nativity (place of birth) in Battle Ground
Children under 6 years - Living with two parents Both parents native 1,202 100.0% NativeBoth parents foreign-born 142 85.6% Native24 14.4% Foreign-bornOne native, one foreign-born parent 72 100.0% NativeChildren under 6 years - Living with one parent Native parent 181 100.0% NativeChildren 6 to 17 years - Living with two parents Both parents native 2,335 98.9% Native26 1.1% Foreign-bornBoth parents foreign-born 431 82.8% Native90 17.2% Foreign-bornOne native, one foreign-born parent 148 100.0% NativeChildren 6 to 17 years - Living with one parent Native parent 555 100.0% Native
Grandparents responsible for own grandchildren in Battle Ground
Grandparents (30 to 59 years) White / Caucasian 19 36.8% Responsible for grandchildren32 63.2% Not responsible for grandchildrenNative Hawaiian / Pacific Islander 1 57.4% Not responsible for grandchildrenTwo or more races 21 100.0% Responsible for grandchildrenWhite alone, not Hispanic / Latino 19 33.0% Responsible for grandchildren38 67.0% Not responsible for grandchildrenHispanic or Latino 19 100.0% Responsible for grandchildrenGrandparents (60 years and over) White / Caucasian 55 31.6% Responsible for grandchildren119 68.4% Not responsible for grandchildrenTwo or more races 20 100.0% Responsible for grandchildrenWhite alone, not Hispanic / Latino 58 31.9% Responsible for grandchildren124 68.1% Not responsible for grandchildrenHispanic or Latino 29 100.0% Responsible for grandchildren