Races in Bay City, Texas (TX) Detailed Stats
Data:
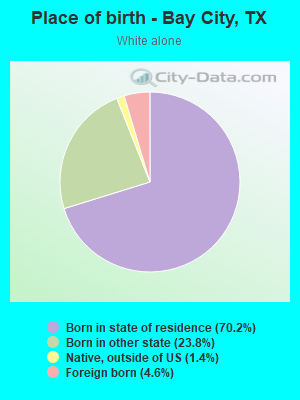
Races - White alone (%)
Races - White alone (% change since 2000)
Races - Black alone (%)
Races - Black alone (% change since 2000)
Races - American Indian alone (%)
Races - American Indian alone (% change since 2000)
Races - Asian alone (%)
Races - Asian alone (% change since 2000)
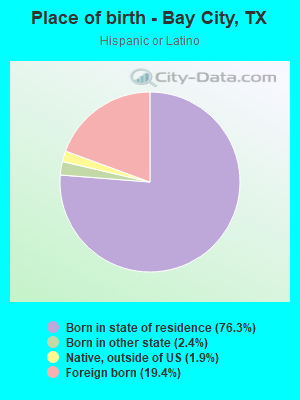
Races - Hispanic (%)
Races - Hispanic (% change since 2000)
Races - Native Hawaiian and Other Pacific Islander alone (%)
Races - Native Hawaiian and Other Pacific Islander alone (% change since 2000)
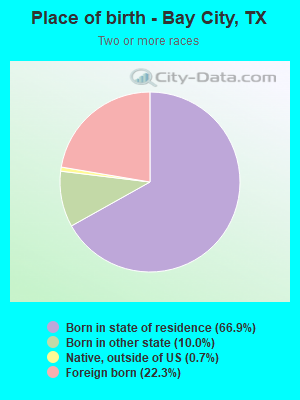
Races - Two or more races(%)
Races - Two or more races(% change since 2000)
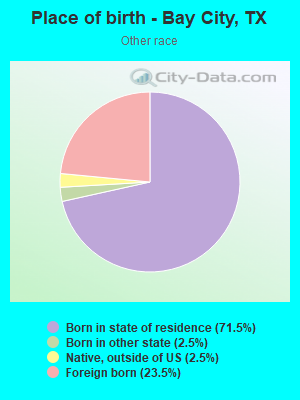
Races - Other race alone (%)
Races - Other race alone (% change since 2000)
Racial diversity
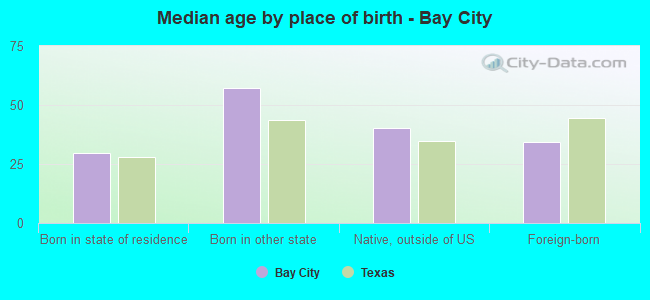
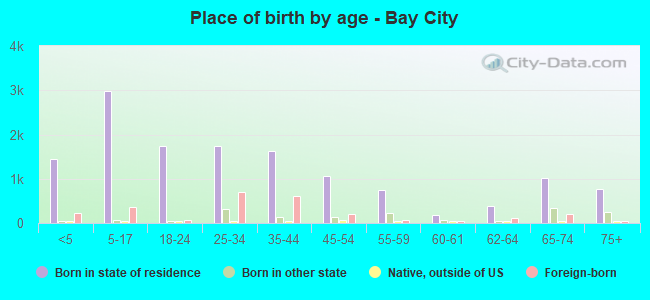
Place of birth - Born in state of residence (%)
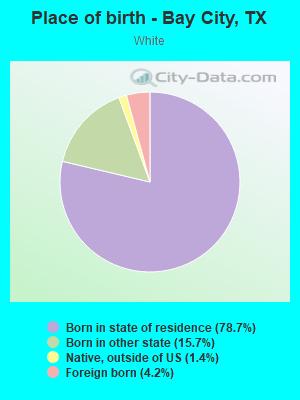
Place of birth - Born in state of residence (%) - White
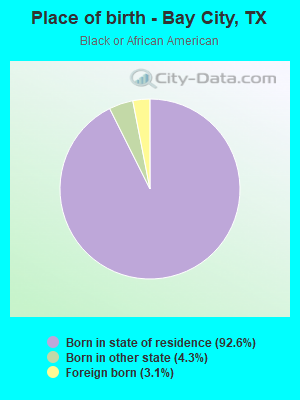
Place of birth - Born in state of residence (%) - Black or African American
Place of birth - Born in state of residence (%) - Asian
Place of birth - Born in state of residence (%) - Hispanic or Latino
Place of birth - Born in state of residence (%) - American Indian and Alaska Native
Place of birth - Born in state of residence (%) - Multirace
Place of birth - Born in state of residence (%) - Other Race
Place of birth - Born in other state (%)
Place of birth - Born in other state (%) - White
Place of birth - Born in other state (%) - Black or African American
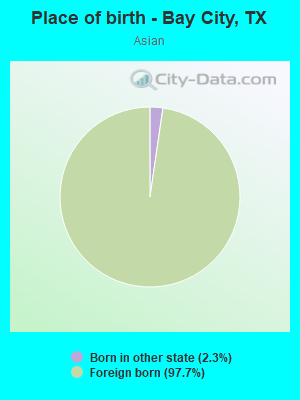
Place of birth - Born in other state (%) - Asian
Place of birth - Born in other state (%) - Hispanic or Latino
Place of birth - Born in other state (%) - American Indian and Alaska Native
Place of birth - Born in other state (%) - Multirace
Place of birth - Born in other state (%) - Other Race
Place of birth - Native, outside of US (%)
Place of birth - Native, outside of US (%) - White
Place of birth - Native, outside of US (%) - Black or African American
Place of birth - Native, outside of US (%) - Asian
Place of birth - Native, outside of US (%) - Hispanic or Latino
Place of birth - Native, outside of US (%) - American Indian and Alaska Native
Place of birth - Native, outside of US (%) - Multirace
Place of birth - Native, outside of US (%) - Other Race
Place of birth - Foreign born (%)
Place of birth - Foreign born (%) - White
Place of birth - Foreign born (%) - Black or African American
Place of birth - Foreign born (%) - Asian
Place of birth - Foreign born (%) - Hispanic or Latino
Place of birth - Foreign born (%) - American Indian and Alaska Native
Place of birth - Foreign born (%) - Multirace
Place of birth - Foreign born (%) - Other Race
Residents speaking English at home (%)
Residents speaking English at home - Born in the United States (%)
Residents speaking English at home - Native, born elsewhere (%)
Residents speaking English at home - Foreign born (%)
Residents speaking Spanish at home (%)
Residents speaking Spanish at home - Born in the United States (%)
Residents speaking Spanish at home - Native, born elsewhere (%)
Residents speaking Spanish at home - Foreign born (%)
Residents speaking other language at home (%)
Residents speaking other language at home - Born in the United States (%)
Residents speaking other language at home - Native, born elsewhere (%)
Residents speaking other language at home - Foreign born (%)
Marital status - Never married (%)
Marital status - Now married (%)
Marital status - Separated (%)
Marital status - Widowed (%)
Marital status - Divorced (%)
Ancestries Reported - Arab (%)
Ancestries Reported - Czech (%)
Ancestries Reported - Danish (%)
Ancestries Reported - Dutch (%)
Ancestries Reported - English (%)
Ancestries Reported - French (%)
Ancestries Reported - French Canadian (%)
Ancestries Reported - German (%)
Ancestries Reported - Greek (%)
Ancestries Reported - Hungarian (%)
Ancestries Reported - Irish (%)
Ancestries Reported - Italian (%)
Ancestries Reported - Lithuanian (%)
Ancestries Reported - Norwegian (%)
Ancestries Reported - Polish (%)
Ancestries Reported - Portuguese (%)
Ancestries Reported - Russian (%)
Ancestries Reported - Scotch-Irish (%)
Ancestries Reported - Scottish (%)
Ancestries Reported - Slovak (%)
Ancestries Reported - Subsaharan African (%)
Ancestries Reported - Swedish (%)
Ancestries Reported - Swiss (%)
Ancestries Reported - Ukrainian (%)
Ancestries Reported - United States (%)
Ancestries Reported - Welsh (%)
Ancestries Reported - West Indian (%)
Ancestries Reported - Other (%)
Geographical mobility - Same house 1 year ago (%)
Geographical mobility - Same house 1 year ago (%) - White
Geographical mobility - Same house 1 year ago (%) - Black or African American
Geographical mobility - Same house 1 year ago (%) - Asian
Geographical mobility - Same house 1 year ago (%) - Hispanic or Latino
Geographical mobility - Same house 1 year ago (%) - American Indian and Alaska Native
Geographical mobility - Same house 1 year ago (%) - Multirace
Geographical mobility - Same house 1 year ago (%) - Other Race
Geographical mobility - Moved within same county (%)
Geographical mobility - Moved within same county (%) - White
Geographical mobility - Moved within same county (%) - Black or African American
Geographical mobility - Moved within same county (%) - Asian
Geographical mobility - Moved within same county (%) - Hispanic or Latino
Geographical mobility - Moved within same county (%) - American Indian and Alaska Native
Geographical mobility - Moved within same county (%) - Multirace
Geographical mobility - Moved within same county (%) - Other Race
Geographical mobility - Moved from different county within same state (%)
Geographical mobility - Moved from different county within same state (%) - White
Geographical mobility - Moved from different county within same state (%) - Black or African American
Geographical mobility - Moved from different county within same state (%) - Asian
Geographical mobility - Moved from different county within same state (%) - Hispanic or Latino
Geographical mobility - Moved from different county within same state (%) - American Indian and Alaska Native
Geographical mobility - Moved from different county within same state (%) - Multirace
Geographical mobility - Moved from different county within same state (%) - Other Race
Geographical mobility - Moved from different state (%)
Geographical mobility - Moved from different state (%) - White
Geographical mobility - Moved from different state (%) - Black or African American
Geographical mobility - Moved from different state (%) - Asian
Geographical mobility - Moved from different state (%) - Hispanic or Latino
Geographical mobility - Moved from different state (%) - American Indian and Alaska Native
Geographical mobility - Moved from different state (%) - Multirace
Geographical mobility - Moved from different state (%) - Other Race
Geographical mobility - Moved from abroad (%)
Geographical mobility - Moved from abroad (%) - White
Geographical mobility - Moved from abroad (%) - Black or African American
Geographical mobility - Moved from abroad (%) - Asian
Geographical mobility - Moved from abroad (%) - Hispanic or Latino
Geographical mobility - Moved from abroad (%) - American Indian and Alaska Native
Geographical mobility - Moved from abroad (%) - Multirace
Geographical mobility - Moved from abroad (%) - Other Race
Place of birth for the foreign-born population - Ireland (%)
Place of birth for the foreign-born population - Denmark (%)
Place of birth for the foreign-born population - Norway (%)
Place of birth for the foreign-born population - Sweden (%)
Place of birth for the foreign-born population - United Kingdom (%)
Place of birth for the foreign-born population - England (%)
Place of birth for the foreign-born population - Scotland (%)
Place of birth for the foreign-born population - Other Northern Europe (%)
Place of birth for the foreign-born population - Austria (%)
Place of birth for the foreign-born population - Belgium (%)
Place of birth for the foreign-born population - France (%)
Place of birth for the foreign-born population - Germany (%)
Place of birth for the foreign-born population - Netherlands (%)
Place of birth for the foreign-born population - Switzerland (%)
Place of birth for the foreign-born population - Other Western Europe (%)
Place of birth for the foreign-born population - Greece (%)
Place of birth for the foreign-born population - Italy (%)
Place of birth for the foreign-born population - Portugal (%)
Place of birth for the foreign-born population - Spain (%)
Place of birth for the foreign-born population - Other Southern Europe (%)
Place of birth for the foreign-born population - Albania (%)
Place of birth for the foreign-born population - Belarus (%)
Place of birth for the foreign-born population - Bosnia and Herzegovina (%)
Place of birth for the foreign-born population - Bulgaria (%)
Place of birth for the foreign-born population - Croatia (%)
Place of birth for the foreign-born population - Czechoslovakia (%)
Place of birth for the foreign-born population - Hungary (%)
Place of birth for the foreign-born population - Latvia (%)
Place of birth for the foreign-born population - Lithuania (%)
Place of birth for the foreign-born population - North Macedonia (Macedonia) (%)
Place of birth for the foreign-born population - Moldova (%)
Place of birth for the foreign-born population - Poland (%)
Place of birth for the foreign-born population - Romania (%)
Place of birth for the foreign-born population - Russia (%)
Place of birth for the foreign-born population - Serbia (%)
Place of birth for the foreign-born population - Ukraine (%)
Place of birth for the foreign-born population - Other Eastern Europe (%)
Place of birth for the foreign-born population - China (%)
Place of birth for the foreign-born population - Hong Kong (%)
Place of birth for the foreign-born population - Taiwan (%)
Place of birth for the foreign-born population - Japan (%)
Place of birth for the foreign-born population - Korea (%)
Place of birth for the foreign-born population - Other Eastern Asia (%)
Place of birth for the foreign-born population - Afghanistan (%)
Place of birth for the foreign-born population - Bangladesh (%)
Place of birth for the foreign-born population - India (%)
Place of birth for the foreign-born population - Iran (%)
Place of birth for the foreign-born population - Kazakhstan (%)
Place of birth for the foreign-born population - Nepal (%)
Place of birth for the foreign-born population - Pakistan (%)
Place of birth for the foreign-born population - Sri Lanka (%)
Place of birth for the foreign-born population - Uzbekistan (%)
Place of birth for the foreign-born population - Other South Central Asia (%)
Place of birth for the foreign-born population - Burma (%)
Place of birth for the foreign-born population - Cambodia (%)
Place of birth for the foreign-born population - Indonesia (%)
Place of birth for the foreign-born population - Laos (%)
Place of birth for the foreign-born population - Malaysia (%)
Place of birth for the foreign-born population - Philippines (%)
Place of birth for the foreign-born population - Singapore (%)
Place of birth for the foreign-born population - Thailand (%)
Place of birth for the foreign-born population - Vietnam (%)
Place of birth for the foreign-born population - Other South Eastern Asia (%)
Place of birth for the foreign-born population - Armenia (%)
Place of birth for the foreign-born population - Iraq (%)
Place of birth for the foreign-born population - Israel (%)
Place of birth for the foreign-born population - Jordan (%)
Place of birth for the foreign-born population - Kuwait (%)
Place of birth for the foreign-born population - Lebanon (%)
Place of birth for the foreign-born population - Saudi Arabia (%)
Place of birth for the foreign-born population - Syria (%)
Place of birth for the foreign-born population - Turkey (%)
Place of birth for the foreign-born population - Yemen (%)
Place of birth for the foreign-born population - Other Western Asia (%)
Place of birth for the foreign-born population - Eritrea (%)
Place of birth for the foreign-born population - Ethiopia (%)
Place of birth for the foreign-born population - Kenya (%)
Place of birth for the foreign-born population - Somalia (%)
Place of birth for the foreign-born population - Uganda (%)
Place of birth for the foreign-born population - Zimbabwe (%)
Place of birth for the foreign-born population - Other Eastern Africa (%)
Place of birth for the foreign-born population - Cameroon (%)
Place of birth for the foreign-born population - Congo (%)
Place of birth for the foreign-born population - Democratic Republic of Congo (Zaire) (%)
Place of birth for the foreign-born population - Other Middle Africa (%)
Place of birth for the foreign-born population - Egypt (%)
Place of birth for the foreign-born population - Morocco (%)
Place of birth for the foreign-born population - Sudan (%)
Place of birth for the foreign-born population - Other Northern Africa (%)
Place of birth for the foreign-born population - South Africa (%)
Place of birth for the foreign-born population - Other Southern Africa (%)
Place of birth for the foreign-born population - Cabo Verde (%)
Place of birth for the foreign-born population - Ghana (%)
Place of birth for the foreign-born population - Liberia (%)
Place of birth for the foreign-born population - Nigeria (%)
Place of birth for the foreign-born population - Senegal (%)
Place of birth for the foreign-born population - Sierra Leone (%)
Place of birth for the foreign-born population - Other Western Africa (%)
Place of birth for the foreign-born population - Australia (%)
Place of birth for the foreign-born population - New Zealand (%)
Place of birth for the foreign-born population - Fiji (%)
Place of birth for the foreign-born population - Micronesia (%)
Place of birth for the foreign-born population - Bahamas (%)
Place of birth for the foreign-born population - Barbados (%)
Place of birth for the foreign-born population - Cuba (%)
Place of birth for the foreign-born population - Dominica (%)
Place of birth for the foreign-born population - Dominican Republic (%)
Place of birth for the foreign-born population - Grenada (%)
Place of birth for the foreign-born population - Haiti (%)
Place of birth for the foreign-born population - Jamaica (%)
Place of birth for the foreign-born population - St. Vincent and the Grenadines (%)
Place of birth for the foreign-born population - Trinidad and Tobago (%)
Place of birth for the foreign-born population - West Indies (%)
Place of birth for the foreign-born population - Other Caribbean (%)
Place of birth for the foreign-born population - Belize (%)
Place of birth for the foreign-born population - Costa Rica (%)
Place of birth for the foreign-born population - El Salvador (%)
Place of birth for the foreign-born population - Guatemala (%)
Place of birth for the foreign-born population - Honduras (%)
Place of birth for the foreign-born population - Mexico (%)
Place of birth for the foreign-born population - Nicaragua (%)
Place of birth for the foreign-born population - Panama (%)
Place of birth for the foreign-born population - Other Central America (%)
Place of birth for the foreign-born population - Argentina (%)
Place of birth for the foreign-born population - Bolivia (%)
Place of birth for the foreign-born population - Brazil (%)
Place of birth for the foreign-born population - Chile (%)
Place of birth for the foreign-born population - Colombia (%)
Place of birth for the foreign-born population - Ecuador (%)
Place of birth for the foreign-born population - Guyana (%)
Place of birth for the foreign-born population - Peru (%)
Place of birth for the foreign-born population - Uruguay (%)
Place of birth for the foreign-born population - Venezuela (%)
Place of birth for the foreign-born population - Other South America (%)
Place of birth for the foreign-born population - Canada (%)
Place of birth for the foreign-born population - Other Northern America (%)
Place of birth for the foreign-born population - Other (%)
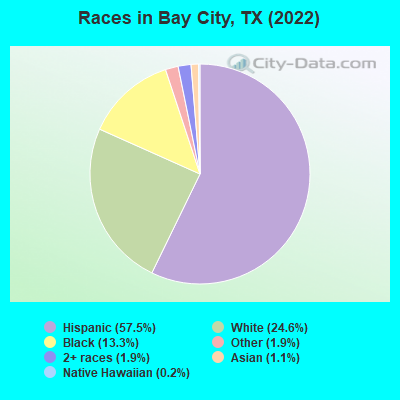
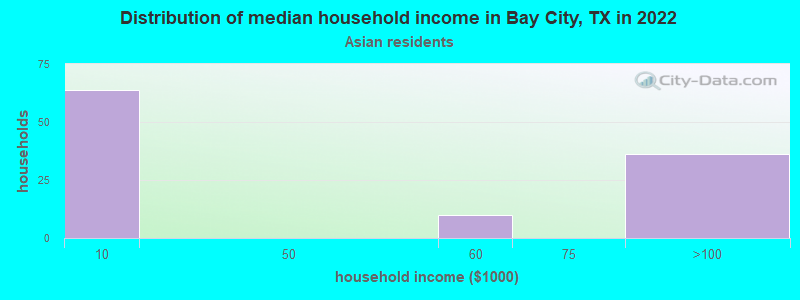
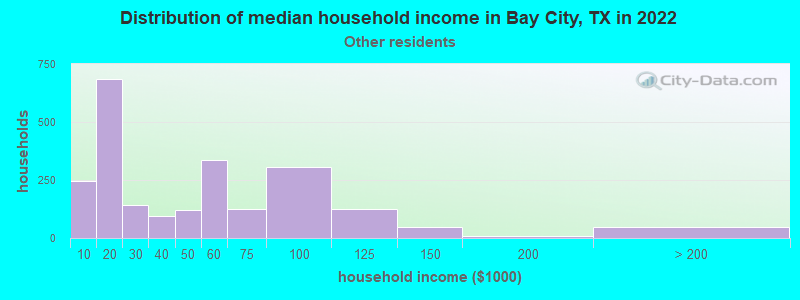
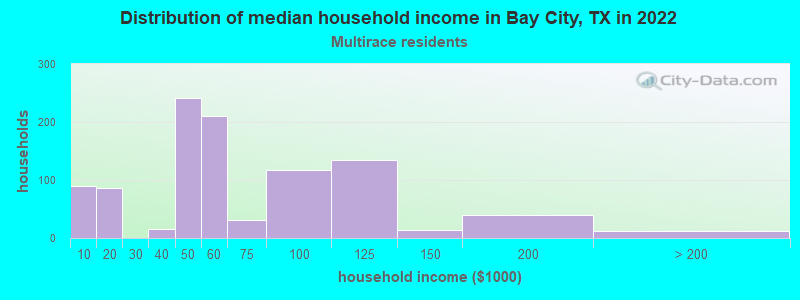
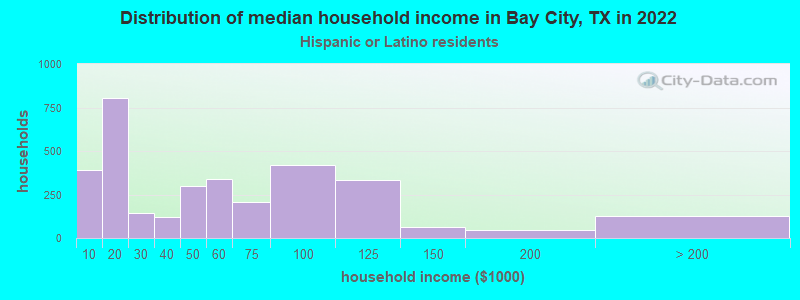
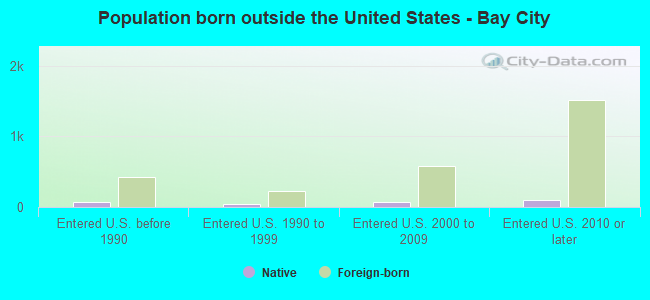
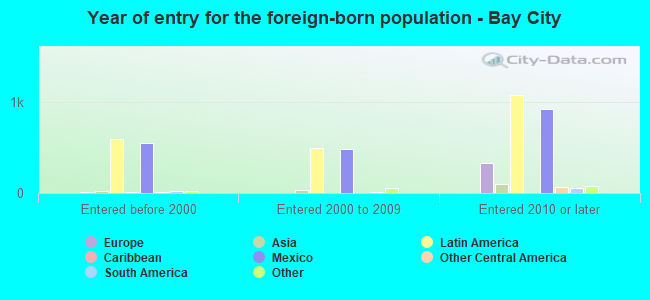
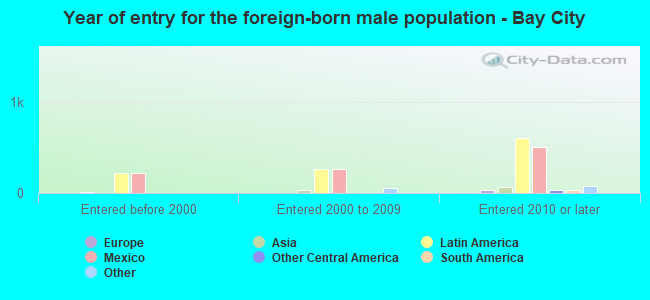
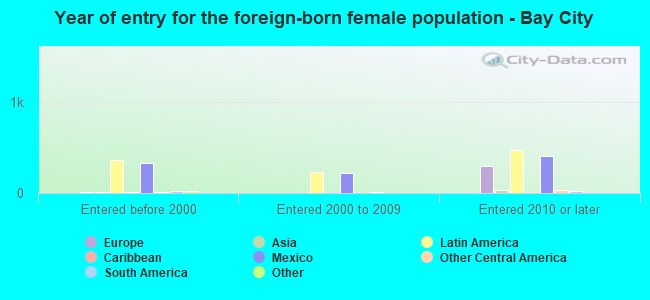
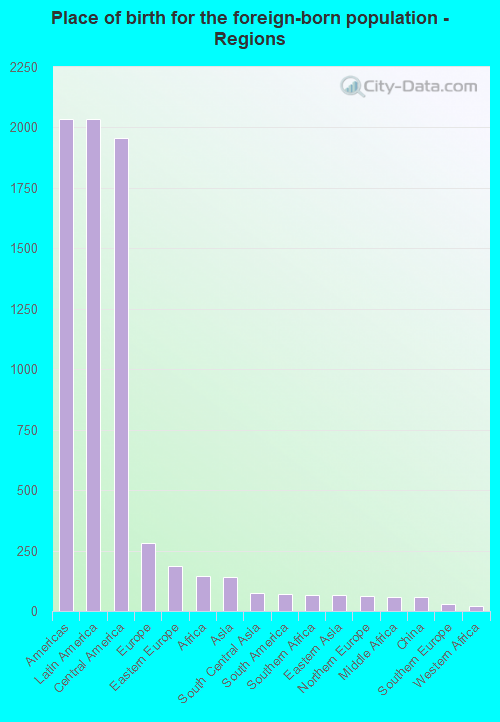
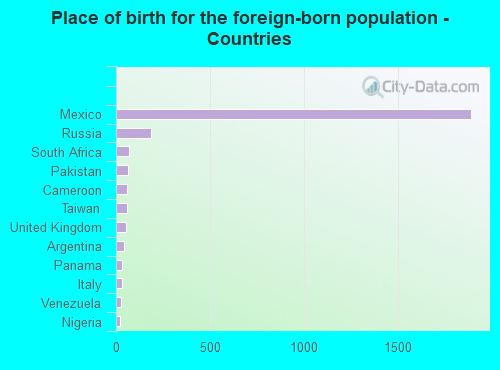
According to 2022 data, the most numerous races in Bay City, TX are Hispanic (10,544 residents), White alone (4,507 residents), and Black alone (2,449 residents). 64.8% of Bay City residents speak English at home. 14.2% of Bay City, TX residents are foreign-born (11.0% born in Latin America, 1.5% born in Europe), which is 19.7% less than the foreign-born rate of 17.0% across the entire state of Texas.
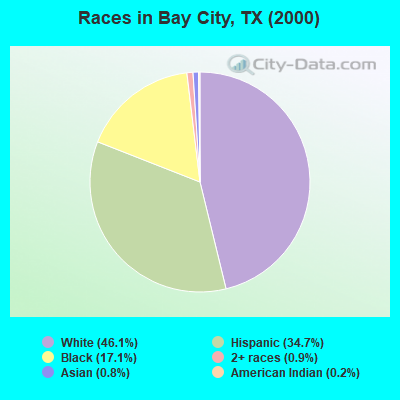
Race distribution in Bay City
2000 2022
10,933,313 52.4% White alone 6,669,666 32.0% Hispanic 2,364,255 11.3% Black alone 554,445 2.7% Asian alone 230,567 1.1% Two or more races 68,859 0.3% American Indian alone 19,958 0.10% Other race alone 10,757 0.05% Native Hawaiian and Other
12,070,642 40.2% Hispanic 11,683,430 38.9% White alone 3,508,706 11.7% Black alone 1,608,173 5.4% Asian alone 956,560 3.2% Two or more races 125,763 0.4% Other race alone 47,023 0.2% American Indian alone 29,275 0.10% Native Hawaiian and Other
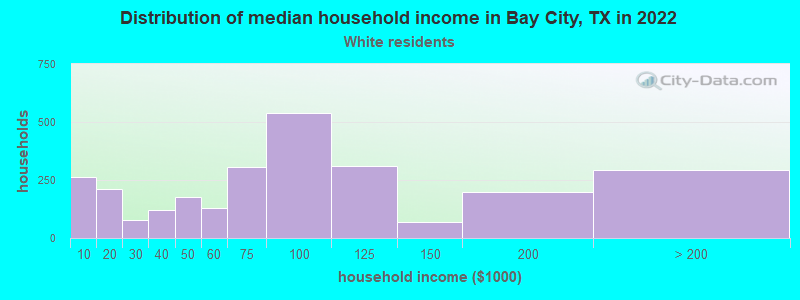
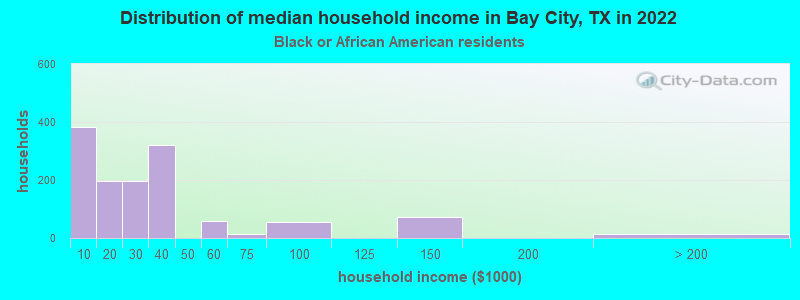
Income and house value in Bay City Median household income in 2022 $74,064 White non-Hispanic householders$28,357 Black householders$33,859 Some other race householders$49,699 Two or more races householders$43,805 Hispanic or Latino race householdersMedian 2022 house value $176,269 White Non-Hispanic householders$100,365 Black or African American householders$259,990 American Indian or Alaska Native householders $138,695 Asian householders$109,191 Some other race householders$89,773 Two or more races householders$115,999 Hispanic or Latino householders
Median age by race in Bay City
34.4 Median age for White residents34.2 36.9 34.0 Median age for Black or African American residents33.4 35.7 -684,418,145.3 Median age for American Indian / Alaska Native residents-682,445,758.7 -684,418,145.3 28.4 Median age for Asian residents28.5 11.2 -581,560,283.1 Median age for Native Hawaiian / Pacific Islander residents-612,729,233.5 -577,777,777.2 32.8 Median age for Other race residents33.4 32.1 30.1 Median age for Two or more races residents30.8 22.6 45.4 Median age for White alone residents45.6 44.1 28.9 Median age for Hispanic or Latino residents30.2 27.5
Owner/renter occupied households by race in Bay City
House owners and renters - White residents 1,715 64.2% Owner occupied958 35.8% Renter occupiedHouse owners and renters - Black or African American residents 288 22.2% Owner occupied1,009 77.8% Renter occupiedHouse owners and renters - American Indian / Alaska Native residents 18 100.0% Renter occupiedHouse owners and renters - Asian residents 5 4.4% Owner occupied101 95.6% Renter occupiedHouse owners and renters - Other race residents 1,378 58.0% Owner occupied996 42.0% Renter occupiedHouse owners and renters - Two or more races residents 752 77.9% Owner occupied214 22.1% Renter occupiedHouse owners and renters - White alone residents 1,478 69.3% Owner occupied656 30.7% Renter occupiedHouse owners and renters - Hispanic or Latino residents 1,928 58.0% Owner occupied1,397 42.0% Renter occupied
Language usage in Bay City
English speakers - Total 64.8% of residents of Bay City speak English at home.
33.3% of residents speak Spanish at home 4,077 73.9% Speak English very well1,443 26.1% Speak English less than very well1.7% of residents speak other language at home 194 69.5% Speak English very well85 30.5% Speak English less than very well
English speakers - Born in the United States 88.1% of residents of Bay City speak English at home.
11.6% of residents speak Spanish at home 125 67.9% Speak English very well59 32.1% Speak English less than very well
English speakers - Native, born elsewhere 47.4% of residents of Bay City speak English at home.
47.0% of residents speak Spanish at home 77 65.8% Speak English very well40 34.2% Speak English less than very well3.6% of residents speak other language at home 9 100.0% Speak English very well
English speakers - Foreign-born 14.2% of residents of Bay City speak English at home.
74.5% of residents speak Spanish at home 735 41.5% Speak English very well1,037 58.5% Speak English less than very well10.8% of residents speak other language at home 172 67.2% Speak English very well84 32.8% Speak English less than very well
White (Caucasian) - Speak only English Native:
82.1% (4,946)Foreign-born:
6.3% (12)
White (Caucasian) - Speak another language Native:
14.4% (867)Foreign-born:
85.2% (166)
Black or African American - Speak only English Native:
97.4% (2,085)Foreign-born:
67.7% (51)
Black or African American - Speak another language Native:
2.6% (55)Foreign-born:
26.6% (20)
Asian - Speak only English Native:
100.0% (5)Foreign-born:
32.2% (64)
Other race - Speak only English Native:
59.6% (2,631)Foreign-born:
17.4% (249)
Other race - Speak another language Native:
42.0% (1,857)Foreign-born:
83.5% (1,192)
Two or more races - Speak only English Native:
60.0% (1,459)Foreign-born:
3.8% (31)
Two or more races - Speak another language Native:
38.2% (928)Foreign-born:
96.3% (789)
White alone - Speak only English Native:
98.5% (4,069)Foreign-born:
17.2% (6)
White alone - Speak another language Native:
1.6% (65)Foreign-born:
82.7% (28)
Hispanic or Latino - Speak only English Native:
51.5% (3,874)Foreign-born:
11.5% (228)
Hispanic or Latino - Speak another language Native:
48.8% (3,667)Foreign-born:
89.0% (1,775)
Foreign-born residents in Bay City 2,606 residents are foreign born (11.0% Latin America , 1.5% Europe ).
This city:
14.2%Texas:
17.1%
Marital status for residents in Bay City Marital status - White (Caucasian) population 15 years and over
Males 35.2% Never married50.9% Now married1.4% Separated5.6% Widowed6.8% DivorcedFemales 25.5% Never married48.5% Now married3.5% Separated8.8% Widowed13.7% DivorcedWomen who gave birth in the past 12 months Now married:
66.9% (86)Unmarried:
33.1% (43)
Women who did not give birth in the past 12 months Now married:
46.6% (615)Unmarried:
53.4% (704)
Marital status - Black or African American population 15 years and over
Males 50.5% Never married35.4% Now married0.0% Separated8.8% Widowed5.4% DivorcedFemales 43.7% Never married14.4% Now married0.9% Separated8.9% Widowed32.1% DivorcedWomen who gave birth in the past 12 months Now married:
0.0% (0)Unmarried:
100.0% (19)
Women who did not give birth in the past 12 months Now married:
23.1% (151)Unmarried:
76.9% (502)
Marital status - Asian population 15 years and over
Males 59.8% Never married40.2% Now married0.0% Separated0.0% Widowed0.0% DivorcedFemales 0.0% Never married91.7% Now married0.0% Separated8.3% Widowed0.0% DivorcedWomen who did not give birth in the past 12 months Now married:
100.0% (33)Unmarried:
0.0% (0)
Marital status - Other race population 15 years and over
Males 35.3% Never married55.2% Now married2.5% Separated3.1% Widowed4.0% DivorcedFemales 30.1% Never married57.5% Now married0.6% Separated5.2% Widowed6.6% DivorcedWomen who gave birth in the past 12 months Now married:
0.0% (0)Unmarried:
100.0% (51)
Women who did not give birth in the past 12 months Now married:
52.8% (894)Unmarried:
47.2% (799)
Marital status - Two or more races population 15 years and over
Males 43.6% Never married44.4% Now married0.0% Separated0.0% Widowed12.0% DivorcedFemales 37.3% Never married56.0% Now married0.2% Separated3.4% Widowed3.2% DivorcedWomen who gave birth in the past 12 months Now married:
26.5% (15)Unmarried:
73.5% (41)
Women who did not give birth in the past 12 months Now married:
57.5% (380)Unmarried:
42.5% (280)
Marital status - White alone, not Hispanic / Latino population 15 years and over
Males 31.3% Never married53.0% Now married0.5% Separated8.2% Widowed6.9% DivorcedFemales 22.3% Never married51.4% Now married1.5% Separated9.5% Widowed15.3% DivorcedWomen who gave birth in the past 12 months Now married:
75.4% (106)Unmarried:
24.6% (35)
Women who did not give birth in the past 12 months Now married:
41.3% (309)Unmarried:
58.7% (439)
Marital status - Hispanic or Latino population 15 years and over
Males 40.1% Never married48.8% Now married2.1% Separated1.8% Widowed7.2% DivorcedFemales 30.0% Never married53.4% Now married2.7% Separated5.8% Widowed8.0% DivorcedWomen who gave birth in the past 12 months Now married:
10.1% (9)Unmarried:
89.9% (83)
Women who did not give birth in the past 12 months Now married:
55.4% (1,400)Unmarried:
44.6% (1,126)
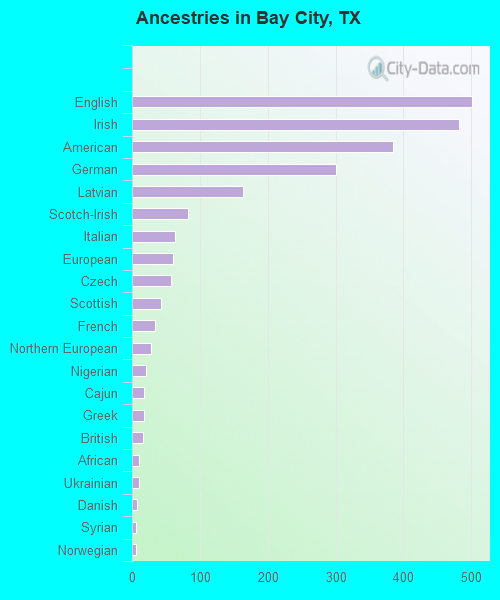
Ancestries in Bay City
501 4.1% English482 3.9% Irish385 3.1% American300 2.4% German164 1.3% Latvian83 0.7% Scotch-Irish64 0.5% Italian60 0.5% European57 0.5% Czech42 0.3% Scottish34 0.3% French28 0.2% Northern European20 0.2% Nigerian18 0.1% Cajun17 0.1% Greek16 0.1% British10 0.08% African10 0.08% Ukrainian8 0.07% Danish6 0.05% Syrian6 0.05% Norwegian3 0.02% Polish3 0.02% Swedish
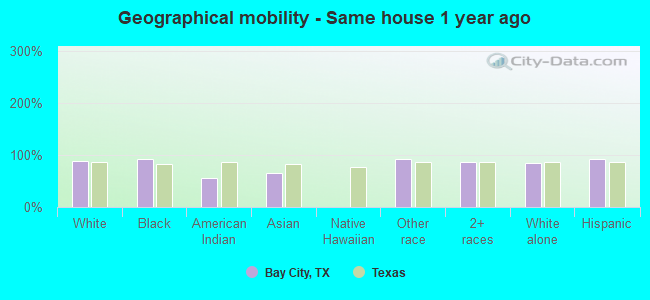
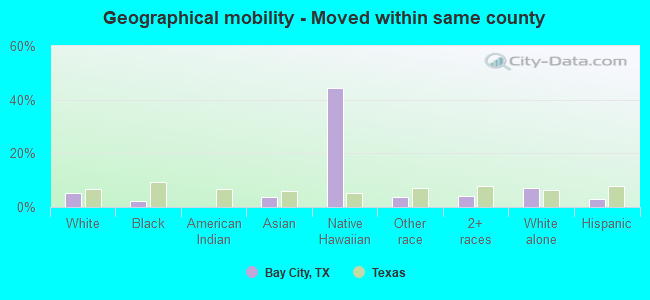
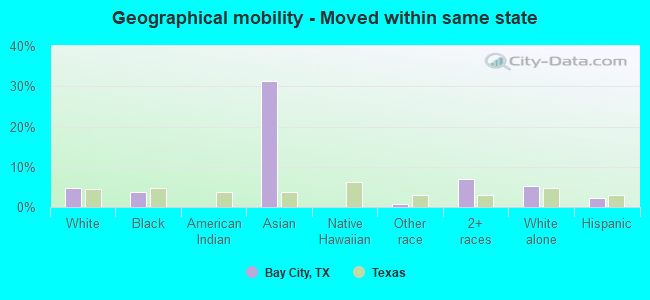
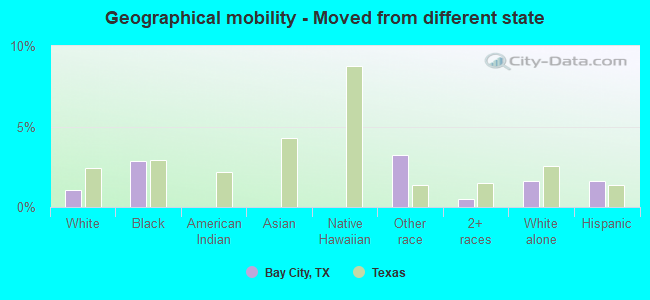
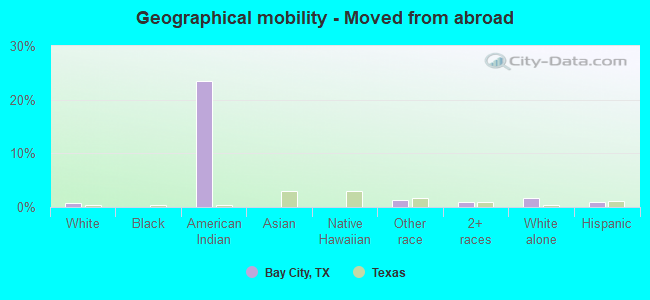
Geographical mobility in Bay City Same house 1 year ago 5,891 88.2% White (Caucasian)2,244 92.1% Black or African American24 56.6% American Indian / Alaska Native137 66.4% Asian5,790 91.8% Other race3,056 86.9% Two or more races3,767 84.3% White alone, not Hispanic / Latino9,656 92.4% Hispanic or LatinoMoved within same county 347 5.2% White / Caucasian59 2.4% Black or African American8 3.7% Asian18 44.4% Native Hawaiian / Pacific Islander230 3.6% Other race150 4.3% Two or more races321 7.2% White alone, not Hispanic / Latino322 3.1% Hispanic or LatinoMoved within same state 320 4.8% White / Caucasian89 3.6% Black or African American65 31.4% Asian45 0.7% Other race247 7.0% Two or more races229 5.1% White alone, not Hispanic / Latino239 2.3% Hispanic or LatinoMoved from different state 71 1.1% White / Caucasian70 2.9% Black or African American203 3.2% Other race18 0.5% Two or more races73 1.6% White alone, not Hispanic / Latino170 1.6% Hispanic or LatinoMoved from abroad 48 0.7% White10 23.4% American Indian / Alaska Native77 1.2% Other race36 1.0% Two or more races72 1.6% White alone, not Hispanic / Latino95 0.9% Hispanic or Latino
Children Nativity (place of birth) in Bay City
Children under 6 years - Living with two parents Both parents native 391 66.5% Native197 33.5% Foreign-bornBoth parents foreign-born 223 83.2% Native45 16.8% Foreign-bornOne native, one foreign-born parent 133 100.0% NativeChildren under 6 years - Living with one parent Native parent 1,003 100.0% NativeForeign-born parent 13 93.2% Native1 6.8% Foreign-bornChildren 6 to 17 years - Living with two parents Both parents native 572 100.0% Native0 0.0% Foreign-bornBoth parents foreign-born 522 64.6% Native285 35.4% Foreign-bornOne native, one foreign-born parent 413 94.5% Native24 5.5% Foreign-bornChildren 6 to 17 years - Living with one parent Native parent 1,150 100.0% NativeForeign-born parent 44 56.3% Native34 43.7% Foreign-born
Grandparents responsible for own grandchildren in Bay City
Grandparents (30 to 59 years) White / Caucasian 22 14.4% Responsible for grandchildren131 85.6% Not responsible for grandchildrenBlack or African American 6 100.0% Not responsible for grandchildrenOther race 10 24.6% Responsible for grandchildren29 75.4% Not responsible for grandchildrenTwo or more races 2 6.3% Responsible for grandchildren24 93.7% Not responsible for grandchildrenWhite alone, not Hispanic / Latino 17 30.1% Responsible for grandchildren38 69.9% Not responsible for grandchildrenHispanic or Latino 23 10.3% Responsible for grandchildren200 89.7% Not responsible for grandchildrenGrandparents (60 years and over) White / Caucasian 9 100.0% Responsible for grandchildrenBlack or African American 34 60.1% Responsible for grandchildren22 39.9% Not responsible for grandchildrenOther race 106 49.8% Responsible for grandchildren107 50.2% Not responsible for grandchildrenTwo or more races 2 100.0% Not responsible for grandchildrenHispanic or Latino 92 49.6% Responsible for grandchildren94 50.4% Not responsible for grandchildren