Races in Bay Village, Ohio (OH) Detailed Stats
Ancestries, Foreign-born residents, place of birth
Settings
X


Recent posts about races in Bay Village, Ohio on our local forum with over 2,400,000 registered users:
 | School board races pivot on mask mandates, critical race theory? (19 replies) |
| Is it right time to buy house in Cleveland suburbs? (32 replies) |
| How did Biden not win Ohio? (214 replies) |
| Cleveland's Real Estate Market is driving us crazy. (24 replies) |
| Lakewood (my impressions vs. negativity on the forum / in general) (51 replies) |
| Thinking of Ohio as option to move from NY (16 replies) |
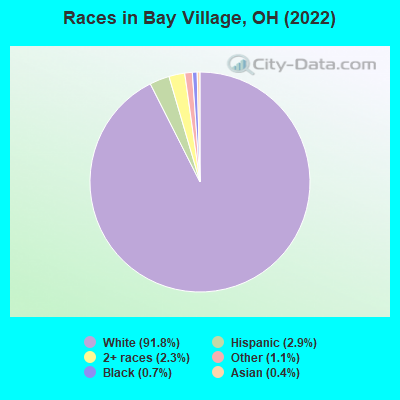
According to 2022 data, the most numerous races in Bay Village, OH are White alone (14,495 residents), Black alone (104 residents), and Two or more races (360 residents). 96.2% of Bay Village residents speak English at home. 3.0% of Bay Village, OH residents are foreign-born (1.4% born in Europe, 0.7% born in Asia, 0.5% born in Latin America), which is 33.5% less than the foreign-born rate of 4.0% across the entire state of Ohio.
Race distribution in Bay Village
2000
2022

- 15,65597.3%White alone
- 1571.0%Hispanic
- 1160.7%Asian alone
- 930.6%Two or more races
- 420.3%Black alone
- 190.1%Other race alone
- 40.02%American Indian alone
- 10.01%Native Hawaiian and Other
Pacific Islander alone

-
- 14,49591.8%White alone
- 4642.9%Hispanic
- 3602.3%Two or more races
- 1711.1%Other race alone
- 1040.7%Black alone
- 580.4%Asian alone
2000
2022
-
- 9,538,11184.0%White alone
- 1,290,66211.4%Black alone
- 217,1231.9%Hispanic
- 137,7701.2%Two or more races
- 131,6701.2%Asian alone
- 21,9850.2%American Indian alone
- 13,4830.1%Other race alone
- 2,3360.02%Native Hawaiian and Other
Pacific Islander alone

-
- 8,948,79376.1%White alone
- 1,401,40311.9%Black alone
- 529,2914.5%Two or more races
- 517,2324.4%Hispanic
- 293,3872.5%Asian alone
- 52,8050.4%Other race alone
- 9,7850.08%American Indian alone
- 3,3620.03%Native Hawaiian and Other
Pacific Islander alone

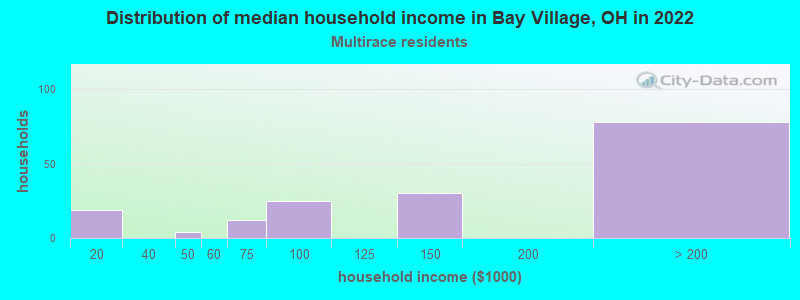
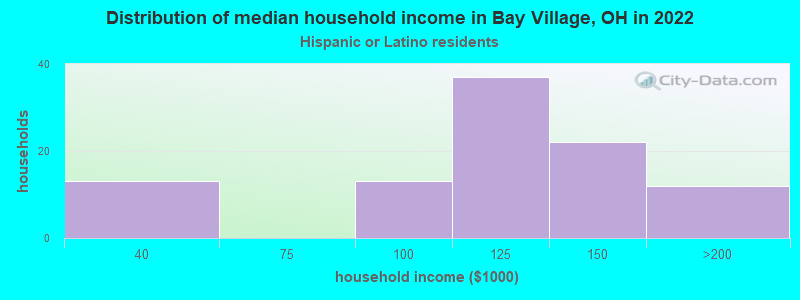
Income and house value in Bay Village
- Median household income in 2022
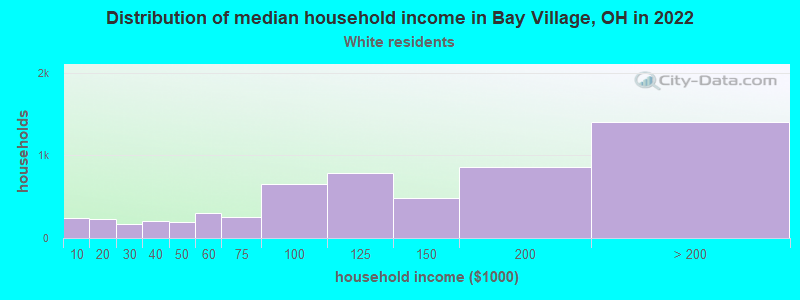
- $118,181White non-Hispanic householders
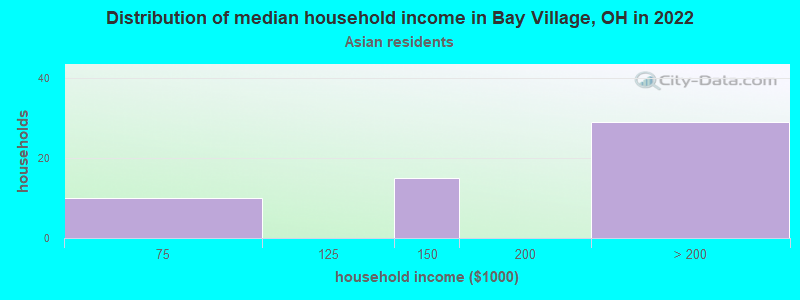
- over $200,000Asian householders
- $129,994Two or more races householders
- $131,391Hispanic or Latino race householders
- Median 2022 house value
- $345,480White Non-Hispanic householders
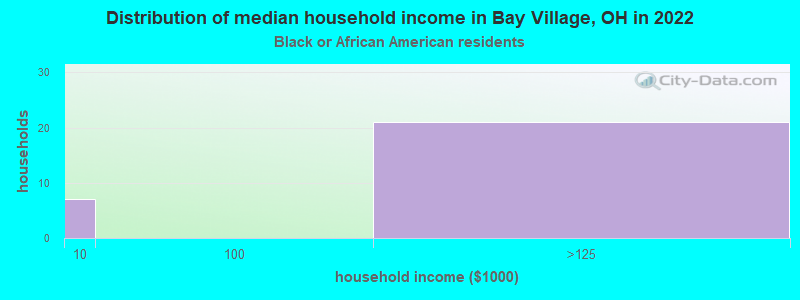
- $332,389Black or African American householders
- $276,138Asian householders
- over $1,000,000Some other race householders
- $244,638Two or more races householders
- $336,684Hispanic or Latino householders
Household income for White non-Hispanic householders
Household income for Black householders
Household income for Asian householders
Household income for Two or more races householders
Household income for Hispanic or Latino race householders
Median age by race in Bay Village
- 42.9Median age for White residents
- 40.4Males
- 45.1Females
- 54.4Median age for Black or African American residents
- 56.1Males
- 53.4Females
- -545,601,290.8Median age for American Indian / Alaska Native residents
- -734,374,999.3Males
- -499,999,999.5Females
- 47.0Median age for Asian residents
- 46.4Males
- 49.7Females
- -706,093,189.3Median age for Native Hawaiian / Pacific Islander residents
- -750,242,953.6Males
- -805,394,989.6Females
- 77.8Median age for Other race residents
- -613,026,819.3Males
- 73.8Females
- 31.4Median age for Two or more races residents
- 29.6Males
- 38.0Females
- 42.9Median age for White alone residents
- 40.2Males
- 45.1Females
- 27.2Median age for Hispanic or Latino residents
- 26.1Males
- 41.4Females
Owner/renter occupied households by race in Bay Village
- House owners and renters - White residents
- 5,32792.1%Owner occupied
- 4547.9%Renter occupied
- House owners and renters - Black or African American residents
- 28100.0%Owner occupied
- House owners and renters - American Indian / Alaska Native residents
- 10100.0%Owner occupied
- House owners and renters - Asian residents
- 54100.0%Owner occupied
- House owners and renters - Other race residents
- 41100.0%Owner occupied
- House owners and renters - Two or more races residents
- 16389.7%Owner occupied
- 1910.3%Renter occupied
- House owners and renters - White alone residents
- 5,29291.9%Owner occupied
- 4698.1%Renter occupied
- House owners and renters - Hispanic or Latino residents
- 105100.0%Owner occupied
Language usage in Bay Village
- English speakers - Total
- 96.2% of residents of Bay Village speak English at home.
- 0.9% of residents speak Spanish at home
- 9069.8%Speak English very well
- 3930.2%Speak English less than very well
- 2.8% of residents speak other language at home
- 33780.8%Speak English very well
- 8019.2%Speak English less than very well
- English speakers - Born in the United States
- 97.2% of residents of Bay Village speak English at home.
- 0.9% of residents speak Spanish at home
- 31100.0%Speak English very well
- 1.4% of residents speak other language at home
- 48100.0%Speak English very well
- English speakers - Native, born elsewhere
- 93.5% of residents of Bay Village speak English at home.
- 6.5% of residents speak other language at home
- 6100.0%Speak English very well
- English speakers - Foreign-born
- 30.2% of residents of Bay Village speak English at home.
- 16.5% of residents speak Spanish at home
- 2938.7%Speak English very well
- 4661.3%Speak English less than very well
- 53.5% of residents speak other language at home
- 17672.4%Speak English very well
- 6727.6%Speak English less than very well
White (Caucasian) - Speak only English
| Native: | 99.4% (13,064) |
| Foreign-born: | 36.3% (120) |
White (Caucasian) - Speak another language
| Native: | 1.2% (158) |
| Foreign-born: | 64.1% (212) |
Asian - Speak only English
| Native: | 94.2% (16) |
| Foreign-born: | 42.3% (18) |
Two or more races - Speak another language
| Native: | 7.1% (43) |
| Foreign-born: | 100.0% (12) |
White alone - Speak only English
| Native: | 98.3% (12,946) |
| Foreign-born: | 36.9% (122) |
White alone - Speak another language
| Native: | 1.6% (207) |
| Foreign-born: | 63.0% (207) |
Hispanic or Latino - Speak another language
| Native: | 8.4% (31) |
| Foreign-born: | 100.0% (67) |
Foreign-born residents in Bay Village
473 residents are foreign born (1.4% Europe, 0.7% Asia, 0.5% Latin America).
| This city: | 3.0% |
| Ohio: | 4.9% |


Marital status for residents in Bay Village
Marital status - White (Caucasian) population 15 years and over
- Males
- 25.5%Never married
- 66.7%Now married
- 0.1%Separated
- 2.2%Widowed
- 5.5%Divorced
- Females
- 19.6%Never married
- 59.0%Now married
- 0.2%Separated
- 8.1%Widowed
- 13.1%Divorced
Women who gave birth in the past 12 months
| Now married: | 100.0% (152) |
| Unmarried: | 0.0% (0) |
Women who did not give birth in the past 12 months
| Now married: | 56.0% (1,579) |
| Unmarried: | 44.0% (1,242) |
Marital status - Black or African American population 15 years and over
- Males
- 46.5%Never married
- 53.5%Now married
- 0.0%Separated
- 0.0%Widowed
- 0.0%Divorced
- Females
- 4.3%Never married
- 52.2%Now married
- 8.7%Separated
- 26.1%Widowed
- 8.7%Divorced
Women who did not give birth in the past 12 months
| Now married: | 0.0% (0) |
| Unmarried: | 100.0% (2) |
Marital status - American Indian / Alaska Native population 15 years and over
- Males
- 0.0%Never married
- 100.0%Now married
- 0.0%Separated
- 0.0%Widowed
- 0.0%Divorced
- Females
- 0.0%Never married
- 100.0%Now married
- 0.0%Separated
- 0.0%Widowed
- 0.0%Divorced
Women who did not give birth in the past 12 months
| Now married: | 100.0% (15) |
| Unmarried: | 0.0% (0) |
Marital status - Asian population 15 years and over
- Males
- 21.4%Never married
- 50.0%Now married
- 0.0%Separated
- 0.0%Widowed
- 28.6%Divorced
- Females
- 13.3%Never married
- 86.7%Now married
- 0.0%Separated
- 0.0%Widowed
- 0.0%Divorced
Women who did not give birth in the past 12 months
| Now married: | 78.9% (15) |
| Unmarried: | 21.1% (4) |
Marital status - Other race population 15 years and over
- Males
- 10.0%Never married
- 90.0%Now married
- 0.0%Separated
- 0.0%Widowed
- 0.0%Divorced
- Females
- 0.0%Never married
- 100.0%Now married
- 0.0%Separated
- 0.0%Widowed
- 0.0%Divorced
Women who did not give birth in the past 12 months
| Now married: | 100.0% (9) |
| Unmarried: | 0.0% (0) |
Marital status - Two or more races population 15 years and over
- Males
- 51.3%Never married
- 36.8%Now married
- 0.0%Separated
- 11.2%Widowed
- 0.7%Divorced
- Females
- 30.5%Never married
- 69.5%Now married
- 0.0%Separated
- 0.0%Widowed
- 0.0%Divorced
Women who gave birth in the past 12 months
| Now married: | 100.0% (22) |
| Unmarried: | 0.0% (0) |
Women who did not give birth in the past 12 months
| Now married: | 60.7% (123) |
| Unmarried: | 39.3% (80) |
Marital status - White alone, not Hispanic / Latino population 15 years and over
- Males
- 25.6%Never married
- 66.7%Now married
- 0.1%Separated
- 2.1%Widowed
- 5.5%Divorced
- Females
- 19.7%Never married
- 59.4%Now married
- 0.2%Separated
- 8.2%Widowed
- 12.5%Divorced
Women who gave birth in the past 12 months
| Now married: | 100.0% (156) |
| Unmarried: | 0.0% (0) |
Women who did not give birth in the past 12 months
| Now married: | 56.7% (1,619) |
| Unmarried: | 43.3% (1,236) |
Marital status - Hispanic or Latino population 15 years and over
- Males
- 49.0%Never married
- 45.0%Now married
- 0.0%Separated
- 6.0%Widowed
- 0.0%Divorced
- Females
- 35.2%Never married
- 35.2%Now married
- 0.0%Separated
- 0.0%Widowed
- 29.6%Divorced
Women who did not give birth in the past 12 months
| Now married: | 27.6% (37) |
| Unmarried: | 72.4% (96) |
Ancestries in Bay Village

- 1,41125.4%Irish
- 63311.4%German
- 4458.0%American
- 3957.1%English
- 3075.5%Polish
- 2855.1%European
- 2634.7%Italian
- 2193.9%Slovak
- 1312.4%Welsh
- 1282.3%Scottish
- 971.7%Lebanese
- 741.3%Albanian
- 731.3%Eastern European
- 711.3%Swedish
- 691.2%Greek
- 661.2%Hungarian
- 400.7%Swiss
- 330.6%Russian
- 290.5%Ukrainian
- 270.5%French
- 250.4%Dutch
- 240.4%Scotch-Irish
- 180.3%Czech
- 170.3%Norwegian
- 160.3%Jordanian
- 150.3%French Canadian
- 140.3%Egyptian
- 140.3%Slovene
- 120.2%British
- 120.2%Croatian
- 110.2%Serbian
- 100.2%Lithuanian
- 100.2%Soviet Union
- 90.2%Palestinian
- 70.1%Northern European
- 40.07%Canadian
- 40.07%Scandinavian
- 40.07%Finnish

Geographical mobility in Bay Village

- Same house 1 year ago
- 13,29693.0%White (Caucasian)
- 7990.2%Black or African American
- 1636.5%American Indian / Alaska Native
- 5798.7%Asian
- 19791.6%Other race
- 57089.5%Two or more races
- 13,29592.5%White alone, not Hispanic / Latino
- 38983.7%Hispanic or Latino

-
- Moved within same county
- 7125.0%White / Caucasian
- 45.0%Black or African American
- 1637.9%American Indian / Alaska Native
- 599.2%Two or more races
- 7435.2%White alone, not Hispanic / Latino
- 6413.8%Hispanic or Latino

-
- Moved within same state
- 1310.9%White / Caucasian
- 1310.9%White alone, not Hispanic / Latino

-
- Moved from different state
- 1461.0%White / Caucasian
- 77.9%Black or African American
- 1541.1%White alone, not Hispanic / Latino

Children Nativity (place of birth) in Bay Village
Place of birth for residents in Bay Village
![Place of birth for the foreign-born population - Regions]()
- 228Europe
- 142Eastern Europe
- 113Asia
- 111Americas
- 77Latin America
- 69Northern Europe
- 54South America
- 48Western Asia
- 33Northern America
- 29South Central Asia
- 25South Eastern Asia
- 23Central America
- 19Africa
- 19Northern Africa
- 16Southern Europe
- 10Eastern Asia
- 4China

![Place of birth for the foreign-born population - Countries]()
- 44Czechoslovakia
- 39Hungary
- 33Canada
- 30Peru
- 25Scotland
- 25Albania
- 23Guatemala
- 22Ireland
- 21Uzbekistan
- 21Israel
- 15Lebanon
- 15Guyana
- 14England
- 14Vietnam
- 12Serbia
- 11Poland
- 11Philippines
- 11Jordan
- 10Italy
- 10Egypt
- 9Lithuania
- 9Morocco
- 8India
- 8Ecuador
- 7United Kingdom
- 6Greece
- 6Korea
- 4China

Grandparents responsible for own grandchildren in Bay Village
Zip codes: 44140.