Races in Bayport, New York (NY) Detailed Stats
Data:
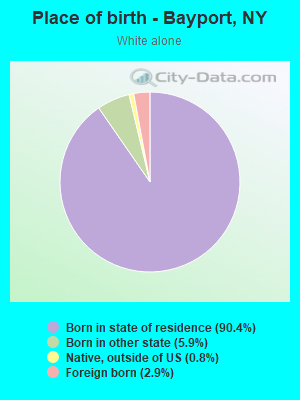
Races - White alone (%)
Races - White alone (% change since 2000)
Races - Black alone (%)
Races - Black alone (% change since 2000)
Races - American Indian alone (%)
Races - American Indian alone (% change since 2000)
Races - Asian alone (%)
Races - Asian alone (% change since 2000)
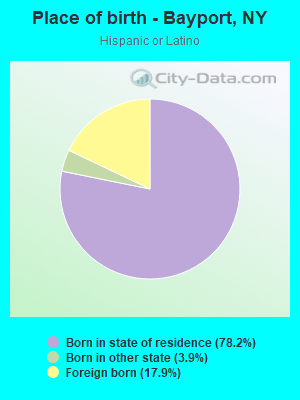
Races - Hispanic (%)
Races - Hispanic (% change since 2000)
Races - Native Hawaiian and Other Pacific Islander alone (%)
Races - Native Hawaiian and Other Pacific Islander alone (% change since 2000)
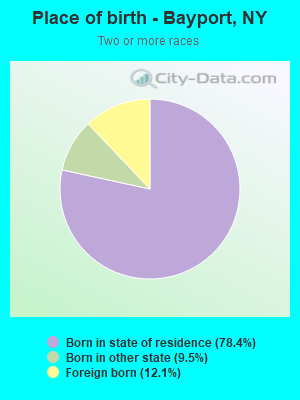
Races - Two or more races(%)
Races - Two or more races(% change since 2000)
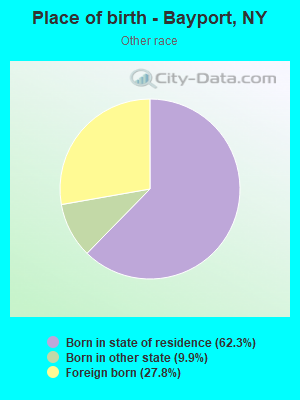
Races - Other race alone (%)
Races - Other race alone (% change since 2000)
Racial diversity
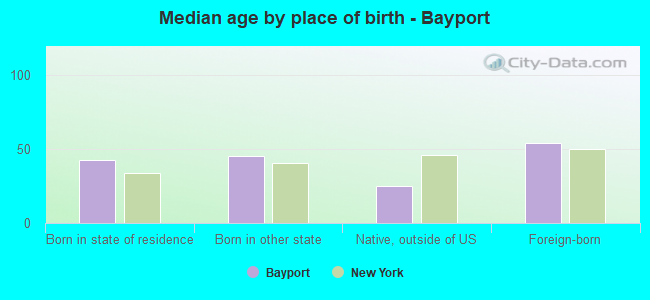
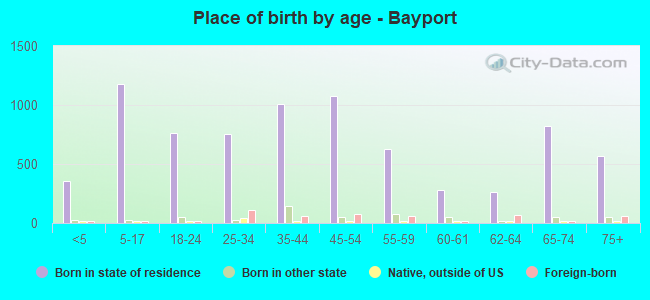
Place of birth - Born in state of residence (%)
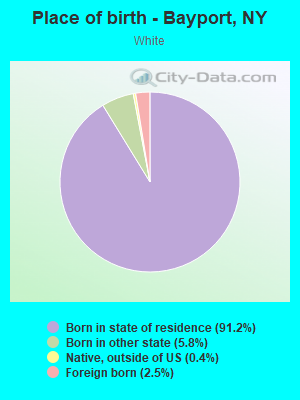
Place of birth - Born in state of residence (%) - White
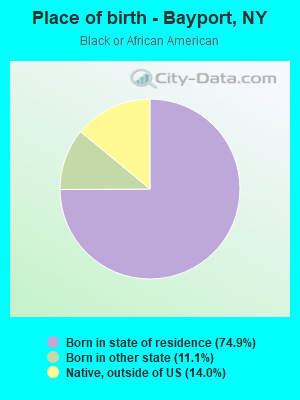
Place of birth - Born in state of residence (%) - Black or African American
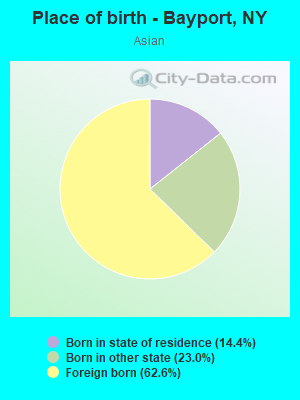
Place of birth - Born in state of residence (%) - Asian
Place of birth - Born in state of residence (%) - Hispanic or Latino
Place of birth - Born in state of residence (%) - American Indian and Alaska Native
Place of birth - Born in state of residence (%) - Multirace
Place of birth - Born in state of residence (%) - Other Race
Place of birth - Born in other state (%)
Place of birth - Born in other state (%) - White
Place of birth - Born in other state (%) - Black or African American
Place of birth - Born in other state (%) - Asian
Place of birth - Born in other state (%) - Hispanic or Latino
Place of birth - Born in other state (%) - American Indian and Alaska Native
Place of birth - Born in other state (%) - Multirace
Place of birth - Born in other state (%) - Other Race
Place of birth - Native, outside of US (%)
Place of birth - Native, outside of US (%) - White
Place of birth - Native, outside of US (%) - Black or African American
Place of birth - Native, outside of US (%) - Asian
Place of birth - Native, outside of US (%) - Hispanic or Latino
Place of birth - Native, outside of US (%) - American Indian and Alaska Native
Place of birth - Native, outside of US (%) - Multirace
Place of birth - Native, outside of US (%) - Other Race
Place of birth - Foreign born (%)
Place of birth - Foreign born (%) - White
Place of birth - Foreign born (%) - Black or African American
Place of birth - Foreign born (%) - Asian
Place of birth - Foreign born (%) - Hispanic or Latino
Place of birth - Foreign born (%) - American Indian and Alaska Native
Place of birth - Foreign born (%) - Multirace
Place of birth - Foreign born (%) - Other Race
Residents speaking English at home (%)
Residents speaking English at home - Born in the United States (%)
Residents speaking English at home - Native, born elsewhere (%)
Residents speaking English at home - Foreign born (%)
Residents speaking Spanish at home (%)
Residents speaking Spanish at home - Born in the United States (%)
Residents speaking Spanish at home - Native, born elsewhere (%)
Residents speaking Spanish at home - Foreign born (%)
Residents speaking other language at home (%)
Residents speaking other language at home - Born in the United States (%)
Residents speaking other language at home - Native, born elsewhere (%)
Residents speaking other language at home - Foreign born (%)
Marital status - Never married (%)
Marital status - Now married (%)
Marital status - Separated (%)
Marital status - Widowed (%)
Marital status - Divorced (%)
Ancestries Reported - Arab (%)
Ancestries Reported - Czech (%)
Ancestries Reported - Danish (%)
Ancestries Reported - Dutch (%)
Ancestries Reported - English (%)
Ancestries Reported - French (%)
Ancestries Reported - French Canadian (%)
Ancestries Reported - German (%)
Ancestries Reported - Greek (%)
Ancestries Reported - Hungarian (%)
Ancestries Reported - Irish (%)
Ancestries Reported - Italian (%)
Ancestries Reported - Lithuanian (%)
Ancestries Reported - Norwegian (%)
Ancestries Reported - Polish (%)
Ancestries Reported - Portuguese (%)
Ancestries Reported - Russian (%)
Ancestries Reported - Scotch-Irish (%)
Ancestries Reported - Scottish (%)
Ancestries Reported - Slovak (%)
Ancestries Reported - Subsaharan African (%)
Ancestries Reported - Swedish (%)
Ancestries Reported - Swiss (%)
Ancestries Reported - Ukrainian (%)
Ancestries Reported - United States (%)
Ancestries Reported - Welsh (%)
Ancestries Reported - West Indian (%)
Ancestries Reported - Other (%)
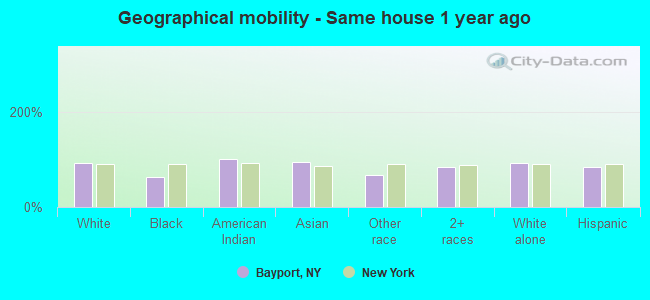
Geographical mobility - Same house 1 year ago (%)
Geographical mobility - Same house 1 year ago (%) - White
Geographical mobility - Same house 1 year ago (%) - Black or African American
Geographical mobility - Same house 1 year ago (%) - Asian
Geographical mobility - Same house 1 year ago (%) - Hispanic or Latino
Geographical mobility - Same house 1 year ago (%) - American Indian and Alaska Native
Geographical mobility - Same house 1 year ago (%) - Multirace
Geographical mobility - Same house 1 year ago (%) - Other Race
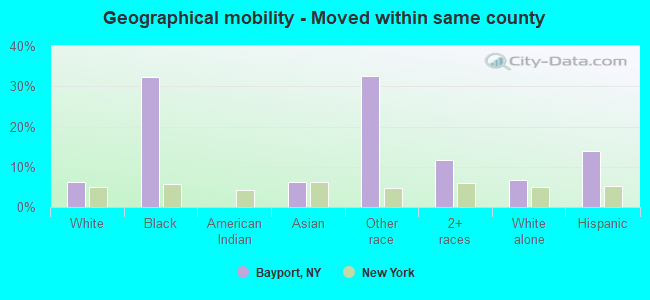
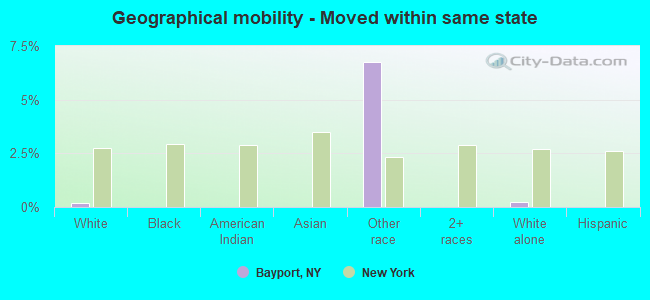
Geographical mobility - Moved within same county (%)
Geographical mobility - Moved within same county (%) - White
Geographical mobility - Moved within same county (%) - Black or African American
Geographical mobility - Moved within same county (%) - Asian
Geographical mobility - Moved within same county (%) - Hispanic or Latino
Geographical mobility - Moved within same county (%) - American Indian and Alaska Native
Geographical mobility - Moved within same county (%) - Multirace
Geographical mobility - Moved within same county (%) - Other Race
Geographical mobility - Moved from different county within same state (%)
Geographical mobility - Moved from different county within same state (%) - White
Geographical mobility - Moved from different county within same state (%) - Black or African American
Geographical mobility - Moved from different county within same state (%) - Asian
Geographical mobility - Moved from different county within same state (%) - Hispanic or Latino
Geographical mobility - Moved from different county within same state (%) - American Indian and Alaska Native
Geographical mobility - Moved from different county within same state (%) - Multirace
Geographical mobility - Moved from different county within same state (%) - Other Race
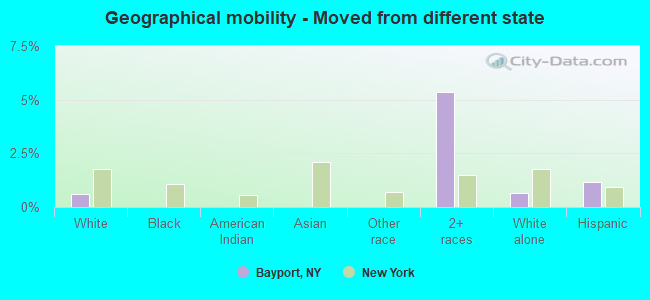
Geographical mobility - Moved from different state (%)
Geographical mobility - Moved from different state (%) - White
Geographical mobility - Moved from different state (%) - Black or African American
Geographical mobility - Moved from different state (%) - Asian
Geographical mobility - Moved from different state (%) - Hispanic or Latino
Geographical mobility - Moved from different state (%) - American Indian and Alaska Native
Geographical mobility - Moved from different state (%) - Multirace
Geographical mobility - Moved from different state (%) - Other Race
Geographical mobility - Moved from abroad (%)
Geographical mobility - Moved from abroad (%) - White
Geographical mobility - Moved from abroad (%) - Black or African American
Geographical mobility - Moved from abroad (%) - Asian
Geographical mobility - Moved from abroad (%) - Hispanic or Latino
Geographical mobility - Moved from abroad (%) - American Indian and Alaska Native
Geographical mobility - Moved from abroad (%) - Multirace
Geographical mobility - Moved from abroad (%) - Other Race
Place of birth for the foreign-born population - Ireland (%)
Place of birth for the foreign-born population - Denmark (%)
Place of birth for the foreign-born population - Norway (%)
Place of birth for the foreign-born population - Sweden (%)
Place of birth for the foreign-born population - United Kingdom (%)
Place of birth for the foreign-born population - England (%)
Place of birth for the foreign-born population - Scotland (%)
Place of birth for the foreign-born population - Other Northern Europe (%)
Place of birth for the foreign-born population - Austria (%)
Place of birth for the foreign-born population - Belgium (%)
Place of birth for the foreign-born population - France (%)
Place of birth for the foreign-born population - Germany (%)
Place of birth for the foreign-born population - Netherlands (%)
Place of birth for the foreign-born population - Switzerland (%)
Place of birth for the foreign-born population - Other Western Europe (%)
Place of birth for the foreign-born population - Greece (%)
Place of birth for the foreign-born population - Italy (%)
Place of birth for the foreign-born population - Portugal (%)
Place of birth for the foreign-born population - Spain (%)
Place of birth for the foreign-born population - Other Southern Europe (%)
Place of birth for the foreign-born population - Albania (%)
Place of birth for the foreign-born population - Belarus (%)
Place of birth for the foreign-born population - Bosnia and Herzegovina (%)
Place of birth for the foreign-born population - Bulgaria (%)
Place of birth for the foreign-born population - Croatia (%)
Place of birth for the foreign-born population - Czechoslovakia (%)
Place of birth for the foreign-born population - Hungary (%)
Place of birth for the foreign-born population - Latvia (%)
Place of birth for the foreign-born population - Lithuania (%)
Place of birth for the foreign-born population - North Macedonia (Macedonia) (%)
Place of birth for the foreign-born population - Moldova (%)
Place of birth for the foreign-born population - Poland (%)
Place of birth for the foreign-born population - Romania (%)
Place of birth for the foreign-born population - Russia (%)
Place of birth for the foreign-born population - Serbia (%)
Place of birth for the foreign-born population - Ukraine (%)
Place of birth for the foreign-born population - Other Eastern Europe (%)
Place of birth for the foreign-born population - China (%)
Place of birth for the foreign-born population - Hong Kong (%)
Place of birth for the foreign-born population - Taiwan (%)
Place of birth for the foreign-born population - Japan (%)
Place of birth for the foreign-born population - Korea (%)
Place of birth for the foreign-born population - Other Eastern Asia (%)
Place of birth for the foreign-born population - Afghanistan (%)
Place of birth for the foreign-born population - Bangladesh (%)
Place of birth for the foreign-born population - India (%)
Place of birth for the foreign-born population - Iran (%)
Place of birth for the foreign-born population - Kazakhstan (%)
Place of birth for the foreign-born population - Nepal (%)
Place of birth for the foreign-born population - Pakistan (%)
Place of birth for the foreign-born population - Sri Lanka (%)
Place of birth for the foreign-born population - Uzbekistan (%)
Place of birth for the foreign-born population - Other South Central Asia (%)
Place of birth for the foreign-born population - Burma (%)
Place of birth for the foreign-born population - Cambodia (%)
Place of birth for the foreign-born population - Indonesia (%)
Place of birth for the foreign-born population - Laos (%)
Place of birth for the foreign-born population - Malaysia (%)
Place of birth for the foreign-born population - Philippines (%)
Place of birth for the foreign-born population - Singapore (%)
Place of birth for the foreign-born population - Thailand (%)
Place of birth for the foreign-born population - Vietnam (%)
Place of birth for the foreign-born population - Other South Eastern Asia (%)
Place of birth for the foreign-born population - Armenia (%)
Place of birth for the foreign-born population - Iraq (%)
Place of birth for the foreign-born population - Israel (%)
Place of birth for the foreign-born population - Jordan (%)
Place of birth for the foreign-born population - Kuwait (%)
Place of birth for the foreign-born population - Lebanon (%)
Place of birth for the foreign-born population - Saudi Arabia (%)
Place of birth for the foreign-born population - Syria (%)
Place of birth for the foreign-born population - Turkey (%)
Place of birth for the foreign-born population - Yemen (%)
Place of birth for the foreign-born population - Other Western Asia (%)
Place of birth for the foreign-born population - Eritrea (%)
Place of birth for the foreign-born population - Ethiopia (%)
Place of birth for the foreign-born population - Kenya (%)
Place of birth for the foreign-born population - Somalia (%)
Place of birth for the foreign-born population - Uganda (%)
Place of birth for the foreign-born population - Zimbabwe (%)
Place of birth for the foreign-born population - Other Eastern Africa (%)
Place of birth for the foreign-born population - Cameroon (%)
Place of birth for the foreign-born population - Congo (%)
Place of birth for the foreign-born population - Democratic Republic of Congo (Zaire) (%)
Place of birth for the foreign-born population - Other Middle Africa (%)
Place of birth for the foreign-born population - Egypt (%)
Place of birth for the foreign-born population - Morocco (%)
Place of birth for the foreign-born population - Sudan (%)
Place of birth for the foreign-born population - Other Northern Africa (%)
Place of birth for the foreign-born population - South Africa (%)
Place of birth for the foreign-born population - Other Southern Africa (%)
Place of birth for the foreign-born population - Cabo Verde (%)
Place of birth for the foreign-born population - Ghana (%)
Place of birth for the foreign-born population - Liberia (%)
Place of birth for the foreign-born population - Nigeria (%)
Place of birth for the foreign-born population - Senegal (%)
Place of birth for the foreign-born population - Sierra Leone (%)
Place of birth for the foreign-born population - Other Western Africa (%)
Place of birth for the foreign-born population - Australia (%)
Place of birth for the foreign-born population - New Zealand (%)
Place of birth for the foreign-born population - Fiji (%)
Place of birth for the foreign-born population - Micronesia (%)
Place of birth for the foreign-born population - Bahamas (%)
Place of birth for the foreign-born population - Barbados (%)
Place of birth for the foreign-born population - Cuba (%)
Place of birth for the foreign-born population - Dominica (%)
Place of birth for the foreign-born population - Dominican Republic (%)
Place of birth for the foreign-born population - Grenada (%)
Place of birth for the foreign-born population - Haiti (%)
Place of birth for the foreign-born population - Jamaica (%)
Place of birth for the foreign-born population - St. Vincent and the Grenadines (%)
Place of birth for the foreign-born population - Trinidad and Tobago (%)
Place of birth for the foreign-born population - West Indies (%)
Place of birth for the foreign-born population - Other Caribbean (%)
Place of birth for the foreign-born population - Belize (%)
Place of birth for the foreign-born population - Costa Rica (%)
Place of birth for the foreign-born population - El Salvador (%)
Place of birth for the foreign-born population - Guatemala (%)
Place of birth for the foreign-born population - Honduras (%)
Place of birth for the foreign-born population - Mexico (%)
Place of birth for the foreign-born population - Nicaragua (%)
Place of birth for the foreign-born population - Panama (%)
Place of birth for the foreign-born population - Other Central America (%)
Place of birth for the foreign-born population - Argentina (%)
Place of birth for the foreign-born population - Bolivia (%)
Place of birth for the foreign-born population - Brazil (%)
Place of birth for the foreign-born population - Chile (%)
Place of birth for the foreign-born population - Colombia (%)
Place of birth for the foreign-born population - Ecuador (%)
Place of birth for the foreign-born population - Guyana (%)
Place of birth for the foreign-born population - Peru (%)
Place of birth for the foreign-born population - Uruguay (%)
Place of birth for the foreign-born population - Venezuela (%)
Place of birth for the foreign-born population - Other South America (%)
Place of birth for the foreign-born population - Canada (%)
Place of birth for the foreign-born population - Other Northern America (%)
Place of birth for the foreign-born population - Other (%)
Latest news about races in Bayport, NY collected exclusively by city-data.com from local newspapers, TV, and radio stations
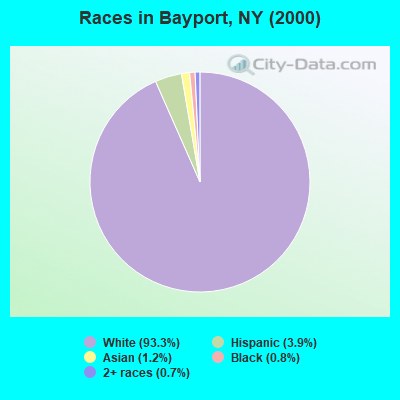
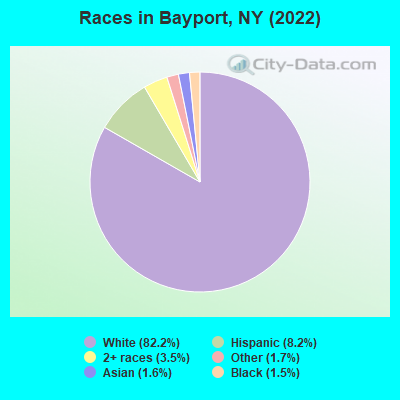
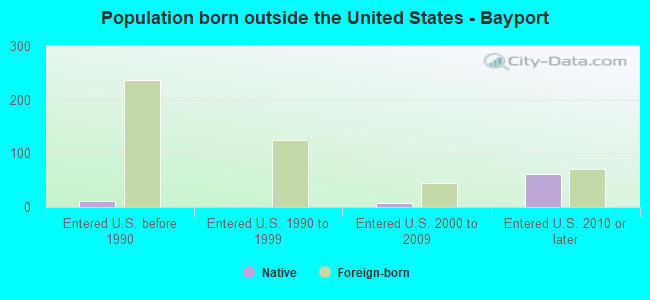
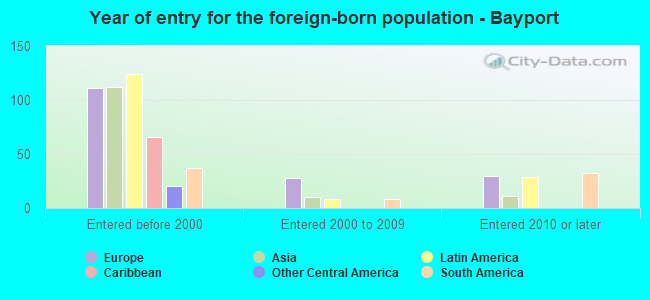
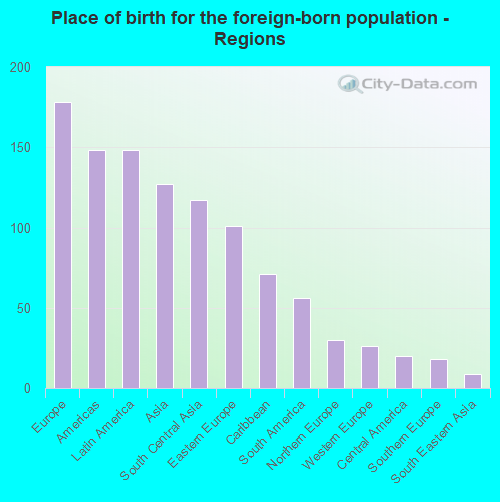
According to 2022 data, the most numerous races in Bayport, NY are White alone (7,337 residents), Hispanic (729 residents), and Black alone (134 residents). 91.0% of Bayport residents speak English at home. 5.1% of Bayport, NY residents are foreign-born (2.0% born in Europe, 1.7% born in Latin America, 1.4% born in Asia), which is 333.4% less than the foreign-born rate of 22.0% across the entire state of New York.
Race distribution in Bayport
2000 2022
11,760,981 62.0% White alone 2,867,583 15.1% Hispanic 2,812,623 14.8% Black alone 1,035,926 5.5% Asian alone 366,116 1.9% Two or more races 75,499 0.4% Other race alone 52,499 0.3% American Indian alone 5,230 0.03% Native Hawaiian and Other
10,408,933 52.9% White alone 3,867,299 19.7% Hispanic 2,633,840 13.4% Black alone 1,776,286 9.0% Asian alone 732,670 3.7% Two or more races 216,110 1.1% Other race alone 35,082 0.2% American Indian alone 6,931 0.04% Native Hawaiian and Other
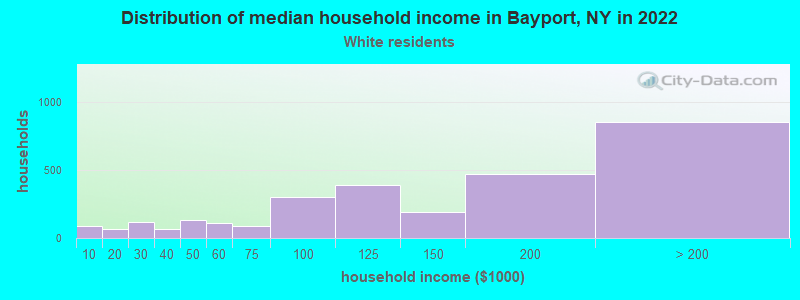
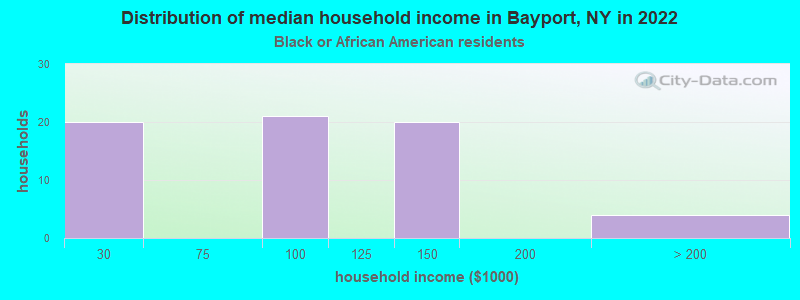
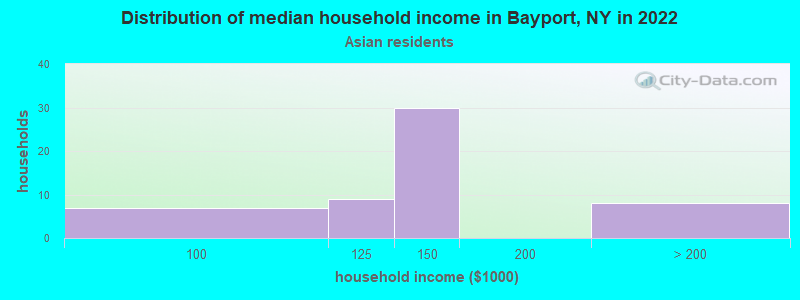
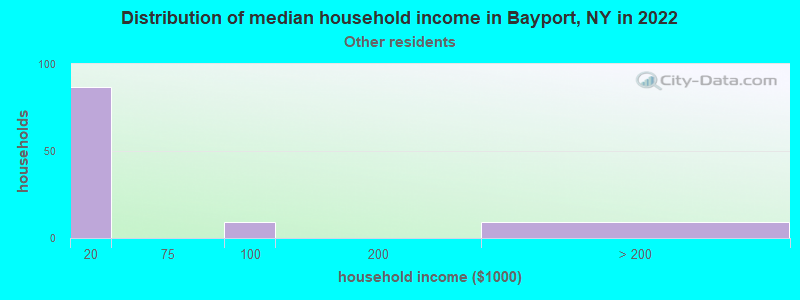
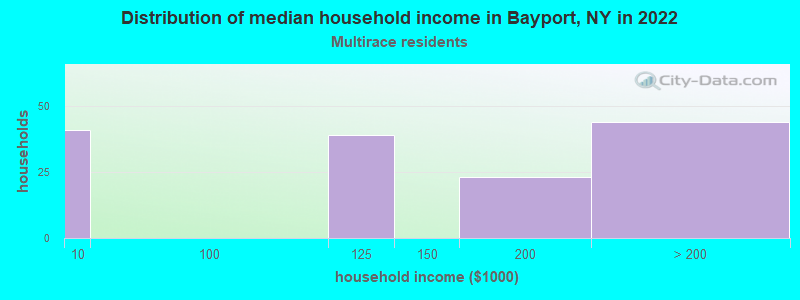
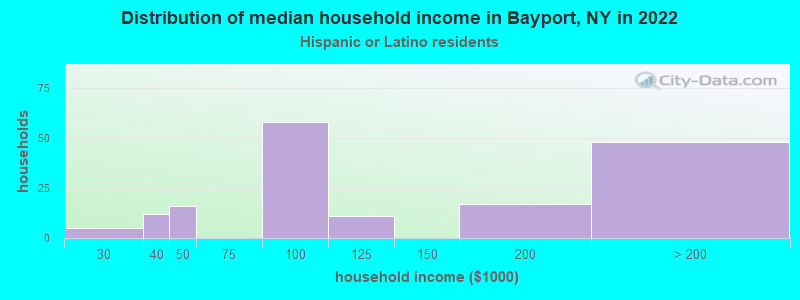
Income and house value in Bayport Median household income in 2022 $128,218 White non-Hispanic householders$142,360 Asian householders$195,844 Two or more races householdersMedian 2022 house value $654,962 White Non-Hispanic householdersover $1,000,000 Black or African American householders$566,445 American Indian or Alaska Native householders over $1,000,000 Asian householders$679,734 Two or more races householders$557,080 Hispanic or Latino householders
Median age by race in Bayport
45.4 Median age for White residents44.8 45.6 23.8 Median age for Black or African American residents23.5 37.9 -748,832,865.7 Median age for American Indian / Alaska Native residents-807,017,543.1 -513,692,161.9 42.6 Median age for Asian residents57.5 23.7 -742,816,091.2 Median age for Native Hawaiian / Pacific Islander residents-831,187,409.8 -771,300,447.7 64.5 Median age for Other race residents52.2 74.5 31.4 Median age for Two or more races residents31.2 29.6 45.1 Median age for White alone residents44.5 46.3 31.4 Median age for Hispanic or Latino residents35.2 21.8
Owner/renter occupied households by race in Bayport
House owners and renters - White residents 2,300 80.2% Owner occupied569 19.8% Renter occupiedHouse owners and renters - Black or African American residents 5 8.2% Owner occupied56 91.8% Renter occupiedHouse owners and renters - American Indian / Alaska Native residents 9 100.0% Owner occupiedHouse owners and renters - Asian residents 46 86.8% Owner occupied7 13.2% Renter occupiedHouse owners and renters - Other race residents 113 89.1% Owner occupied14 10.9% Renter occupiedHouse owners and renters - Two or more races residents 68 54.4% Owner occupied57 45.6% Renter occupiedHouse owners and renters - White alone residents 2,333 80.9% Owner occupied551 19.1% Renter occupiedHouse owners and renters - Hispanic or Latino residents 86 49.7% Owner occupied87 50.3% Renter occupied
Language usage in Bayport
English speakers - Total 91.0% of residents of Bayport speak English at home.
3.2% of residents speak Spanish at home 238 88.1% Speak English very well32 11.9% Speak English less than very well4.3% of residents speak other language at home 272 74.7% Speak English very well92 25.3% Speak English less than very well
English speakers - Born in the United States 86.9% of residents of Bayport speak English at home.
1.5% of residents speak Spanish at home 8 100.0% Speak English very well12.5% of residents speak other language at home 65 100.0% Speak English very well
All residents speak only English at home
English speakers - Foreign-born 45.3% of residents of Bayport speak English at home.
15.4% of residents speak Spanish at home 66 86.8% Speak English very well10 13.2% Speak English less than very well33.9% of residents speak other language at home 102 61.1% Speak English very well65 38.9% Speak English less than very well
White (Caucasian) - Speak only English Native:
98.2% (6,703)Foreign-born:
60.5% (112)
White (Caucasian) - Speak another language Native:
2.7% (182)Foreign-born:
48.9% (91)
Asian - Speak only English Native:
50.9% (32)Foreign-born:
43.2% (36)
Asian - Speak another language Native:
48.2% (30)Foreign-born:
35.1% (30)
Other race - Speak only English Native:
76.4% (157)Foreign-born:
14.4% (11)
Other race - Speak another language Native:
27.9% (57)Foreign-born:
84.1% (64)
Two or more races - Speak only English Native:
90.6% (458)Foreign-born:
51.0% (38)
Two or more races - Speak another language Native:
10.4% (52)Foreign-born:
43.8% (33)
White alone - Speak only English Native:
96.6% (6,616)Foreign-born:
54.3% (115)
White alone - Speak another language Native:
3.4% (230)Foreign-born:
45.8% (97)
Hispanic or Latino - Speak only English Native:
82.0% (415)Foreign-born:
29.5% (38)
Hispanic or Latino - Speak another language Native:
20.1% (102)Foreign-born:
68.3% (87)
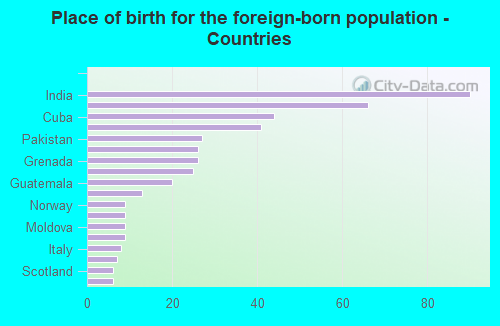
Foreign-born residents in Bayport 453 residents are foreign born (2.0% Europe , 1.7% Latin America , 1.4% Asia ).
This city:
5.1%New York:
22.6%
Marital status for residents in Bayport Marital status - White (Caucasian) population 15 years and over
Males 27.5% Never married56.3% Now married2.7% Separated2.1% Widowed11.4% DivorcedFemales 24.6% Never married55.3% Now married1.4% Separated8.4% Widowed10.3% DivorcedWomen who gave birth in the past 12 months Now married:
63.3% (49)Unmarried:
36.7% (29)
Women who did not give birth in the past 12 months Now married:
50.9% (698)Unmarried:
49.1% (674)
Marital status - Black or African American population 15 years and over
Males 42.0% Never married31.9% Now married0.0% Separated0.0% Widowed26.1% DivorcedFemales 61.2% Never married0.0% Now married38.8% Separated0.0% Widowed0.0% DivorcedWomen who did not give birth in the past 12 months Now married:
38.8% (19)Unmarried:
61.2% (30)
Marital status - Asian population 15 years and over
Males 0.0% Never married78.4% Now married0.0% Separated0.0% Widowed21.6% DivorcedFemales 54.8% Never married45.2% Now married0.0% Separated0.0% Widowed0.0% DivorcedWomen who did not give birth in the past 12 months Now married:
22.0% (9)Unmarried:
78.0% (33)
Marital status - Other race population 15 years and over
Males 29.9% Never married41.8% Now married0.0% Separated0.0% Widowed28.4% DivorcedFemales 6.1% Never married81.8% Now married6.8% Separated5.3% Widowed0.0% DivorcedWomen who did not give birth in the past 12 months Now married:
77.1% (39)Unmarried:
22.9% (12)
Marital status - Two or more races population 15 years and over
Males 45.7% Never married50.2% Now married0.0% Separated0.0% Widowed4.0% DivorcedFemales 50.3% Never married42.0% Now married0.0% Separated0.0% Widowed7.7% DivorcedWomen who did not give birth in the past 12 months Now married:
19.1% (25)Unmarried:
80.9% (105)
Marital status - White alone, not Hispanic / Latino population 15 years and over
Males 27.0% Never married57.2% Now married1.4% Separated2.2% Widowed12.1% DivorcedFemales 24.4% Never married56.2% Now married1.1% Separated8.0% Widowed10.2% DivorcedWomen who gave birth in the past 12 months Now married:
63.3% (54)Unmarried:
36.7% (31)
Women who did not give birth in the past 12 months Now married:
52.1% (756)Unmarried:
47.9% (696)
Marital status - Hispanic or Latino population 15 years and over
Males 43.1% Never married40.5% Now married11.5% Separated0.0% Widowed4.9% DivorcedFemales 46.0% Never married28.4% Now married10.2% Separated9.7% Widowed5.7% DivorcedWomen who did not give birth in the past 12 months Now married:
15.7% (18)Unmarried:
84.3% (94)
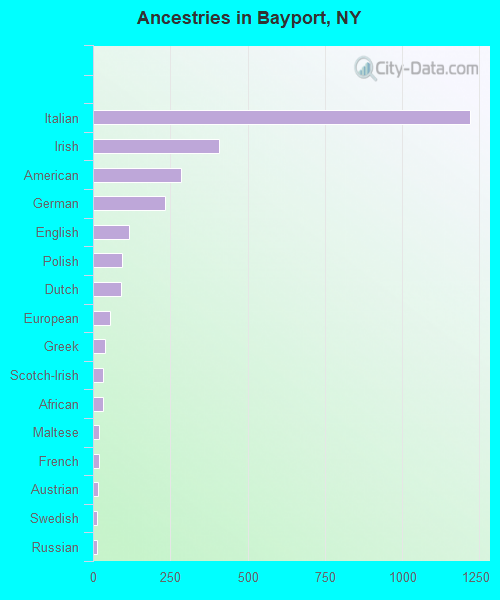
Ancestries in Bayport
1,220 37.2% Italian408 12.5% Irish286 8.7% American234 7.1% German116 3.5% English94 2.9% Polish89 2.7% Dutch55 1.7% European39 1.2% Greek31 0.9% Scotch-Irish31 0.9% African21 0.6% Maltese18 0.5% French16 0.5% Austrian14 0.4% Swedish13 0.4% Russian11 0.3% Hungarian10 0.3% French Canadian10 0.3% Norwegian10 0.3% Scottish9 0.3% Ukrainian7 0.2% Guyanese7 0.2% Jamaican6 0.2% Czech
Children Nativity (place of birth) in Bayport
Children under 6 years - Living with two parents Both parents native 323 100.0% NativeOne native, one foreign-born parent 21 100.0% NativeChildren under 6 years - Living with one parent Native parent 76 100.0% NativeForeign-born parent 36 100.0% Native
Children 6 to 17 years - Living with two parents Both parents native 569 100.0% NativeBoth parents foreign-born 44 100.0% NativeOne native, one foreign-born parent 25 100.0% NativeChildren 6 to 17 years - Living with one parent Native parent 479 100.0% Native
Grandparents responsible for own grandchildren in Bayport
Grandparents (30 to 59 years) White / Caucasian 5 100.0% Not responsible for grandchildrenWhite alone, not Hispanic / Latino 6 100.0% Not responsible for grandchildren
Grandparents (60 years and over) White / Caucasian 70 100.0% Not responsible for grandchildrenWhite alone, not Hispanic / Latino 77 100.0% Not responsible for grandchildren