Races in Bayshore Gardens, Florida (FL) Detailed Stats
Data:
Races - White alone (%)
Races - White alone (% change since 2000)
Races - Black alone (%)
Races - Black alone (% change since 2000)
Races - American Indian alone (%)
Races - American Indian alone (% change since 2000)
Races - Asian alone (%)
Races - Asian alone (% change since 2000)
Races - Hispanic (%)
Races - Hispanic (% change since 2000)
Races - Native Hawaiian and Other Pacific Islander alone (%)
Races - Native Hawaiian and Other Pacific Islander alone (% change since 2000)
Races - Two or more races(%)
Races - Two or more races(% change since 2000)
Races - Other race alone (%)
Races - Other race alone (% change since 2000)
Racial diversity
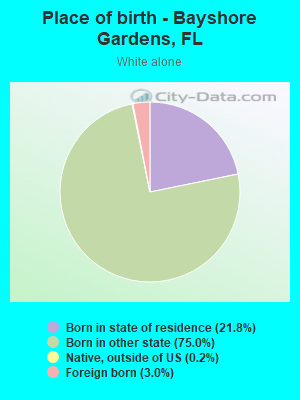
Place of birth - Born in state of residence (%)
Place of birth - Born in state of residence (%) - White
Place of birth - Born in state of residence (%) - Black or African American
Place of birth - Born in state of residence (%) - Asian
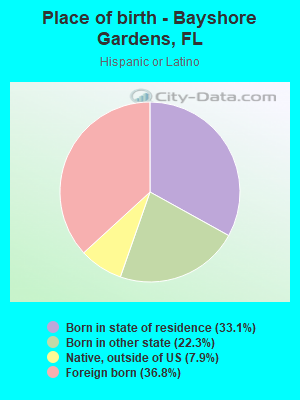
Place of birth - Born in state of residence (%) - Hispanic or Latino
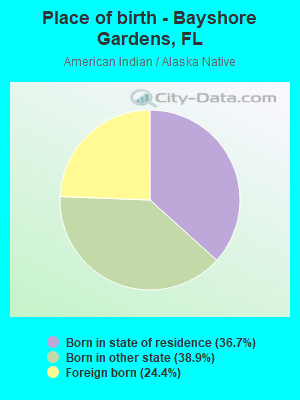
Place of birth - Born in state of residence (%) - American Indian and Alaska Native
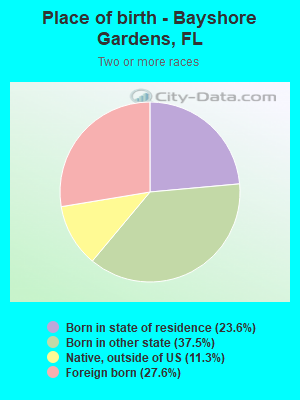
Place of birth - Born in state of residence (%) - Multirace
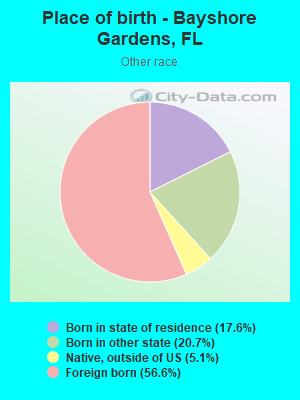
Place of birth - Born in state of residence (%) - Other Race
Place of birth - Born in other state (%)
Place of birth - Born in other state (%) - White
Place of birth - Born in other state (%) - Black or African American
Place of birth - Born in other state (%) - Asian
Place of birth - Born in other state (%) - Hispanic or Latino
Place of birth - Born in other state (%) - American Indian and Alaska Native
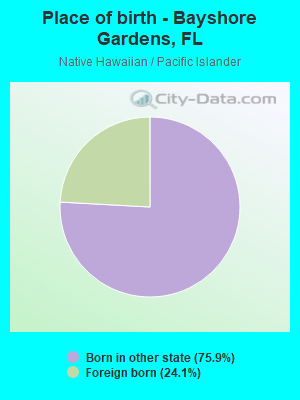
Place of birth - Born in other state (%) - Multirace
Place of birth - Born in other state (%) - Other Race
Place of birth - Native, outside of US (%)
Place of birth - Native, outside of US (%) - White
Place of birth - Native, outside of US (%) - Black or African American
Place of birth - Native, outside of US (%) - Asian
Place of birth - Native, outside of US (%) - Hispanic or Latino
Place of birth - Native, outside of US (%) - American Indian and Alaska Native
Place of birth - Native, outside of US (%) - Multirace
Place of birth - Native, outside of US (%) - Other Race
Place of birth - Foreign born (%)
Place of birth - Foreign born (%) - White
Place of birth - Foreign born (%) - Black or African American
Place of birth - Foreign born (%) - Asian
Place of birth - Foreign born (%) - Hispanic or Latino
Place of birth - Foreign born (%) - American Indian and Alaska Native
Place of birth - Foreign born (%) - Multirace
Place of birth - Foreign born (%) - Other Race
Residents speaking English at home (%)
Residents speaking English at home - Born in the United States (%)
Residents speaking English at home - Native, born elsewhere (%)
Residents speaking English at home - Foreign born (%)
Residents speaking Spanish at home (%)
Residents speaking Spanish at home - Born in the United States (%)
Residents speaking Spanish at home - Native, born elsewhere (%)
Residents speaking Spanish at home - Foreign born (%)
Residents speaking other language at home (%)
Residents speaking other language at home - Born in the United States (%)
Residents speaking other language at home - Native, born elsewhere (%)
Residents speaking other language at home - Foreign born (%)
Marital status - Never married (%)
Marital status - Now married (%)
Marital status - Separated (%)
Marital status - Widowed (%)
Marital status - Divorced (%)
Ancestries Reported - Arab (%)
Ancestries Reported - Czech (%)
Ancestries Reported - Danish (%)
Ancestries Reported - Dutch (%)
Ancestries Reported - English (%)
Ancestries Reported - French (%)
Ancestries Reported - French Canadian (%)
Ancestries Reported - German (%)
Ancestries Reported - Greek (%)
Ancestries Reported - Hungarian (%)
Ancestries Reported - Irish (%)
Ancestries Reported - Italian (%)
Ancestries Reported - Lithuanian (%)
Ancestries Reported - Norwegian (%)
Ancestries Reported - Polish (%)
Ancestries Reported - Portuguese (%)
Ancestries Reported - Russian (%)
Ancestries Reported - Scotch-Irish (%)
Ancestries Reported - Scottish (%)
Ancestries Reported - Slovak (%)
Ancestries Reported - Subsaharan African (%)
Ancestries Reported - Swedish (%)
Ancestries Reported - Swiss (%)
Ancestries Reported - Ukrainian (%)
Ancestries Reported - United States (%)
Ancestries Reported - Welsh (%)
Ancestries Reported - West Indian (%)
Ancestries Reported - Other (%)
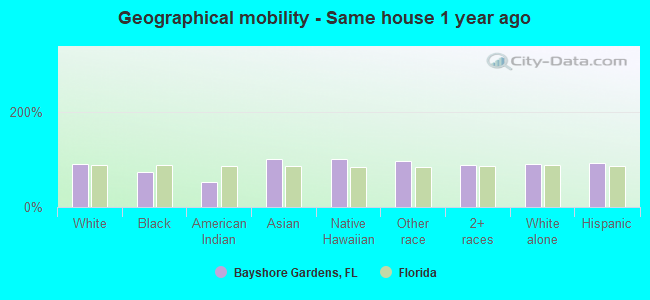
Geographical mobility - Same house 1 year ago (%)
Geographical mobility - Same house 1 year ago (%) - White
Geographical mobility - Same house 1 year ago (%) - Black or African American
Geographical mobility - Same house 1 year ago (%) - Asian
Geographical mobility - Same house 1 year ago (%) - Hispanic or Latino
Geographical mobility - Same house 1 year ago (%) - American Indian and Alaska Native
Geographical mobility - Same house 1 year ago (%) - Multirace
Geographical mobility - Same house 1 year ago (%) - Other Race
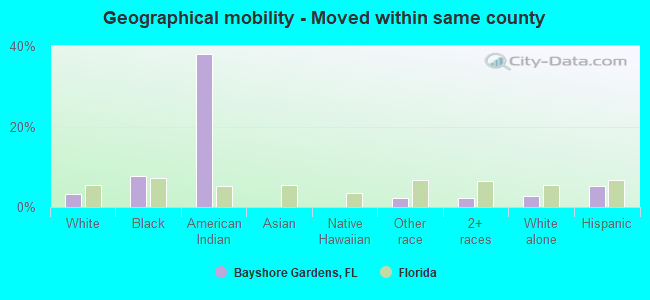
Geographical mobility - Moved within same county (%)
Geographical mobility - Moved within same county (%) - White
Geographical mobility - Moved within same county (%) - Black or African American
Geographical mobility - Moved within same county (%) - Asian
Geographical mobility - Moved within same county (%) - Hispanic or Latino
Geographical mobility - Moved within same county (%) - American Indian and Alaska Native
Geographical mobility - Moved within same county (%) - Multirace
Geographical mobility - Moved within same county (%) - Other Race
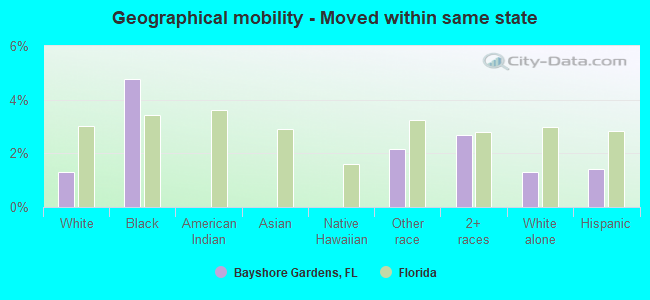
Geographical mobility - Moved from different county within same state (%)
Geographical mobility - Moved from different county within same state (%) - White
Geographical mobility - Moved from different county within same state (%) - Black or African American
Geographical mobility - Moved from different county within same state (%) - Asian
Geographical mobility - Moved from different county within same state (%) - Hispanic or Latino
Geographical mobility - Moved from different county within same state (%) - American Indian and Alaska Native
Geographical mobility - Moved from different county within same state (%) - Multirace
Geographical mobility - Moved from different county within same state (%) - Other Race
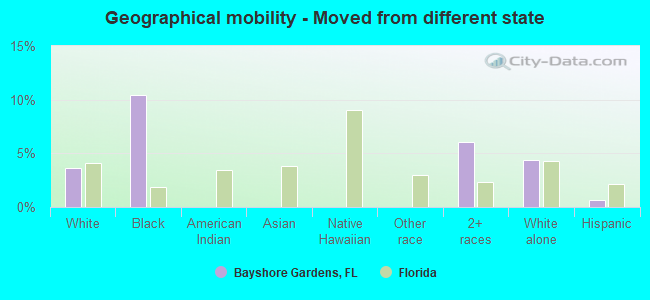
Geographical mobility - Moved from different state (%)
Geographical mobility - Moved from different state (%) - White
Geographical mobility - Moved from different state (%) - Black or African American
Geographical mobility - Moved from different state (%) - Asian
Geographical mobility - Moved from different state (%) - Hispanic or Latino
Geographical mobility - Moved from different state (%) - American Indian and Alaska Native
Geographical mobility - Moved from different state (%) - Multirace
Geographical mobility - Moved from different state (%) - Other Race
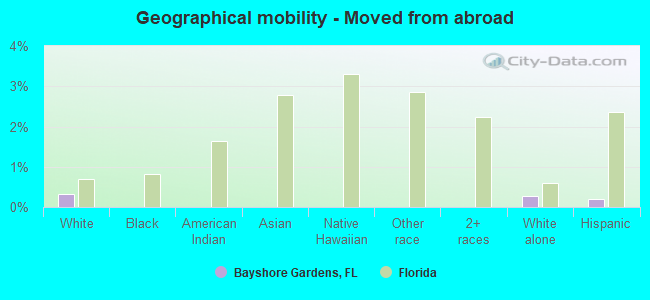
Geographical mobility - Moved from abroad (%)
Geographical mobility - Moved from abroad (%) - White
Geographical mobility - Moved from abroad (%) - Black or African American
Geographical mobility - Moved from abroad (%) - Asian
Geographical mobility - Moved from abroad (%) - Hispanic or Latino
Geographical mobility - Moved from abroad (%) - American Indian and Alaska Native
Geographical mobility - Moved from abroad (%) - Multirace
Geographical mobility - Moved from abroad (%) - Other Race
Place of birth for the foreign-born population - Ireland (%)
Place of birth for the foreign-born population - Denmark (%)
Place of birth for the foreign-born population - Norway (%)
Place of birth for the foreign-born population - Sweden (%)
Place of birth for the foreign-born population - United Kingdom (%)
Place of birth for the foreign-born population - England (%)
Place of birth for the foreign-born population - Scotland (%)
Place of birth for the foreign-born population - Other Northern Europe (%)
Place of birth for the foreign-born population - Austria (%)
Place of birth for the foreign-born population - Belgium (%)
Place of birth for the foreign-born population - France (%)
Place of birth for the foreign-born population - Germany (%)
Place of birth for the foreign-born population - Netherlands (%)
Place of birth for the foreign-born population - Switzerland (%)
Place of birth for the foreign-born population - Other Western Europe (%)
Place of birth for the foreign-born population - Greece (%)
Place of birth for the foreign-born population - Italy (%)
Place of birth for the foreign-born population - Portugal (%)
Place of birth for the foreign-born population - Spain (%)
Place of birth for the foreign-born population - Other Southern Europe (%)
Place of birth for the foreign-born population - Albania (%)
Place of birth for the foreign-born population - Belarus (%)
Place of birth for the foreign-born population - Bosnia and Herzegovina (%)
Place of birth for the foreign-born population - Bulgaria (%)
Place of birth for the foreign-born population - Croatia (%)
Place of birth for the foreign-born population - Czechoslovakia (%)
Place of birth for the foreign-born population - Hungary (%)
Place of birth for the foreign-born population - Latvia (%)
Place of birth for the foreign-born population - Lithuania (%)
Place of birth for the foreign-born population - North Macedonia (Macedonia) (%)
Place of birth for the foreign-born population - Moldova (%)
Place of birth for the foreign-born population - Poland (%)
Place of birth for the foreign-born population - Romania (%)
Place of birth for the foreign-born population - Russia (%)
Place of birth for the foreign-born population - Serbia (%)
Place of birth for the foreign-born population - Ukraine (%)
Place of birth for the foreign-born population - Other Eastern Europe (%)
Place of birth for the foreign-born population - China (%)
Place of birth for the foreign-born population - Hong Kong (%)
Place of birth for the foreign-born population - Taiwan (%)
Place of birth for the foreign-born population - Japan (%)
Place of birth for the foreign-born population - Korea (%)
Place of birth for the foreign-born population - Other Eastern Asia (%)
Place of birth for the foreign-born population - Afghanistan (%)
Place of birth for the foreign-born population - Bangladesh (%)
Place of birth for the foreign-born population - India (%)
Place of birth for the foreign-born population - Iran (%)
Place of birth for the foreign-born population - Kazakhstan (%)
Place of birth for the foreign-born population - Nepal (%)
Place of birth for the foreign-born population - Pakistan (%)
Place of birth for the foreign-born population - Sri Lanka (%)
Place of birth for the foreign-born population - Uzbekistan (%)
Place of birth for the foreign-born population - Other South Central Asia (%)
Place of birth for the foreign-born population - Burma (%)
Place of birth for the foreign-born population - Cambodia (%)
Place of birth for the foreign-born population - Indonesia (%)
Place of birth for the foreign-born population - Laos (%)
Place of birth for the foreign-born population - Malaysia (%)
Place of birth for the foreign-born population - Philippines (%)
Place of birth for the foreign-born population - Singapore (%)
Place of birth for the foreign-born population - Thailand (%)
Place of birth for the foreign-born population - Vietnam (%)
Place of birth for the foreign-born population - Other South Eastern Asia (%)
Place of birth for the foreign-born population - Armenia (%)
Place of birth for the foreign-born population - Iraq (%)
Place of birth for the foreign-born population - Israel (%)
Place of birth for the foreign-born population - Jordan (%)
Place of birth for the foreign-born population - Kuwait (%)
Place of birth for the foreign-born population - Lebanon (%)
Place of birth for the foreign-born population - Saudi Arabia (%)
Place of birth for the foreign-born population - Syria (%)
Place of birth for the foreign-born population - Turkey (%)
Place of birth for the foreign-born population - Yemen (%)
Place of birth for the foreign-born population - Other Western Asia (%)
Place of birth for the foreign-born population - Eritrea (%)
Place of birth for the foreign-born population - Ethiopia (%)
Place of birth for the foreign-born population - Kenya (%)
Place of birth for the foreign-born population - Somalia (%)
Place of birth for the foreign-born population - Uganda (%)
Place of birth for the foreign-born population - Zimbabwe (%)
Place of birth for the foreign-born population - Other Eastern Africa (%)
Place of birth for the foreign-born population - Cameroon (%)
Place of birth for the foreign-born population - Congo (%)
Place of birth for the foreign-born population - Democratic Republic of Congo (Zaire) (%)
Place of birth for the foreign-born population - Other Middle Africa (%)
Place of birth for the foreign-born population - Egypt (%)
Place of birth for the foreign-born population - Morocco (%)
Place of birth for the foreign-born population - Sudan (%)
Place of birth for the foreign-born population - Other Northern Africa (%)
Place of birth for the foreign-born population - South Africa (%)
Place of birth for the foreign-born population - Other Southern Africa (%)
Place of birth for the foreign-born population - Cabo Verde (%)
Place of birth for the foreign-born population - Ghana (%)
Place of birth for the foreign-born population - Liberia (%)
Place of birth for the foreign-born population - Nigeria (%)
Place of birth for the foreign-born population - Senegal (%)
Place of birth for the foreign-born population - Sierra Leone (%)
Place of birth for the foreign-born population - Other Western Africa (%)
Place of birth for the foreign-born population - Australia (%)
Place of birth for the foreign-born population - New Zealand (%)
Place of birth for the foreign-born population - Fiji (%)
Place of birth for the foreign-born population - Micronesia (%)
Place of birth for the foreign-born population - Bahamas (%)
Place of birth for the foreign-born population - Barbados (%)
Place of birth for the foreign-born population - Cuba (%)
Place of birth for the foreign-born population - Dominica (%)
Place of birth for the foreign-born population - Dominican Republic (%)
Place of birth for the foreign-born population - Grenada (%)
Place of birth for the foreign-born population - Haiti (%)
Place of birth for the foreign-born population - Jamaica (%)
Place of birth for the foreign-born population - St. Vincent and the Grenadines (%)
Place of birth for the foreign-born population - Trinidad and Tobago (%)
Place of birth for the foreign-born population - West Indies (%)
Place of birth for the foreign-born population - Other Caribbean (%)
Place of birth for the foreign-born population - Belize (%)
Place of birth for the foreign-born population - Costa Rica (%)
Place of birth for the foreign-born population - El Salvador (%)
Place of birth for the foreign-born population - Guatemala (%)
Place of birth for the foreign-born population - Honduras (%)
Place of birth for the foreign-born population - Mexico (%)
Place of birth for the foreign-born population - Nicaragua (%)
Place of birth for the foreign-born population - Panama (%)
Place of birth for the foreign-born population - Other Central America (%)
Place of birth for the foreign-born population - Argentina (%)
Place of birth for the foreign-born population - Bolivia (%)
Place of birth for the foreign-born population - Brazil (%)
Place of birth for the foreign-born population - Chile (%)
Place of birth for the foreign-born population - Colombia (%)
Place of birth for the foreign-born population - Ecuador (%)
Place of birth for the foreign-born population - Guyana (%)
Place of birth for the foreign-born population - Peru (%)
Place of birth for the foreign-born population - Uruguay (%)
Place of birth for the foreign-born population - Venezuela (%)
Place of birth for the foreign-born population - Other South America (%)
Place of birth for the foreign-born population - Canada (%)
Place of birth for the foreign-born population - Other Northern America (%)
Place of birth for the foreign-born population - Other (%)
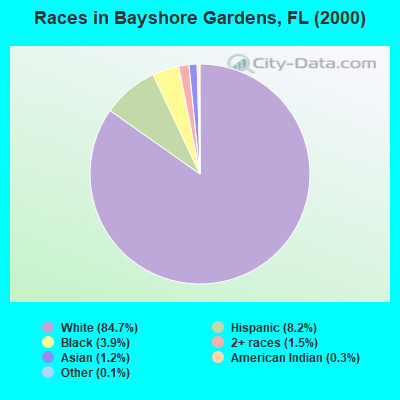
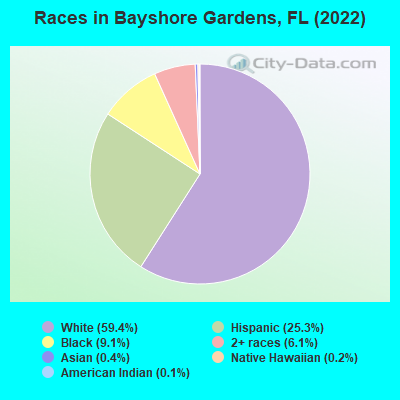
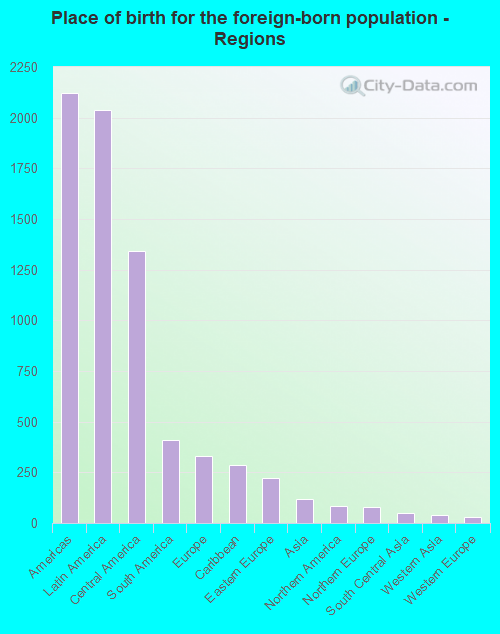
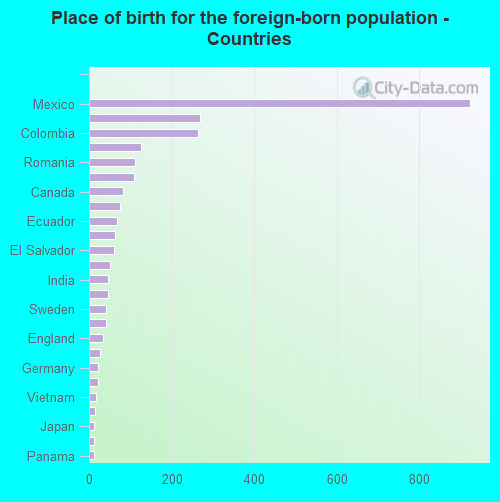
According to 2022 data, the most numerous races in Bayshore Gardens, FL are White alone (11,805 residents), Hispanic (5,022 residents), and Black alone (1,806 residents). 77.8% of Bayshore Gardens residents speak English at home. 13.1% of Bayshore Gardens, FL residents are foreign-born (10.3% born in Latin America, 1.7% born in Europe), which is 60.8% less than the foreign-born rate of 21.0% across the entire state of Florida.
Race distribution in Bayshore Gardens
2000 2022
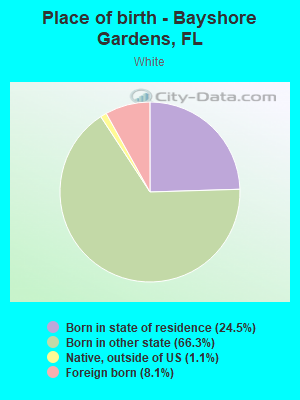
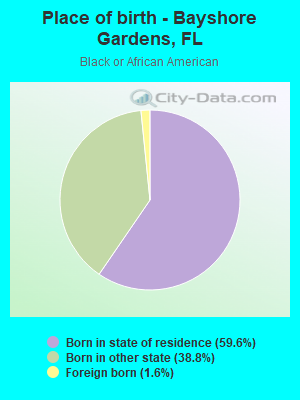
10,458,509 65.4% White alone 2,682,715 16.8% Hispanic 2,264,268 14.2% Black alone 261,693 1.6% Asian alone 236,954 1.5% Two or more races 42,358 0.3% American Indian alone 28,994 0.2% Other race alone 6,887 0.04% Native Hawaiian and Other
11,309,403 50.8% White alone 6,025,039 27.1% Hispanic 3,241,015 14.6% Black alone 861,630 3.9% Two or more races 623,692 2.8% Asian alone 152,054 0.7% Other race alone 22,504 0.1% American Indian alone 9,486 0.04% Native Hawaiian and Other
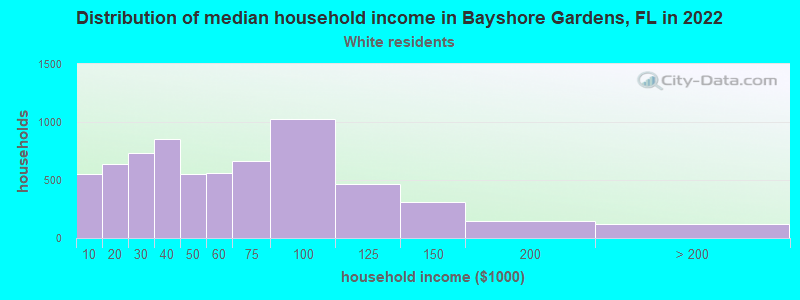
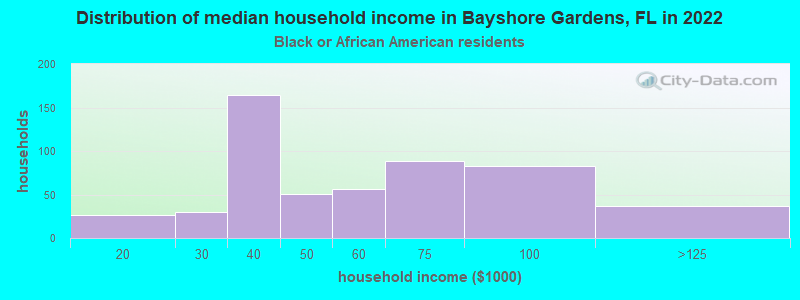
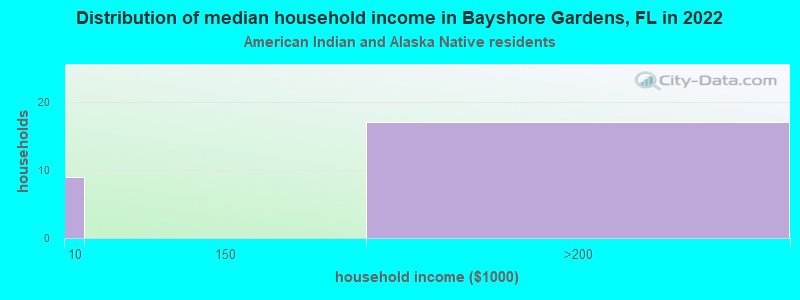
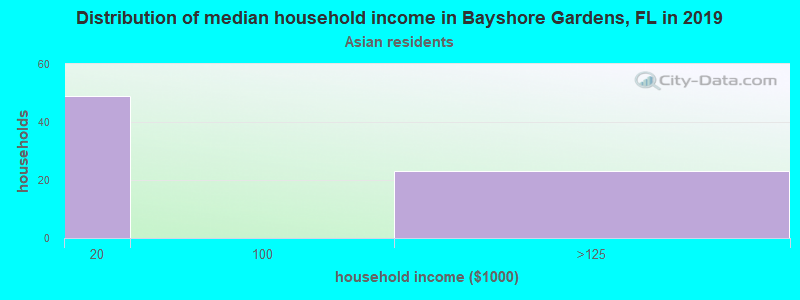
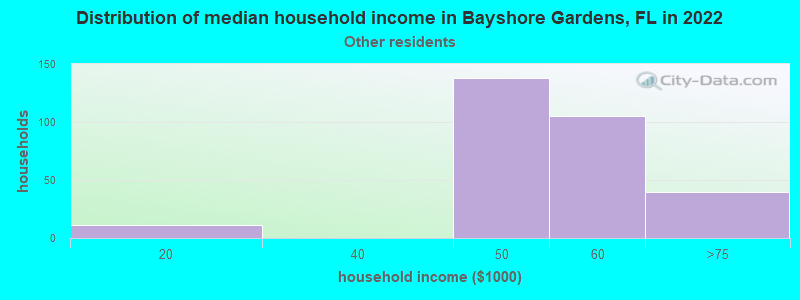
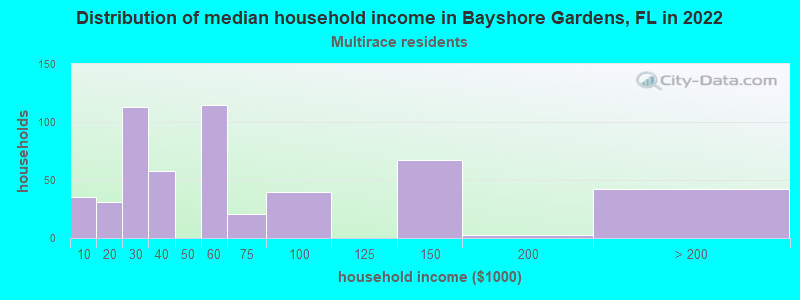
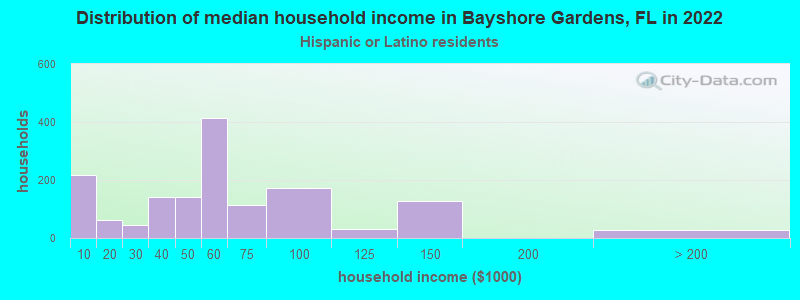
Income and house value in Bayshore Gardens Median household income in 2022 $49,450 White non-Hispanic householders$50,752 Black householders$35,366 Some other race householders$46,853 Two or more races householders$51,409 Hispanic or Latino race householdersMedian 2022 house value $218,542 White Non-Hispanic householders$210,527 Black or African American householders$367,353 American Indian or Alaska Native householders $348,385 Asian householders$207,588 Some other race householders$229,496 Two or more races householders$224,152 Hispanic or Latino householders
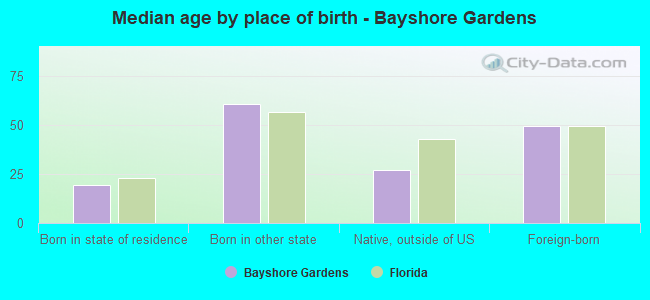
Median age by race in Bayshore Gardens
56.6 Median age for White residents52.7 60.2 34.6 Median age for Black or African American residents51.3 21.7 22.1 Median age for American Indian / Alaska Native residents-611,418,047.3 21.7 32.2 Median age for Asian residents36.8 58.1 -679,849,340.2 Median age for Native Hawaiian / Pacific Islander residents-858,307,848.3 -443,298,968.6 40.0 Median age for Other race residents38.6 41.7 18.9 Median age for Two or more races residents16.9 21.8 60.9 Median age for White alone residents58.6 64.6 30.7 Median age for Hispanic or Latino residents29.4 31.9
Owner/renter occupied households by race in Bayshore Gardens
House owners and renters - White residents 4,995 73.5% Owner occupied1,799 26.5% Renter occupiedHouse owners and renters - Black or African American residents 114 20.1% Owner occupied452 79.9% Renter occupiedHouse owners and renters - American Indian / Alaska Native residents 13 48.2% Owner occupied14 51.8% Renter occupiedHouse owners and renters - Asian residents 13 100.0% Owner occupiedHouse owners and renters - Native Hawaiian / Pacific Islander residents 21 100.0% Owner occupiedHouse owners and renters - Other race residents 222 64.3% Owner occupied123 35.7% Renter occupiedHouse owners and renters - Two or more races residents 341 59.8% Owner occupied229 40.2% Renter occupiedHouse owners and renters - White alone residents 4,689 75.2% Owner occupied1,543 24.8% Renter occupiedHouse owners and renters - Hispanic or Latino residents 830 58.0% Owner occupied602 42.0% Renter occupied
Language usage in Bayshore Gardens
English speakers - Total 77.8% of residents of Bayshore Gardens speak English at home.
18.0% of residents speak Spanish at home 2,094 61.1% Speak English very well1,331 38.9% Speak English less than very well3.4% of residents speak other language at home 519 81.0% Speak English very well122 19.0% Speak English less than very well
English speakers - Born in the United States 94.3% of residents of Bayshore Gardens speak English at home.
5.0% of residents speak Spanish at home 552 99.1% Speak English very well5 0.9% Speak English less than very well1.2% of residents speak other language at home 107 79.3% Speak English very well28 20.7% Speak English less than very well
English speakers - Native, born elsewhere 24.2% of residents of Bayshore Gardens speak English at home.
69.5% of residents speak Spanish at home 211 71.3% Speak English very well85 28.7% Speak English less than very well
English speakers - Foreign-born 8.7% of residents of Bayshore Gardens speak English at home.
67.1% of residents speak Spanish at home 522 30.1% Speak English very well1,214 69.9% Speak English less than very well17.9% of residents speak other language at home 370 79.7% Speak English very well94 20.3% Speak English less than very well
White (Caucasian) - Speak only English Native:
91.8% (11,449)Foreign-born:
12.9% (150)
White (Caucasian) - Speak another language Native:
6.7% (835)Foreign-born:
74.8% (866)
Black or African American - Speak only English Native:
96.4% (1,590)Foreign-born:
13.3% (4)
Black or African American - Speak another language Native:
1.5% (25)Foreign-born:
100.0% (31)
American Indian / Alaska Native - Speak another language Native:
31.9% (19)Foreign-born:
100.0% (19)
Native Hawaiian / Pacific Islander - Speak only English Native:
87.6% (24)Foreign-born:
100.0% (10)
Other race - Speak only English Native:
35.0% (137)Foreign-born:
3.1% (15)
Other race - Speak another language Native:
64.2% (251)Foreign-born:
93.4% (460)
Two or more races - Speak only English Native:
75.6% (1,487)Foreign-born:
5.1% (38)
Two or more races - Speak another language Native:
21.7% (427)Foreign-born:
92.9% (704)
White alone - Speak only English Native:
97.9% (10,831)Foreign-born:
32.3% (115)
White alone - Speak another language Native:
2.1% (237)Foreign-born:
69.2% (247)
Hispanic or Latino - Speak only English Native:
45.5% (1,276)Foreign-born:
3.7% (68)
Hispanic or Latino - Speak another language Native:
54.2% (1,519)Foreign-born:
93.1% (1,725)
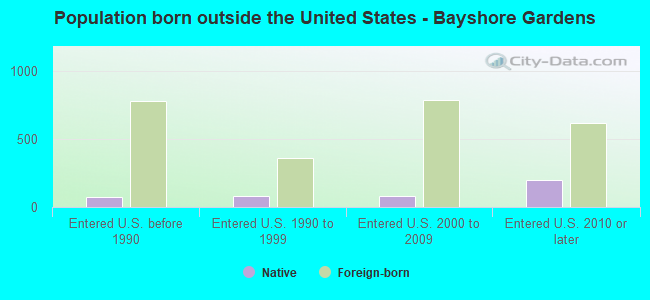
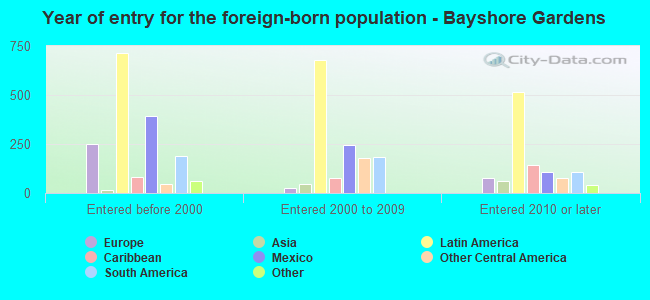
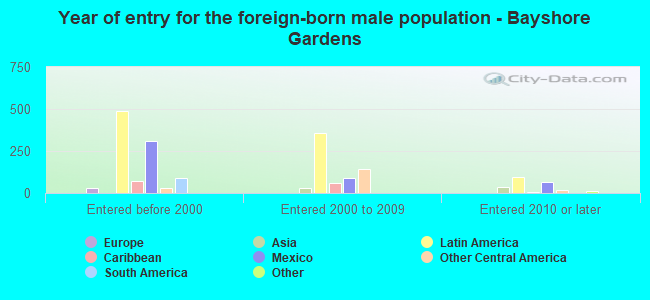
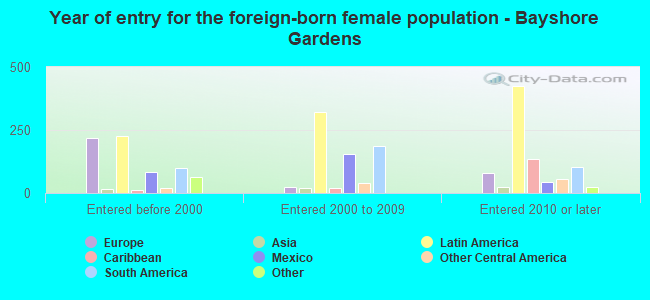
Foreign-born residents in Bayshore Gardens 2,593 residents are foreign born (10.3% Latin America , 1.7% Europe ).
This city:
13.1%Florida:
21.1%
Marital status for residents in Bayshore Gardens Marital status - White (Caucasian) population 15 years and over
Males 29.2% Never married44.3% Now married1.0% Separated6.2% Widowed19.3% DivorcedFemales 18.9% Never married40.8% Now married4.0% Separated12.6% Widowed23.8% DivorcedWomen who gave birth in the past 12 months Now married:
28.9% (63)Unmarried:
71.1% (156)
Women who did not give birth in the past 12 months Now married:
48.1% (960)Unmarried:
51.9% (1,034)
Marital status - Black or African American population 15 years and over
Males 34.5% Never married37.1% Now married1.5% Separated3.3% Widowed23.6% DivorcedFemales 72.6% Never married1.5% Now married0.0% Separated2.6% Widowed23.3% DivorcedWomen who gave birth in the past 12 months Now married:
0.0% (0)Unmarried:
100.0% (37)
Women who did not give birth in the past 12 months Now married:
2.1% (11)Unmarried:
97.9% (514)
Marital status - American Indian / Alaska Native population 15 years and over
Males 100.0% Never married0.0% Now married0.0% Separated0.0% Widowed0.0% DivorcedFemales 100.0% Never married0.0% Now married0.0% Separated0.0% Widowed0.0% DivorcedWomen who did not give birth in the past 12 months Now married:
0.0% (0)Unmarried:
100.0% (47)
Marital status - Asian population 15 years and over
Males 83.3% Never married16.7% Now married0.0% Separated0.0% Widowed0.0% DivorcedFemales 28.9% Never married57.9% Now married0.0% Separated0.0% Widowed13.2% DivorcedWomen who did not give birth in the past 12 months Now married:
0.0% (0)Unmarried:
100.0% (17)
Marital status - Native Hawaiian / Pacific Islander population 15 years and over
Males 100.0% Never married0.0% Now married0.0% Separated0.0% Widowed0.0% DivorcedFemales 0.0% Never married100.0% Now married0.0% Separated0.0% Widowed0.0% DivorcedWomen who did not give birth in the past 12 months Now married:
100.0% (14)Unmarried:
0.0% (0)
Marital status - Other race population 15 years and over
Males 58.0% Never married2.6% Now married0.0% Separated36.5% Widowed2.9% DivorcedFemales 59.2% Never married18.6% Now married8.5% Separated13.7% Widowed0.0% DivorcedWomen who did not give birth in the past 12 months Now married:
30.4% (99)Unmarried:
69.6% (227)
Marital status - Two or more races population 15 years and over
Males 59.3% Never married28.7% Now married2.9% Separated0.0% Widowed9.1% DivorcedFemales 49.9% Never married29.9% Now married0.0% Separated0.8% Widowed19.4% DivorcedWomen who did not give birth in the past 12 months Now married:
22.2% (189)Unmarried:
77.8% (660)
Marital status - White alone, not Hispanic / Latino population 15 years and over
Males 25.1% Never married43.1% Now married1.3% Separated8.1% Widowed22.4% DivorcedFemales 16.9% Never married38.8% Now married3.0% Separated14.6% Widowed26.7% DivorcedWomen who gave birth in the past 12 months Now married:
37.6% (49)Unmarried:
62.4% (81)
Women who did not give birth in the past 12 months Now married:
43.0% (682)Unmarried:
57.0% (904)
Marital status - Hispanic or Latino population 15 years and over
Males 43.0% Never married43.0% Now married1.0% Separated5.1% Widowed8.0% DivorcedFemales 36.6% Never married48.0% Now married7.6% Separated2.8% Widowed4.9% DivorcedWomen who gave birth in the past 12 months Now married:
18.4% (20)Unmarried:
81.6% (90)
Women who did not give birth in the past 12 months Now married:
53.4% (580)Unmarried:
46.6% (506)
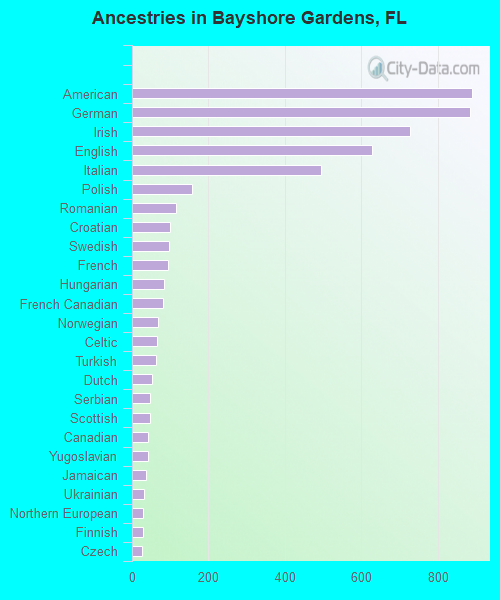
Ancestries in Bayshore Gardens
890 8.7% American885 8.7% German728 7.1% Irish628 6.2% English494 4.9% Italian157 1.5% Polish115 1.1% Romanian99 1.0% Croatian96 0.9% Swedish95 0.9% French84 0.8% Hungarian82 0.8% French Canadian67 0.7% Norwegian65 0.6% Celtic63 0.6% Turkish52 0.5% Dutch48 0.5% Serbian48 0.5% Scottish43 0.4% Canadian43 0.4% Yugoslavian36 0.4% Jamaican32 0.3% Ukrainian30 0.3% Northern European29 0.3% Finnish27 0.3% Czech22 0.2% Cajun21 0.2% Lebanese21 0.2% European18 0.2% Russian18 0.2% British West Indian17 0.2% Pennsylvania German14 0.1% Eastern European13 0.1% Belgian13 0.1% Swiss13 0.1% Brazilian10 0.10% British10 0.10% Barbadian9 0.09% Portuguese9 0.09% Scandinavian8 0.08% Luxembourger7 0.07% Welsh6 0.06% Danish
Geographical mobility in Bayshore Gardens Same house 1 year ago 12,871 91.3% White (Caucasian)1,320 74.4% Black or African American44 52.6% American Indian / Alaska Native79 100.0% Asian43 100.0% Native Hawaiian / Pacific Islander921 95.5% Other race2,393 88.3% Two or more races10,677 91.4% White alone, not Hispanic / Latino4,473 91.5% Hispanic or LatinoMoved within same county 458 3.2% White / Caucasian135 7.6% Black or African American32 37.9% American Indian / Alaska Native22 2.3% Other race60 2.2% Two or more races321 2.7% White alone, not Hispanic / Latino251 5.1% Hispanic or LatinoMoved within same state 185 1.3% White / Caucasian85 4.8% Black or African American21 2.2% Other race73 2.7% Two or more races154 1.3% White alone, not Hispanic / Latino69 1.4% Hispanic or LatinoMoved from different state 506 3.6% White / Caucasian185 10.4% Black or African American164 6.0% Two or more races512 4.4% White alone, not Hispanic / Latino31 0.6% Hispanic or LatinoMoved from abroad 46 0.3% White31 0.3% White alone, not Hispanic / Latino9 0.2% Hispanic or Latino
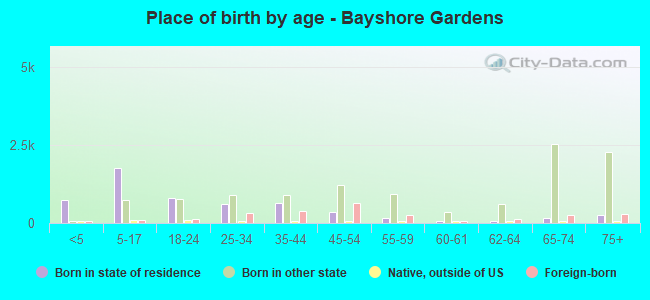
Children Nativity (place of birth) in Bayshore Gardens
Children under 6 years - Living with two parents Both parents native 396 100.0% NativeBoth parents foreign-born 21 100.0% NativeOne native, one foreign-born parent 41 100.0% NativeChildren under 6 years - Living with one parent Native parent 336 100.0% NativeChildren 6 to 17 years - Living with two parents Both parents native 820 100.0% NativeBoth parents foreign-born 458 100.0% NativeOne native, one foreign-born parent 89 100.0% NativeChildren 6 to 17 years - Living with one parent Native parent 838 100.0% NativeForeign-born parent 199 53.0% Native176 47.0% Foreign-born
Grandparents responsible for own grandchildren in Bayshore Gardens
Grandparents (30 to 59 years) White / Caucasian 50 33.1% Responsible for grandchildren101 66.9% Not responsible for grandchildrenOther race 59 100.0% Not responsible for grandchildrenTwo or more races 4 100.0% Responsible for grandchildrenWhite alone, not Hispanic / Latino 63 39.6% Responsible for grandchildren96 60.4% Not responsible for grandchildrenHispanic or Latino 67 100.0% Not responsible for grandchildrenGrandparents (60 years and over) White / Caucasian 41 52.8% Responsible for grandchildren37 47.2% Not responsible for grandchildrenWhite alone, not Hispanic / Latino 36 49.5% Responsible for grandchildren37 50.5% Not responsible for grandchildren