Races in Baytown, Texas (TX) Detailed Stats
Data:
Races - White alone (%)
Races - White alone (% change since 2000)
Races - Black alone (%)
Races - Black alone (% change since 2000)
Races - American Indian alone (%)
Races - American Indian alone (% change since 2000)
Races - Asian alone (%)
Races - Asian alone (% change since 2000)
Races - Hispanic (%)
Races - Hispanic (% change since 2000)
Races - Native Hawaiian and Other Pacific Islander alone (%)
Races - Native Hawaiian and Other Pacific Islander alone (% change since 2000)
Races - Two or more races(%)
Races - Two or more races(% change since 2000)
Races - Other race alone (%)
Races - Other race alone (% change since 2000)
Racial diversity
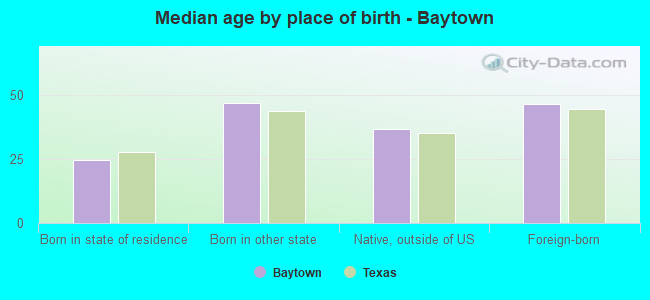
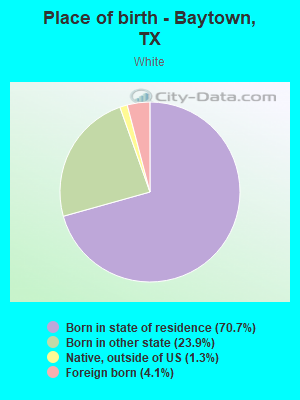
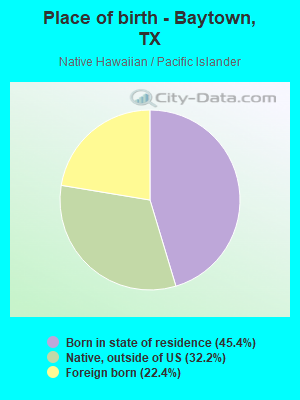
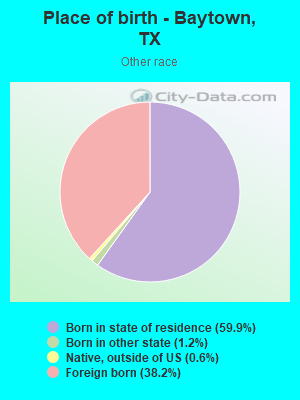
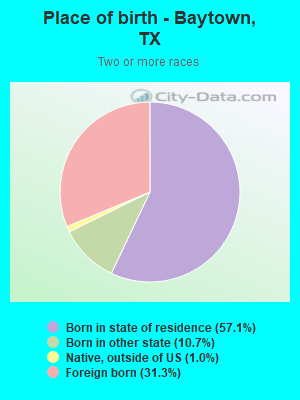
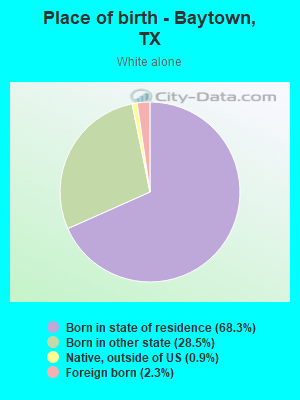
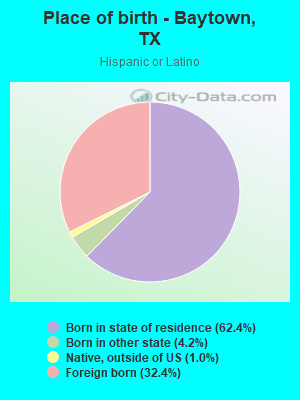
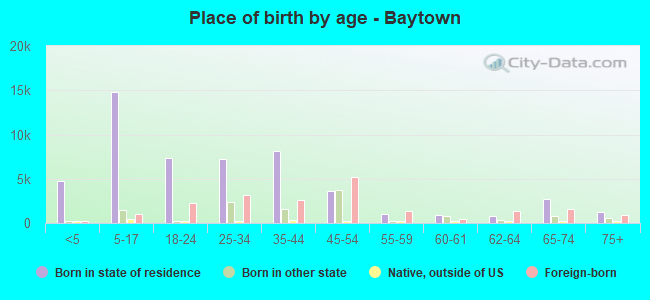
Place of birth - Born in state of residence (%)
Place of birth - Born in state of residence (%) - White
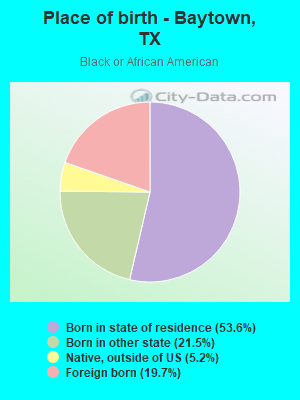
Place of birth - Born in state of residence (%) - Black or African American
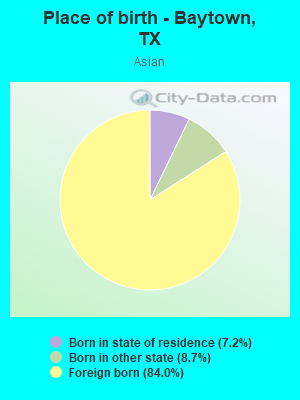
Place of birth - Born in state of residence (%) - Asian
Place of birth - Born in state of residence (%) - Hispanic or Latino
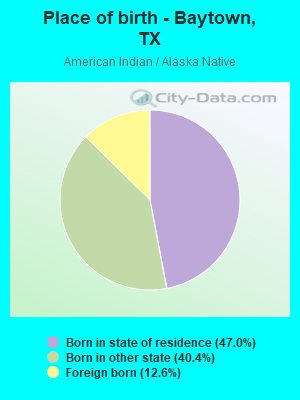
Place of birth - Born in state of residence (%) - American Indian and Alaska Native
Place of birth - Born in state of residence (%) - Multirace
Place of birth - Born in state of residence (%) - Other Race
Place of birth - Born in other state (%)
Place of birth - Born in other state (%) - White
Place of birth - Born in other state (%) - Black or African American
Place of birth - Born in other state (%) - Asian
Place of birth - Born in other state (%) - Hispanic or Latino
Place of birth - Born in other state (%) - American Indian and Alaska Native
Place of birth - Born in other state (%) - Multirace
Place of birth - Born in other state (%) - Other Race
Place of birth - Native, outside of US (%)
Place of birth - Native, outside of US (%) - White
Place of birth - Native, outside of US (%) - Black or African American
Place of birth - Native, outside of US (%) - Asian
Place of birth - Native, outside of US (%) - Hispanic or Latino
Place of birth - Native, outside of US (%) - American Indian and Alaska Native
Place of birth - Native, outside of US (%) - Multirace
Place of birth - Native, outside of US (%) - Other Race
Place of birth - Foreign born (%)
Place of birth - Foreign born (%) - White
Place of birth - Foreign born (%) - Black or African American
Place of birth - Foreign born (%) - Asian
Place of birth - Foreign born (%) - Hispanic or Latino
Place of birth - Foreign born (%) - American Indian and Alaska Native
Place of birth - Foreign born (%) - Multirace
Place of birth - Foreign born (%) - Other Race
Residents speaking English at home (%)
Residents speaking English at home - Born in the United States (%)
Residents speaking English at home - Native, born elsewhere (%)
Residents speaking English at home - Foreign born (%)
Residents speaking Spanish at home (%)
Residents speaking Spanish at home - Born in the United States (%)
Residents speaking Spanish at home - Native, born elsewhere (%)
Residents speaking Spanish at home - Foreign born (%)
Residents speaking other language at home (%)
Residents speaking other language at home - Born in the United States (%)
Residents speaking other language at home - Native, born elsewhere (%)
Residents speaking other language at home - Foreign born (%)
Marital status - Never married (%)
Marital status - Now married (%)
Marital status - Separated (%)
Marital status - Widowed (%)
Marital status - Divorced (%)
Ancestries Reported - Arab (%)
Ancestries Reported - Czech (%)
Ancestries Reported - Danish (%)
Ancestries Reported - Dutch (%)
Ancestries Reported - English (%)
Ancestries Reported - French (%)
Ancestries Reported - French Canadian (%)
Ancestries Reported - German (%)
Ancestries Reported - Greek (%)
Ancestries Reported - Hungarian (%)
Ancestries Reported - Irish (%)
Ancestries Reported - Italian (%)
Ancestries Reported - Lithuanian (%)
Ancestries Reported - Norwegian (%)
Ancestries Reported - Polish (%)
Ancestries Reported - Portuguese (%)
Ancestries Reported - Russian (%)
Ancestries Reported - Scotch-Irish (%)
Ancestries Reported - Scottish (%)
Ancestries Reported - Slovak (%)
Ancestries Reported - Subsaharan African (%)
Ancestries Reported - Swedish (%)
Ancestries Reported - Swiss (%)
Ancestries Reported - Ukrainian (%)
Ancestries Reported - United States (%)
Ancestries Reported - Welsh (%)
Ancestries Reported - West Indian (%)
Ancestries Reported - Other (%)
Geographical mobility - Same house 1 year ago (%)
Geographical mobility - Same house 1 year ago (%) - White
Geographical mobility - Same house 1 year ago (%) - Black or African American
Geographical mobility - Same house 1 year ago (%) - Asian
Geographical mobility - Same house 1 year ago (%) - Hispanic or Latino
Geographical mobility - Same house 1 year ago (%) - American Indian and Alaska Native
Geographical mobility - Same house 1 year ago (%) - Multirace
Geographical mobility - Same house 1 year ago (%) - Other Race
Geographical mobility - Moved within same county (%)
Geographical mobility - Moved within same county (%) - White
Geographical mobility - Moved within same county (%) - Black or African American
Geographical mobility - Moved within same county (%) - Asian
Geographical mobility - Moved within same county (%) - Hispanic or Latino
Geographical mobility - Moved within same county (%) - American Indian and Alaska Native
Geographical mobility - Moved within same county (%) - Multirace
Geographical mobility - Moved within same county (%) - Other Race
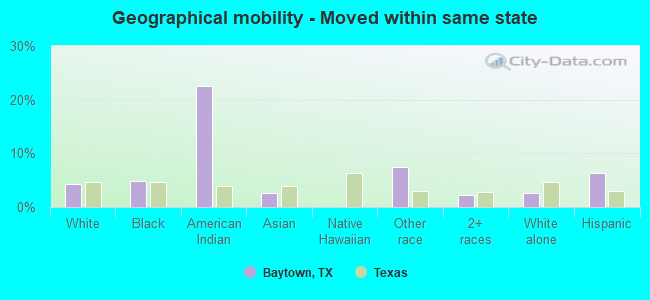
Geographical mobility - Moved from different county within same state (%)
Geographical mobility - Moved from different county within same state (%) - White
Geographical mobility - Moved from different county within same state (%) - Black or African American
Geographical mobility - Moved from different county within same state (%) - Asian
Geographical mobility - Moved from different county within same state (%) - Hispanic or Latino
Geographical mobility - Moved from different county within same state (%) - American Indian and Alaska Native
Geographical mobility - Moved from different county within same state (%) - Multirace
Geographical mobility - Moved from different county within same state (%) - Other Race
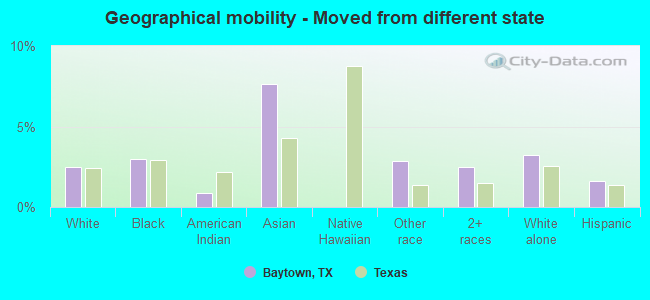
Geographical mobility - Moved from different state (%)
Geographical mobility - Moved from different state (%) - White
Geographical mobility - Moved from different state (%) - Black or African American
Geographical mobility - Moved from different state (%) - Asian
Geographical mobility - Moved from different state (%) - Hispanic or Latino
Geographical mobility - Moved from different state (%) - American Indian and Alaska Native
Geographical mobility - Moved from different state (%) - Multirace
Geographical mobility - Moved from different state (%) - Other Race
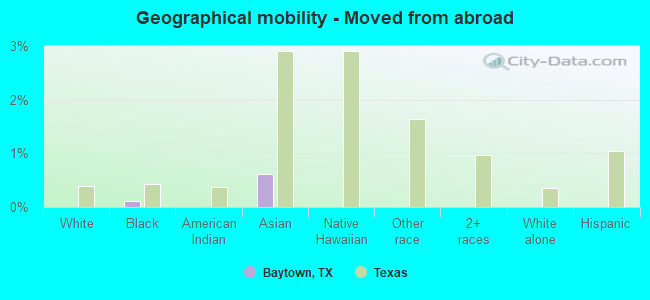
Geographical mobility - Moved from abroad (%)
Geographical mobility - Moved from abroad (%) - White
Geographical mobility - Moved from abroad (%) - Black or African American
Geographical mobility - Moved from abroad (%) - Asian
Geographical mobility - Moved from abroad (%) - Hispanic or Latino
Geographical mobility - Moved from abroad (%) - American Indian and Alaska Native
Geographical mobility - Moved from abroad (%) - Multirace
Geographical mobility - Moved from abroad (%) - Other Race
Place of birth for the foreign-born population - Ireland (%)
Place of birth for the foreign-born population - Denmark (%)
Place of birth for the foreign-born population - Norway (%)
Place of birth for the foreign-born population - Sweden (%)
Place of birth for the foreign-born population - United Kingdom (%)
Place of birth for the foreign-born population - England (%)
Place of birth for the foreign-born population - Scotland (%)
Place of birth for the foreign-born population - Other Northern Europe (%)
Place of birth for the foreign-born population - Austria (%)
Place of birth for the foreign-born population - Belgium (%)
Place of birth for the foreign-born population - France (%)
Place of birth for the foreign-born population - Germany (%)
Place of birth for the foreign-born population - Netherlands (%)
Place of birth for the foreign-born population - Switzerland (%)
Place of birth for the foreign-born population - Other Western Europe (%)
Place of birth for the foreign-born population - Greece (%)
Place of birth for the foreign-born population - Italy (%)
Place of birth for the foreign-born population - Portugal (%)
Place of birth for the foreign-born population - Spain (%)
Place of birth for the foreign-born population - Other Southern Europe (%)
Place of birth for the foreign-born population - Albania (%)
Place of birth for the foreign-born population - Belarus (%)
Place of birth for the foreign-born population - Bosnia and Herzegovina (%)
Place of birth for the foreign-born population - Bulgaria (%)
Place of birth for the foreign-born population - Croatia (%)
Place of birth for the foreign-born population - Czechoslovakia (%)
Place of birth for the foreign-born population - Hungary (%)
Place of birth for the foreign-born population - Latvia (%)
Place of birth for the foreign-born population - Lithuania (%)
Place of birth for the foreign-born population - North Macedonia (Macedonia) (%)
Place of birth for the foreign-born population - Moldova (%)
Place of birth for the foreign-born population - Poland (%)
Place of birth for the foreign-born population - Romania (%)
Place of birth for the foreign-born population - Russia (%)
Place of birth for the foreign-born population - Serbia (%)
Place of birth for the foreign-born population - Ukraine (%)
Place of birth for the foreign-born population - Other Eastern Europe (%)
Place of birth for the foreign-born population - China (%)
Place of birth for the foreign-born population - Hong Kong (%)
Place of birth for the foreign-born population - Taiwan (%)
Place of birth for the foreign-born population - Japan (%)
Place of birth for the foreign-born population - Korea (%)
Place of birth for the foreign-born population - Other Eastern Asia (%)
Place of birth for the foreign-born population - Afghanistan (%)
Place of birth for the foreign-born population - Bangladesh (%)
Place of birth for the foreign-born population - India (%)
Place of birth for the foreign-born population - Iran (%)
Place of birth for the foreign-born population - Kazakhstan (%)
Place of birth for the foreign-born population - Nepal (%)
Place of birth for the foreign-born population - Pakistan (%)
Place of birth for the foreign-born population - Sri Lanka (%)
Place of birth for the foreign-born population - Uzbekistan (%)
Place of birth for the foreign-born population - Other South Central Asia (%)
Place of birth for the foreign-born population - Burma (%)
Place of birth for the foreign-born population - Cambodia (%)
Place of birth for the foreign-born population - Indonesia (%)
Place of birth for the foreign-born population - Laos (%)
Place of birth for the foreign-born population - Malaysia (%)
Place of birth for the foreign-born population - Philippines (%)
Place of birth for the foreign-born population - Singapore (%)
Place of birth for the foreign-born population - Thailand (%)
Place of birth for the foreign-born population - Vietnam (%)
Place of birth for the foreign-born population - Other South Eastern Asia (%)
Place of birth for the foreign-born population - Armenia (%)
Place of birth for the foreign-born population - Iraq (%)
Place of birth for the foreign-born population - Israel (%)
Place of birth for the foreign-born population - Jordan (%)
Place of birth for the foreign-born population - Kuwait (%)
Place of birth for the foreign-born population - Lebanon (%)
Place of birth for the foreign-born population - Saudi Arabia (%)
Place of birth for the foreign-born population - Syria (%)
Place of birth for the foreign-born population - Turkey (%)
Place of birth for the foreign-born population - Yemen (%)
Place of birth for the foreign-born population - Other Western Asia (%)
Place of birth for the foreign-born population - Eritrea (%)
Place of birth for the foreign-born population - Ethiopia (%)
Place of birth for the foreign-born population - Kenya (%)
Place of birth for the foreign-born population - Somalia (%)
Place of birth for the foreign-born population - Uganda (%)
Place of birth for the foreign-born population - Zimbabwe (%)
Place of birth for the foreign-born population - Other Eastern Africa (%)
Place of birth for the foreign-born population - Cameroon (%)
Place of birth for the foreign-born population - Congo (%)
Place of birth for the foreign-born population - Democratic Republic of Congo (Zaire) (%)
Place of birth for the foreign-born population - Other Middle Africa (%)
Place of birth for the foreign-born population - Egypt (%)
Place of birth for the foreign-born population - Morocco (%)
Place of birth for the foreign-born population - Sudan (%)
Place of birth for the foreign-born population - Other Northern Africa (%)
Place of birth for the foreign-born population - South Africa (%)
Place of birth for the foreign-born population - Other Southern Africa (%)
Place of birth for the foreign-born population - Cabo Verde (%)
Place of birth for the foreign-born population - Ghana (%)
Place of birth for the foreign-born population - Liberia (%)
Place of birth for the foreign-born population - Nigeria (%)
Place of birth for the foreign-born population - Senegal (%)
Place of birth for the foreign-born population - Sierra Leone (%)
Place of birth for the foreign-born population - Other Western Africa (%)
Place of birth for the foreign-born population - Australia (%)
Place of birth for the foreign-born population - New Zealand (%)
Place of birth for the foreign-born population - Fiji (%)
Place of birth for the foreign-born population - Micronesia (%)
Place of birth for the foreign-born population - Bahamas (%)
Place of birth for the foreign-born population - Barbados (%)
Place of birth for the foreign-born population - Cuba (%)
Place of birth for the foreign-born population - Dominica (%)
Place of birth for the foreign-born population - Dominican Republic (%)
Place of birth for the foreign-born population - Grenada (%)
Place of birth for the foreign-born population - Haiti (%)
Place of birth for the foreign-born population - Jamaica (%)
Place of birth for the foreign-born population - St. Vincent and the Grenadines (%)
Place of birth for the foreign-born population - Trinidad and Tobago (%)
Place of birth for the foreign-born population - West Indies (%)
Place of birth for the foreign-born population - Other Caribbean (%)
Place of birth for the foreign-born population - Belize (%)
Place of birth for the foreign-born population - Costa Rica (%)
Place of birth for the foreign-born population - El Salvador (%)
Place of birth for the foreign-born population - Guatemala (%)
Place of birth for the foreign-born population - Honduras (%)
Place of birth for the foreign-born population - Mexico (%)
Place of birth for the foreign-born population - Nicaragua (%)
Place of birth for the foreign-born population - Panama (%)
Place of birth for the foreign-born population - Other Central America (%)
Place of birth for the foreign-born population - Argentina (%)
Place of birth for the foreign-born population - Bolivia (%)
Place of birth for the foreign-born population - Brazil (%)
Place of birth for the foreign-born population - Chile (%)
Place of birth for the foreign-born population - Colombia (%)
Place of birth for the foreign-born population - Ecuador (%)
Place of birth for the foreign-born population - Guyana (%)
Place of birth for the foreign-born population - Peru (%)
Place of birth for the foreign-born population - Uruguay (%)
Place of birth for the foreign-born population - Venezuela (%)
Place of birth for the foreign-born population - Other South America (%)
Place of birth for the foreign-born population - Canada (%)
Place of birth for the foreign-born population - Other Northern America (%)
Place of birth for the foreign-born population - Other (%)
Latest news about races in Baytown, TX collected exclusively by city-data.com from local newspapers, TV, and radio stations
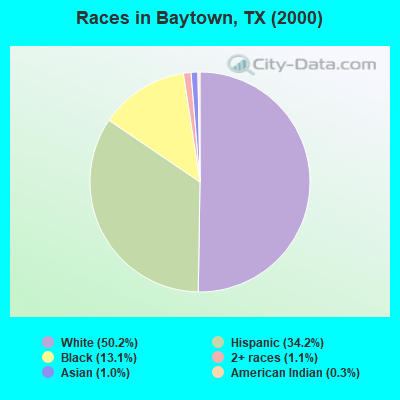
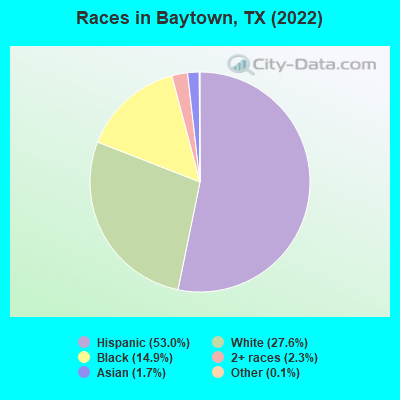
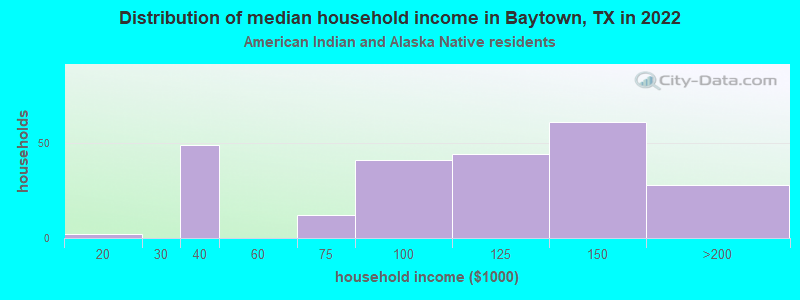
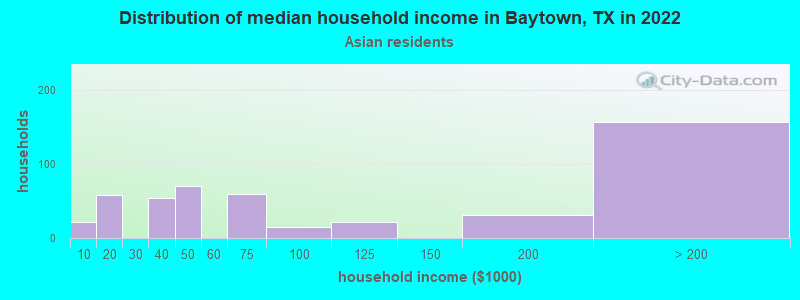
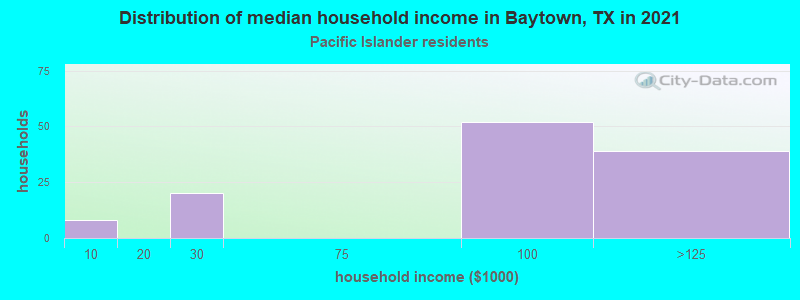
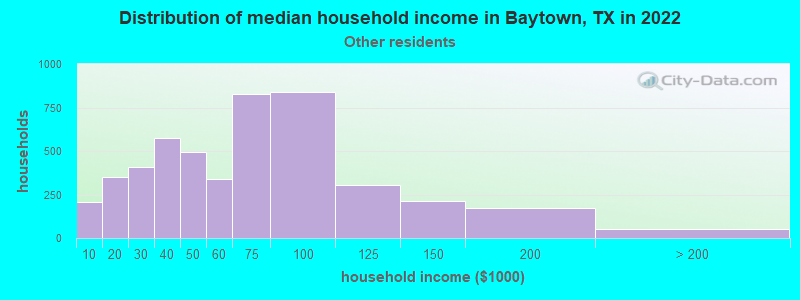
According to 2022 data, the most numerous races in Baytown, TX are Hispanic (45,298 residents), White alone (23,574 residents), and Black alone (12,741 residents). 54.8% of Baytown residents speak English at home. 21.0% of Baytown, TX residents are foreign-born (18.6% born in Latin America), which is 19.2% greater than the foreign-born rate of 17.0% across the entire state of Texas.
Race distribution in Baytown
2000 2022
10,933,313 52.4% White alone 6,669,666 32.0% Hispanic 2,364,255 11.3% Black alone 554,445 2.7% Asian alone 230,567 1.1% Two or more races 68,859 0.3% American Indian alone 19,958 0.10% Other race alone 10,757 0.05% Native Hawaiian and Other
12,070,642 40.2% Hispanic 11,683,430 38.9% White alone 3,508,706 11.7% Black alone 1,608,173 5.4% Asian alone 956,560 3.2% Two or more races 125,763 0.4% Other race alone 47,023 0.2% American Indian alone 29,275 0.10% Native Hawaiian and Other
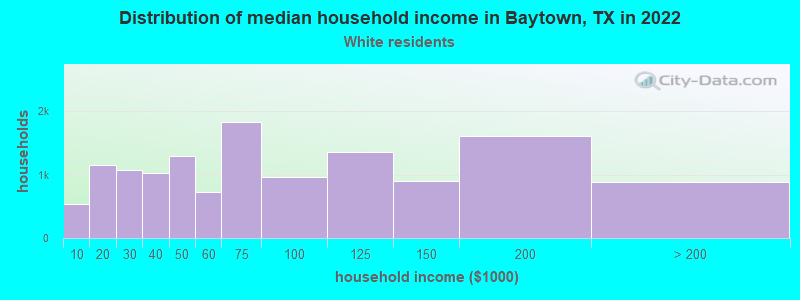
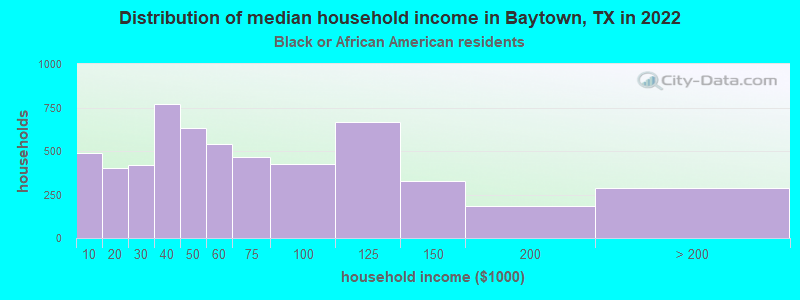
Income and house value in Baytown Median household income in 2022 $70,778 White non-Hispanic householders$34,886 Black householders$67,749 Some other race householders$58,691 Two or more races householders$63,487 Hispanic or Latino race householdersMedian 2022 house value $264,069 White Non-Hispanic householders$198,408 Black or African American householders$274,774 American Indian or Alaska Native householders $245,869 Asian householders$164,864 Some other race householders$162,010 Two or more races householders$163,794 Hispanic or Latino householders
Median age by race in Baytown
34.6 Median age for White residents33.8 37.0 35.1 Median age for Black or African American residents30.9 35.9 28.9 Median age for American Indian / Alaska Native residents-666,666,666.0 -666,666,666.0 45.2 Median age for Asian residents37.0 45.5 -666,666,666.0 Median age for Native Hawaiian / Pacific Islander residents-666,666,666.0 -666,666,666.0 26.6 Median age for Other race residents26.2 27.5 29.3 Median age for Two or more races residents25.4 33.9 38.2 Median age for White alone residents36.3 39.6 27.4 Median age for Hispanic or Latino residents26.3 28.9
Owner/renter occupied households by race in Baytown
House owners and renters - White residents 6,052 45.3% Owner occupied7,297 54.7% Renter occupiedHouse owners and renters - Black or African American residents 1,248 20.7% Owner occupied4,768 79.3% Renter occupiedHouse owners and renters - American Indian / Alaska Native residents 116 37.5% Owner occupied192 62.5% Renter occupiedHouse owners and renters - Asian residents 311 62.5% Owner occupied186 37.5% Renter occupiedHouse owners and renters - Native Hawaiian / Pacific Islander residents 129 100.0% Renter occupiedHouse owners and renters - Other race residents 4,652 58.3% Owner occupied3,329 41.7% Renter occupiedHouse owners and renters - Two or more races residents 3,466 75.1% Owner occupied1,151 24.9% Renter occupiedHouse owners and renters - White alone residents 4,565 44.6% Owner occupied5,675 55.4% Renter occupiedHouse owners and renters - Hispanic or Latino residents 9,448 63.9% Owner occupied5,333 36.1% Renter occupied
Language usage in Baytown
English speakers - Total 54.8% of residents of Baytown speak English at home.
40.4% of residents speak Spanish at home 20,822 63.4% Speak English very well11,998 36.6% Speak English less than very well4.8% of residents speak other language at home 2,988 76.5% Speak English very well916 23.5% Speak English less than very well
English speakers - Born in the United States 92.1% of residents of Baytown speak English at home.
7.9% of residents speak Spanish at home 969 100.0% Speak English very well
English speakers - Native, born elsewhere 63.4% of residents of Baytown speak English at home.
27.6% of residents speak Spanish at home 360 100.0% Speak English very well9.0% of residents speak other language at home 118 100.0% Speak English very well
English speakers - Foreign-born 10.8% of residents of Baytown speak English at home.
73.3% of residents speak Spanish at home 4,927 33.9% Speak English very well9,591 66.1% Speak English less than very well15.9% of residents speak other language at home 2,229 70.9% Speak English very well916 29.1% Speak English less than very well
White (Caucasian) - Speak only English Native:
91.1% (26,391)Foreign-born:
15.6% (208)
White (Caucasian) - Speak another language Native:
8.9% (2,580)Foreign-born:
84.4% (1,125)
Black or African American - Speak only English Native:
96.0% (10,477)Foreign-born:
42.4% (486)
Black or African American - Speak another language Native:
3.9% (427)Foreign-born:
55.8% (638)
American Indian / Alaska Native - Speak another language Native:
48.8% (194)Foreign-born:
98.9% (56)
Asian - Speak only English Native:
39.9% (79)Foreign-born:
6.8% (83)
Asian - Speak another language Native:
60.0% (119)Foreign-born:
93.2% (1,146)
Native Hawaiian / Pacific Islander - Speak only English Native:
98.9% (133)Foreign-born:
51.5% (8)
Other race - Speak only English Native:
26.0% (3,860)Foreign-born:
2.3% (220)
Other race - Speak another language Native:
74.0% (11,013)Foreign-born:
97.7% (9,477)
Two or more races - Speak only English Native:
41.3% (3,732)Foreign-born:
7.5% (347)
Two or more races - Speak another language Native:
58.7% (5,313)Foreign-born:
92.5% (4,256)
White alone - Speak only English Native:
96.0% (21,575)Foreign-born:
38.4% (147)
White alone - Speak another language Native:
4.0% (891)Foreign-born:
61.8% (237)
Hispanic or Latino - Speak only English Native:
36.5% (10,527)Foreign-born:
3.2% (477)
Hispanic or Latino - Speak another language Native:
63.5% (18,280)Foreign-born:
96.8% (14,455)
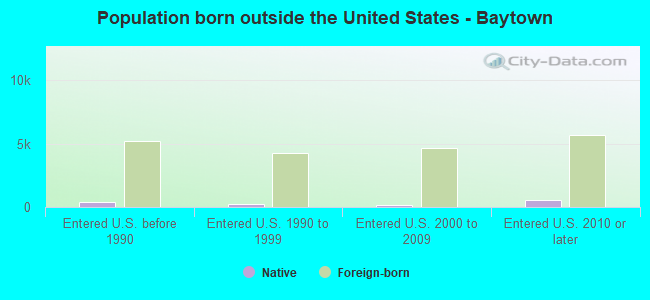
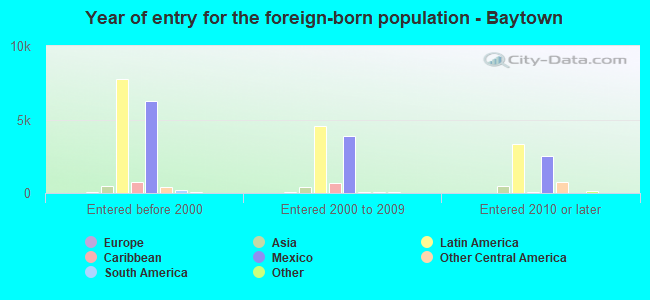
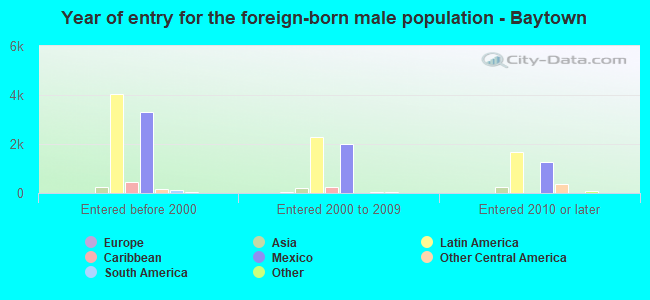
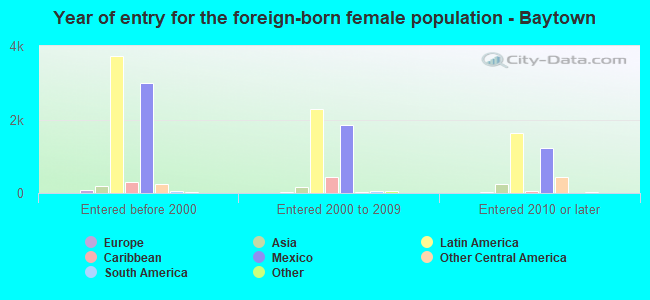
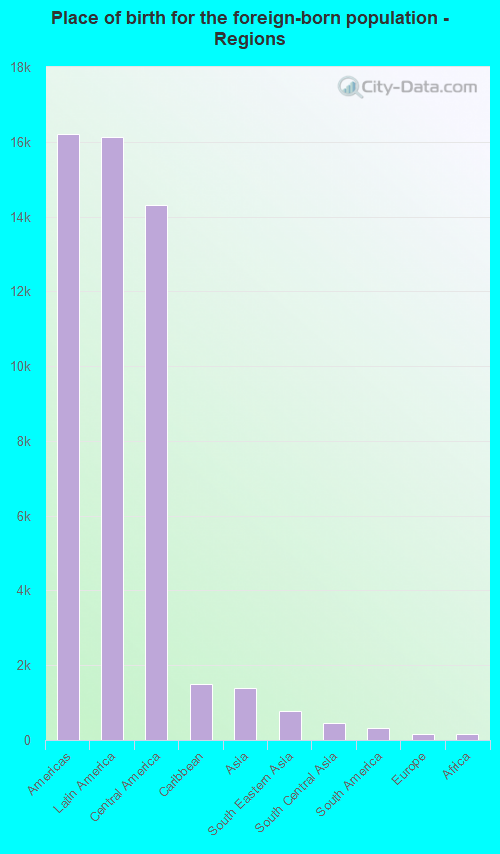
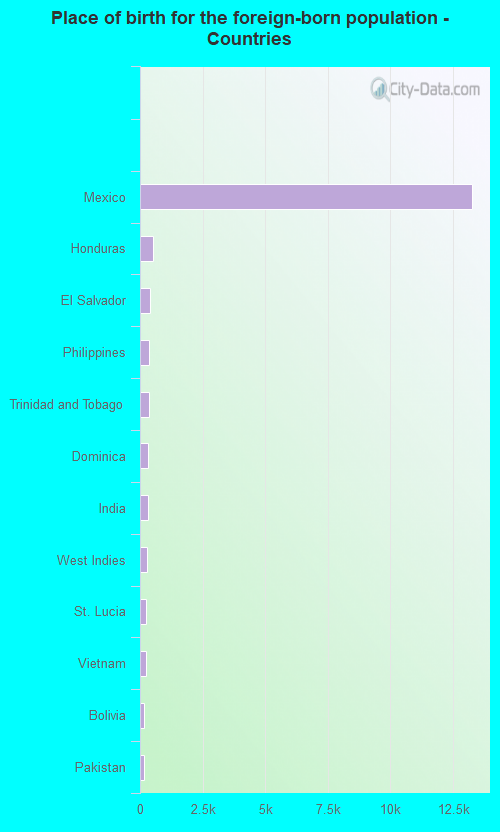
Foreign-born residents in Baytown 17,967 residents are foreign born (18.6% Latin America ).
This city:
21.0%Texas:
17.1%
Marital status for residents in Baytown Marital status - White (Caucasian) population 15 years and over
Males 37.5% Never married47.2% Now married1.6% Separated1.3% Widowed12.4% DivorcedFemales 24.2% Never married46.0% Now married10.8% Separated6.6% Widowed12.4% DivorcedWomen who gave birth in the past 12 months Now married:
100.0% (365)Unmarried:
0.0% (0)
Women who did not give birth in the past 12 months Now married:
56.3% (3,736)Unmarried:
43.7% (2,905)
Marital status - Black or African American population 15 years and over
Males 60.4% Never married23.3% Now married1.9% Separated0.0% Widowed14.4% DivorcedFemales 48.0% Never married22.2% Now married2.6% Separated7.3% Widowed20.0% DivorcedWomen who gave birth in the past 12 months Now married:
48.3% (128)Unmarried:
51.7% (137)
Women who did not give birth in the past 12 months Now married:
27.9% (882)Unmarried:
72.1% (2,283)
Marital status - American Indian / Alaska Native population 15 years and over
Males 60.9% Never married39.1% Now married0.0% Separated0.0% Widowed0.0% DivorcedFemales 29.1% Never married67.7% Now married0.0% Separated3.2% Widowed0.0% DivorcedWomen who did not give birth in the past 12 months Now married:
0.0% (0)Unmarried:
100.0% (101)
Marital status - Asian population 15 years and over
Males 25.1% Never married59.8% Now married1.5% Separated6.4% Widowed7.1% DivorcedFemales 12.4% Never married78.9% Now married0.0% Separated6.2% Widowed2.5% DivorcedWomen who did not give birth in the past 12 months Now married:
74.1% (221)Unmarried:
25.9% (77)
Marital status - Native Hawaiian / Pacific Islander population 15 years and over
Males 87.5% Never married12.5% Now married0.0% Separated0.0% Widowed0.0% DivorcedFemales 0.0% Never married0.0% Now married0.0% Separated100.0% Widowed0.0% DivorcedWomen who did not give birth in the past 12 months Now married:
0.0% (0)Unmarried:
100.0% (16)
Marital status - Other race population 15 years and over
Males 50.4% Never married38.3% Now married1.3% Separated0.0% Widowed10.0% DivorcedFemales 44.7% Never married37.8% Now married8.3% Separated5.7% Widowed3.5% DivorcedWomen who gave birth in the past 12 months Now married:
35.4% (137)Unmarried:
64.6% (250)
Women who did not give birth in the past 12 months Now married:
39.1% (2,534)Unmarried:
60.9% (3,954)
Marital status - Two or more races population 15 years and over
Males 54.9% Never married36.4% Now married5.7% Separated0.3% Widowed2.8% DivorcedFemales 33.0% Never married47.5% Now married2.5% Separated2.5% Widowed14.5% DivorcedWomen who gave birth in the past 12 months Now married:
96.5% (205)Unmarried:
3.5% (7)
Women who did not give birth in the past 12 months Now married:
43.2% (1,895)Unmarried:
56.8% (2,488)
Marital status - White alone, not Hispanic / Latino population 15 years and over
Males 32.4% Never married50.8% Now married2.1% Separated1.6% Widowed13.1% DivorcedFemales 26.3% Never married45.1% Now married6.6% Separated6.8% Widowed15.2% DivorcedWomen who gave birth in the past 12 months Now married:
52.0% (99)Unmarried:
48.0% (91)
Women who did not give birth in the past 12 months Now married:
41.4% (1,852)Unmarried:
58.6% (2,619)
Marital status - Hispanic or Latino population 15 years and over
Males 52.5% Never married38.1% Now married1.5% Separated0.0% Widowed7.9% DivorcedFemales 39.1% Never married40.9% Now married8.9% Separated4.7% Widowed6.3% DivorcedWomen who gave birth in the past 12 months Now married:
67.5% (594)Unmarried:
32.5% (286)
Women who did not give birth in the past 12 months Now married:
42.7% (4,910)Unmarried:
57.3% (6,581)
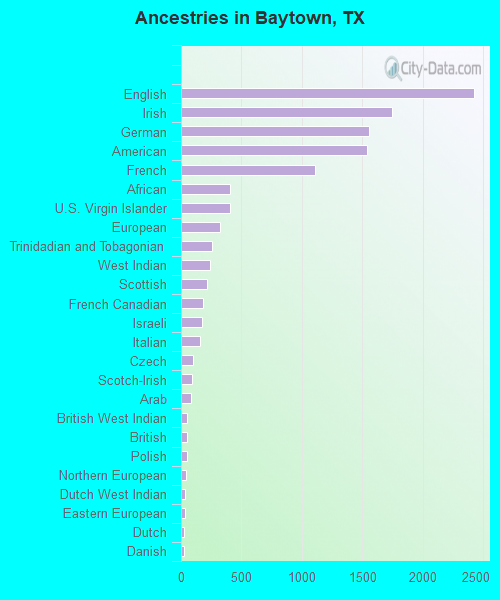
Ancestries in Baytown
2,428 4.5% English1,749 3.3% Irish1,559 2.9% German1,539 2.9% American1,112 2.1% French406 0.8% African403 0.8% U.S. Virgin Islander325 0.6% European258 0.5% Trinidadian and Tobagonian240 0.4% West Indian213 0.4% Scottish185 0.3% French Canadian171 0.3% Israeli161 0.3% Italian100 0.2% Czech89 0.2% Scotch-Irish83 0.2% Arab51 0.09% British West Indian49 0.09% British48 0.09% Polish44 0.08% Northern European33 0.06% Dutch West Indian30 0.06% Eastern European26 0.05% Dutch23 0.04% Danish23 0.04% Nigerian23 0.04% Welsh22 0.04% Greek20 0.04% Latvian18 0.03% Swedish16 0.03% Estonian14 0.03% Ukrainian11 0.02% Croatian10 0.02% Norwegian
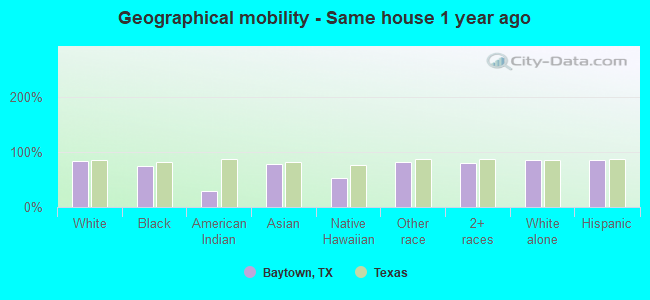
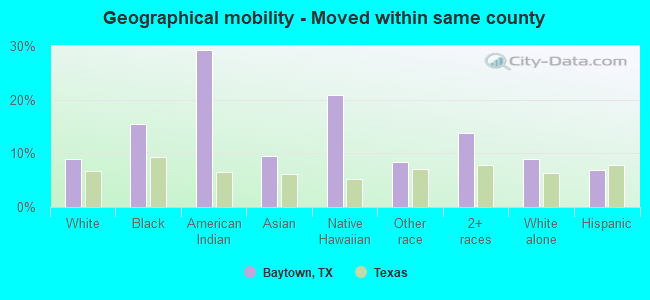
Geographical mobility in Baytown Same house 1 year ago 27,321 84.3% White (Caucasian)9,791 75.6% Black or African American156 29.4% American Indian / Alaska Native1,189 79.1% Asian78 52.0% Native Hawaiian / Pacific Islander20,517 81.4% Other race15,145 79.8% Two or more races21,384 85.3% White alone, not Hispanic / Latino38,998 85.1% Hispanic or LatinoMoved within same county 2,887 8.9% White / Caucasian1,996 15.4% Black or African American155 29.2% American Indian / Alaska Native144 9.6% Asian31 20.8% Native Hawaiian / Pacific Islander2,096 8.3% Other race2,609 13.8% Two or more races2,242 8.9% White alone, not Hispanic / Latino3,158 6.9% Hispanic or LatinoMoved within same state 1,397 4.3% White / Caucasian626 4.8% Black or African American120 22.5% American Indian / Alaska Native40 2.6% Asian1,866 7.4% Other race428 2.3% Two or more races634 2.5% White alone, not Hispanic / Latino2,927 6.4% Hispanic or LatinoMoved from different state 813 2.5% White / Caucasian382 3.0% Black or African American5 0.9% American Indian / Alaska Native115 7.7% Asian722 2.9% Other race466 2.5% Two or more races813 3.2% White alone, not Hispanic / Latino738 1.6% Hispanic or LatinoMoved from abroad 15 0.1% Black or African American9 0.6% Asian
Children Nativity (place of birth) in Baytown
Children under 6 years - Living with two parents Both parents native 1,756 100.0% NativeBoth parents foreign-born 379 100.0% NativeOne native, one foreign-born parent 421 100.0% NativeChildren under 6 years - Living with one parent Native parent 1,896 100.0% NativeForeign-born parent 840 93.9% Native55 6.1% Foreign-bornChildren 6 to 17 years - Living with two parents Both parents native 5,270 100.0% NativeBoth parents foreign-born 3,652 97.8% Native84 2.2% Foreign-bornOne native, one foreign-born parent 876 100.0% NativeChildren 6 to 17 years - Living with one parent Native parent 4,145 100.0% NativeForeign-born parent 756 62.1% Native461 37.9% Foreign-born
Grandparents responsible for own grandchildren in Baytown
Grandparents (30 to 59 years) White / Caucasian 255 62.6% Responsible for grandchildren153 37.4% Not responsible for grandchildrenBlack or African American 35 39.4% Responsible for grandchildren54 60.6% Not responsible for grandchildrenAsian 47 67.9% Responsible for grandchildren22 32.1% Not responsible for grandchildrenNative Hawaiian / Pacific Islander 12 100.0% Not responsible for grandchildrenOther race 19 8.5% Responsible for grandchildren206 91.5% Not responsible for grandchildrenTwo or more races 28 15.3% Responsible for grandchildren155 84.7% Not responsible for grandchildrenWhite alone, not Hispanic / Latino 238 65.9% Responsible for grandchildren123 34.1% Not responsible for grandchildrenHispanic or Latino 218 33.9% Responsible for grandchildren425 66.1% Not responsible for grandchildrenGrandparents (60 years and over) White / Caucasian 206 52.0% Responsible for grandchildren190 48.0% Not responsible for grandchildrenBlack or African American 99 65.0% Responsible for grandchildren53 35.0% Not responsible for grandchildrenOther race 78 80.6% Responsible for grandchildren19 19.4% Not responsible for grandchildrenTwo or more races 87 39.8% Responsible for grandchildren132 60.2% Not responsible for grandchildrenWhite alone, not Hispanic / Latino 213 51.8% Responsible for grandchildren198 48.2% Not responsible for grandchildrenHispanic or Latino 185 45.3% Responsible for grandchildren224 54.7% Not responsible for grandchildren