Races in Beaufort, South Carolina (SC) Detailed Stats
Data:
Races - White alone (%)
Races - White alone (% change since 2000)
Races - Black alone (%)
Races - Black alone (% change since 2000)
Races - American Indian alone (%)
Races - American Indian alone (% change since 2000)
Races - Asian alone (%)
Races - Asian alone (% change since 2000)
Races - Hispanic (%)
Races - Hispanic (% change since 2000)
Races - Native Hawaiian and Other Pacific Islander alone (%)
Races - Native Hawaiian and Other Pacific Islander alone (% change since 2000)
Races - Two or more races(%)
Races - Two or more races(% change since 2000)
Races - Other race alone (%)
Races - Other race alone (% change since 2000)
Racial diversity
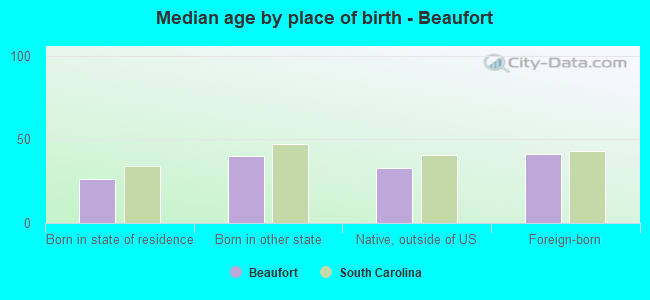
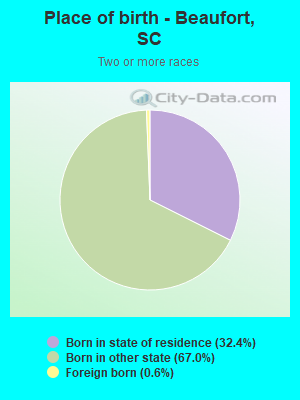
Place of birth - Born in state of residence (%)
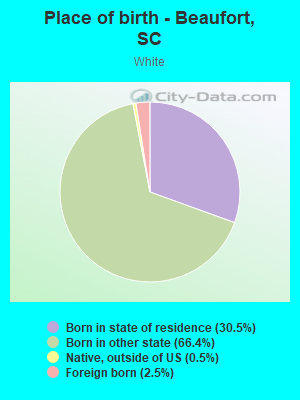
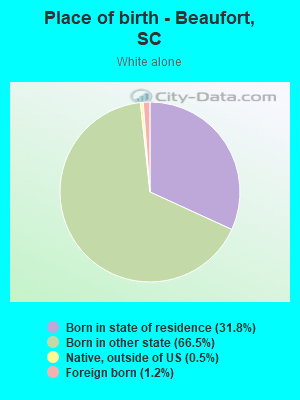
Place of birth - Born in state of residence (%) - White
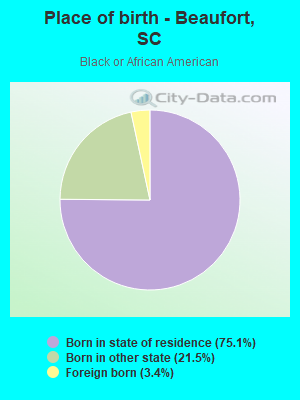
Place of birth - Born in state of residence (%) - Black or African American
Place of birth - Born in state of residence (%) - Asian
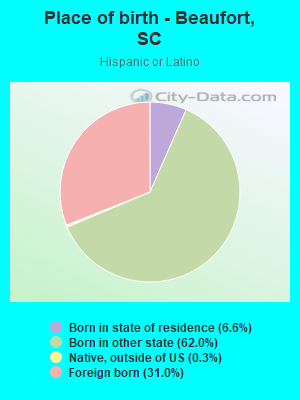
Place of birth - Born in state of residence (%) - Hispanic or Latino
Place of birth - Born in state of residence (%) - American Indian and Alaska Native
Place of birth - Born in state of residence (%) - Multirace
Place of birth - Born in state of residence (%) - Other Race
Place of birth - Born in other state (%)
Place of birth - Born in other state (%) - White
Place of birth - Born in other state (%) - Black or African American
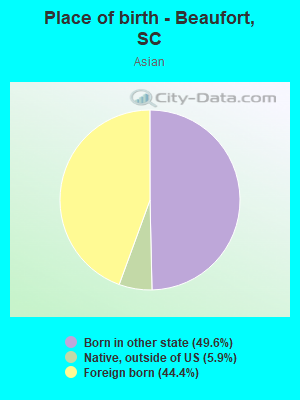
Place of birth - Born in other state (%) - Asian
Place of birth - Born in other state (%) - Hispanic or Latino
Place of birth - Born in other state (%) - American Indian and Alaska Native
Place of birth - Born in other state (%) - Multirace
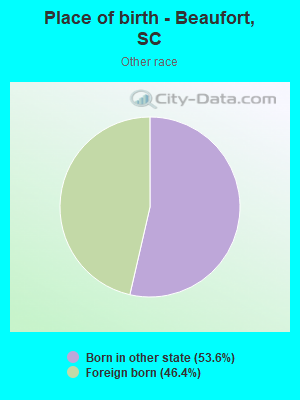
Place of birth - Born in other state (%) - Other Race
Place of birth - Native, outside of US (%)
Place of birth - Native, outside of US (%) - White
Place of birth - Native, outside of US (%) - Black or African American
Place of birth - Native, outside of US (%) - Asian
Place of birth - Native, outside of US (%) - Hispanic or Latino
Place of birth - Native, outside of US (%) - American Indian and Alaska Native
Place of birth - Native, outside of US (%) - Multirace
Place of birth - Native, outside of US (%) - Other Race
Place of birth - Foreign born (%)
Place of birth - Foreign born (%) - White
Place of birth - Foreign born (%) - Black or African American
Place of birth - Foreign born (%) - Asian
Place of birth - Foreign born (%) - Hispanic or Latino
Place of birth - Foreign born (%) - American Indian and Alaska Native
Place of birth - Foreign born (%) - Multirace
Place of birth - Foreign born (%) - Other Race
Residents speaking English at home (%)
Residents speaking English at home - Born in the United States (%)
Residents speaking English at home - Native, born elsewhere (%)
Residents speaking English at home - Foreign born (%)
Residents speaking Spanish at home (%)
Residents speaking Spanish at home - Born in the United States (%)
Residents speaking Spanish at home - Native, born elsewhere (%)
Residents speaking Spanish at home - Foreign born (%)
Residents speaking other language at home (%)
Residents speaking other language at home - Born in the United States (%)
Residents speaking other language at home - Native, born elsewhere (%)
Residents speaking other language at home - Foreign born (%)
Marital status - Never married (%)
Marital status - Now married (%)
Marital status - Separated (%)
Marital status - Widowed (%)
Marital status - Divorced (%)
Ancestries Reported - Arab (%)
Ancestries Reported - Czech (%)
Ancestries Reported - Danish (%)
Ancestries Reported - Dutch (%)
Ancestries Reported - English (%)
Ancestries Reported - French (%)
Ancestries Reported - French Canadian (%)
Ancestries Reported - German (%)
Ancestries Reported - Greek (%)
Ancestries Reported - Hungarian (%)
Ancestries Reported - Irish (%)
Ancestries Reported - Italian (%)
Ancestries Reported - Lithuanian (%)
Ancestries Reported - Norwegian (%)
Ancestries Reported - Polish (%)
Ancestries Reported - Portuguese (%)
Ancestries Reported - Russian (%)
Ancestries Reported - Scotch-Irish (%)
Ancestries Reported - Scottish (%)
Ancestries Reported - Slovak (%)
Ancestries Reported - Subsaharan African (%)
Ancestries Reported - Swedish (%)
Ancestries Reported - Swiss (%)
Ancestries Reported - Ukrainian (%)
Ancestries Reported - United States (%)
Ancestries Reported - Welsh (%)
Ancestries Reported - West Indian (%)
Ancestries Reported - Other (%)
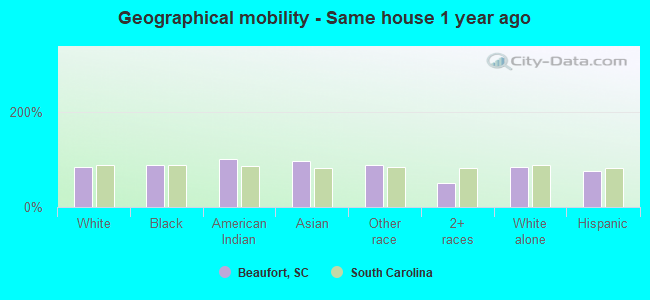
Geographical mobility - Same house 1 year ago (%)
Geographical mobility - Same house 1 year ago (%) - White
Geographical mobility - Same house 1 year ago (%) - Black or African American
Geographical mobility - Same house 1 year ago (%) - Asian
Geographical mobility - Same house 1 year ago (%) - Hispanic or Latino
Geographical mobility - Same house 1 year ago (%) - American Indian and Alaska Native
Geographical mobility - Same house 1 year ago (%) - Multirace
Geographical mobility - Same house 1 year ago (%) - Other Race
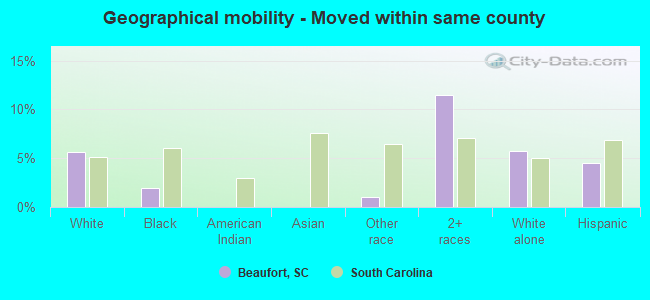
Geographical mobility - Moved within same county (%)
Geographical mobility - Moved within same county (%) - White
Geographical mobility - Moved within same county (%) - Black or African American
Geographical mobility - Moved within same county (%) - Asian
Geographical mobility - Moved within same county (%) - Hispanic or Latino
Geographical mobility - Moved within same county (%) - American Indian and Alaska Native
Geographical mobility - Moved within same county (%) - Multirace
Geographical mobility - Moved within same county (%) - Other Race
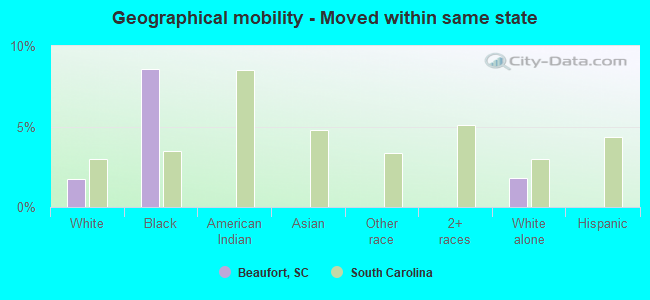
Geographical mobility - Moved from different county within same state (%)
Geographical mobility - Moved from different county within same state (%) - White
Geographical mobility - Moved from different county within same state (%) - Black or African American
Geographical mobility - Moved from different county within same state (%) - Asian
Geographical mobility - Moved from different county within same state (%) - Hispanic or Latino
Geographical mobility - Moved from different county within same state (%) - American Indian and Alaska Native
Geographical mobility - Moved from different county within same state (%) - Multirace
Geographical mobility - Moved from different county within same state (%) - Other Race
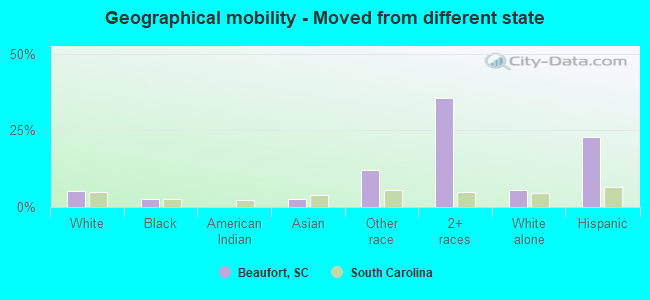
Geographical mobility - Moved from different state (%)
Geographical mobility - Moved from different state (%) - White
Geographical mobility - Moved from different state (%) - Black or African American
Geographical mobility - Moved from different state (%) - Asian
Geographical mobility - Moved from different state (%) - Hispanic or Latino
Geographical mobility - Moved from different state (%) - American Indian and Alaska Native
Geographical mobility - Moved from different state (%) - Multirace
Geographical mobility - Moved from different state (%) - Other Race
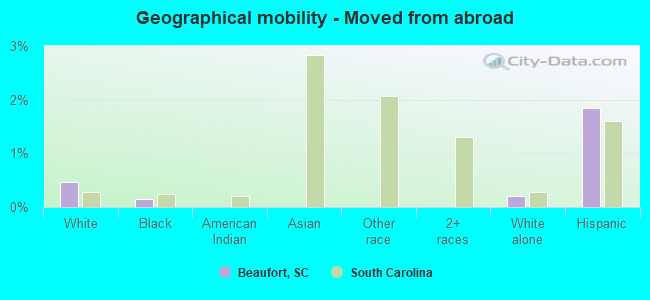
Geographical mobility - Moved from abroad (%)
Geographical mobility - Moved from abroad (%) - White
Geographical mobility - Moved from abroad (%) - Black or African American
Geographical mobility - Moved from abroad (%) - Asian
Geographical mobility - Moved from abroad (%) - Hispanic or Latino
Geographical mobility - Moved from abroad (%) - American Indian and Alaska Native
Geographical mobility - Moved from abroad (%) - Multirace
Geographical mobility - Moved from abroad (%) - Other Race
Place of birth for the foreign-born population - Ireland (%)
Place of birth for the foreign-born population - Denmark (%)
Place of birth for the foreign-born population - Norway (%)
Place of birth for the foreign-born population - Sweden (%)
Place of birth for the foreign-born population - United Kingdom (%)
Place of birth for the foreign-born population - England (%)
Place of birth for the foreign-born population - Scotland (%)
Place of birth for the foreign-born population - Other Northern Europe (%)
Place of birth for the foreign-born population - Austria (%)
Place of birth for the foreign-born population - Belgium (%)
Place of birth for the foreign-born population - France (%)
Place of birth for the foreign-born population - Germany (%)
Place of birth for the foreign-born population - Netherlands (%)
Place of birth for the foreign-born population - Switzerland (%)
Place of birth for the foreign-born population - Other Western Europe (%)
Place of birth for the foreign-born population - Greece (%)
Place of birth for the foreign-born population - Italy (%)
Place of birth for the foreign-born population - Portugal (%)
Place of birth for the foreign-born population - Spain (%)
Place of birth for the foreign-born population - Other Southern Europe (%)
Place of birth for the foreign-born population - Albania (%)
Place of birth for the foreign-born population - Belarus (%)
Place of birth for the foreign-born population - Bosnia and Herzegovina (%)
Place of birth for the foreign-born population - Bulgaria (%)
Place of birth for the foreign-born population - Croatia (%)
Place of birth for the foreign-born population - Czechoslovakia (%)
Place of birth for the foreign-born population - Hungary (%)
Place of birth for the foreign-born population - Latvia (%)
Place of birth for the foreign-born population - Lithuania (%)
Place of birth for the foreign-born population - North Macedonia (Macedonia) (%)
Place of birth for the foreign-born population - Moldova (%)
Place of birth for the foreign-born population - Poland (%)
Place of birth for the foreign-born population - Romania (%)
Place of birth for the foreign-born population - Russia (%)
Place of birth for the foreign-born population - Serbia (%)
Place of birth for the foreign-born population - Ukraine (%)
Place of birth for the foreign-born population - Other Eastern Europe (%)
Place of birth for the foreign-born population - China (%)
Place of birth for the foreign-born population - Hong Kong (%)
Place of birth for the foreign-born population - Taiwan (%)
Place of birth for the foreign-born population - Japan (%)
Place of birth for the foreign-born population - Korea (%)
Place of birth for the foreign-born population - Other Eastern Asia (%)
Place of birth for the foreign-born population - Afghanistan (%)
Place of birth for the foreign-born population - Bangladesh (%)
Place of birth for the foreign-born population - India (%)
Place of birth for the foreign-born population - Iran (%)
Place of birth for the foreign-born population - Kazakhstan (%)
Place of birth for the foreign-born population - Nepal (%)
Place of birth for the foreign-born population - Pakistan (%)
Place of birth for the foreign-born population - Sri Lanka (%)
Place of birth for the foreign-born population - Uzbekistan (%)
Place of birth for the foreign-born population - Other South Central Asia (%)
Place of birth for the foreign-born population - Burma (%)
Place of birth for the foreign-born population - Cambodia (%)
Place of birth for the foreign-born population - Indonesia (%)
Place of birth for the foreign-born population - Laos (%)
Place of birth for the foreign-born population - Malaysia (%)
Place of birth for the foreign-born population - Philippines (%)
Place of birth for the foreign-born population - Singapore (%)
Place of birth for the foreign-born population - Thailand (%)
Place of birth for the foreign-born population - Vietnam (%)
Place of birth for the foreign-born population - Other South Eastern Asia (%)
Place of birth for the foreign-born population - Armenia (%)
Place of birth for the foreign-born population - Iraq (%)
Place of birth for the foreign-born population - Israel (%)
Place of birth for the foreign-born population - Jordan (%)
Place of birth for the foreign-born population - Kuwait (%)
Place of birth for the foreign-born population - Lebanon (%)
Place of birth for the foreign-born population - Saudi Arabia (%)
Place of birth for the foreign-born population - Syria (%)
Place of birth for the foreign-born population - Turkey (%)
Place of birth for the foreign-born population - Yemen (%)
Place of birth for the foreign-born population - Other Western Asia (%)
Place of birth for the foreign-born population - Eritrea (%)
Place of birth for the foreign-born population - Ethiopia (%)
Place of birth for the foreign-born population - Kenya (%)
Place of birth for the foreign-born population - Somalia (%)
Place of birth for the foreign-born population - Uganda (%)
Place of birth for the foreign-born population - Zimbabwe (%)
Place of birth for the foreign-born population - Other Eastern Africa (%)
Place of birth for the foreign-born population - Cameroon (%)
Place of birth for the foreign-born population - Congo (%)
Place of birth for the foreign-born population - Democratic Republic of Congo (Zaire) (%)
Place of birth for the foreign-born population - Other Middle Africa (%)
Place of birth for the foreign-born population - Egypt (%)
Place of birth for the foreign-born population - Morocco (%)
Place of birth for the foreign-born population - Sudan (%)
Place of birth for the foreign-born population - Other Northern Africa (%)
Place of birth for the foreign-born population - South Africa (%)
Place of birth for the foreign-born population - Other Southern Africa (%)
Place of birth for the foreign-born population - Cabo Verde (%)
Place of birth for the foreign-born population - Ghana (%)
Place of birth for the foreign-born population - Liberia (%)
Place of birth for the foreign-born population - Nigeria (%)
Place of birth for the foreign-born population - Senegal (%)
Place of birth for the foreign-born population - Sierra Leone (%)
Place of birth for the foreign-born population - Other Western Africa (%)
Place of birth for the foreign-born population - Australia (%)
Place of birth for the foreign-born population - New Zealand (%)
Place of birth for the foreign-born population - Fiji (%)
Place of birth for the foreign-born population - Micronesia (%)
Place of birth for the foreign-born population - Bahamas (%)
Place of birth for the foreign-born population - Barbados (%)
Place of birth for the foreign-born population - Cuba (%)
Place of birth for the foreign-born population - Dominica (%)
Place of birth for the foreign-born population - Dominican Republic (%)
Place of birth for the foreign-born population - Grenada (%)
Place of birth for the foreign-born population - Haiti (%)
Place of birth for the foreign-born population - Jamaica (%)
Place of birth for the foreign-born population - St. Vincent and the Grenadines (%)
Place of birth for the foreign-born population - Trinidad and Tobago (%)
Place of birth for the foreign-born population - West Indies (%)
Place of birth for the foreign-born population - Other Caribbean (%)
Place of birth for the foreign-born population - Belize (%)
Place of birth for the foreign-born population - Costa Rica (%)
Place of birth for the foreign-born population - El Salvador (%)
Place of birth for the foreign-born population - Guatemala (%)
Place of birth for the foreign-born population - Honduras (%)
Place of birth for the foreign-born population - Mexico (%)
Place of birth for the foreign-born population - Nicaragua (%)
Place of birth for the foreign-born population - Panama (%)
Place of birth for the foreign-born population - Other Central America (%)
Place of birth for the foreign-born population - Argentina (%)
Place of birth for the foreign-born population - Bolivia (%)
Place of birth for the foreign-born population - Brazil (%)
Place of birth for the foreign-born population - Chile (%)
Place of birth for the foreign-born population - Colombia (%)
Place of birth for the foreign-born population - Ecuador (%)
Place of birth for the foreign-born population - Guyana (%)
Place of birth for the foreign-born population - Peru (%)
Place of birth for the foreign-born population - Uruguay (%)
Place of birth for the foreign-born population - Venezuela (%)
Place of birth for the foreign-born population - Other South America (%)
Place of birth for the foreign-born population - Canada (%)
Place of birth for the foreign-born population - Other Northern America (%)
Place of birth for the foreign-born population - Other (%)
Latest news about races in Beaufort, SC collected exclusively by city-data.com from local newspapers, TV, and radio stations
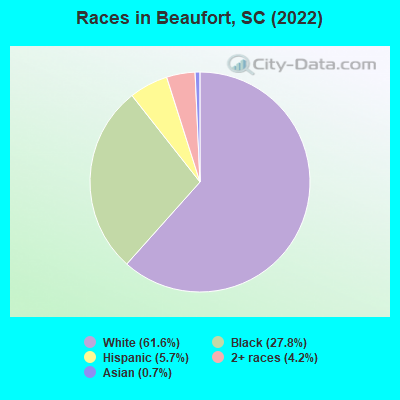
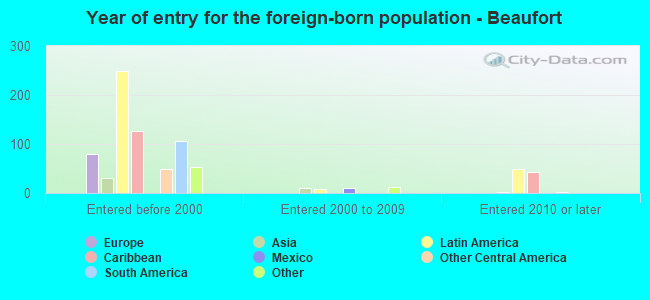
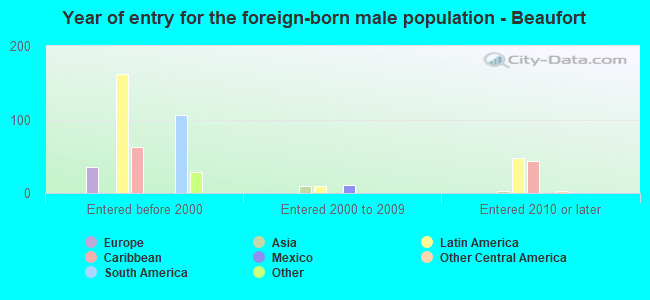
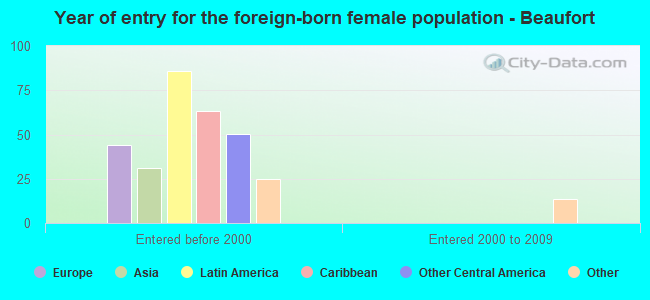
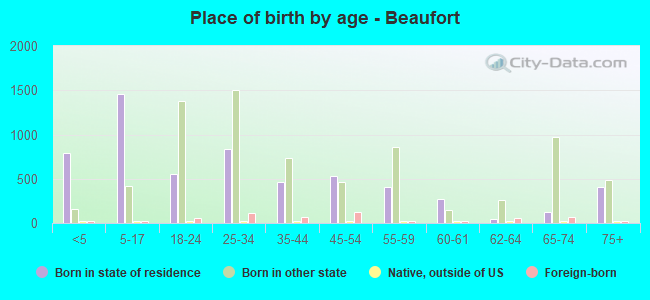
According to 2022 data, the most numerous races in Beaufort, SC are White alone (8,692 residents), Black alone (3,918 residents), and Hispanic (800 residents). 93.7% of Beaufort residents speak English at home. 4.0% of Beaufort, SC residents are foreign-born (2.7% born in Latin America, 0.6% born in Europe), which is 24.4% less than the foreign-born rate of 5.0% across the entire state of South Carolina.
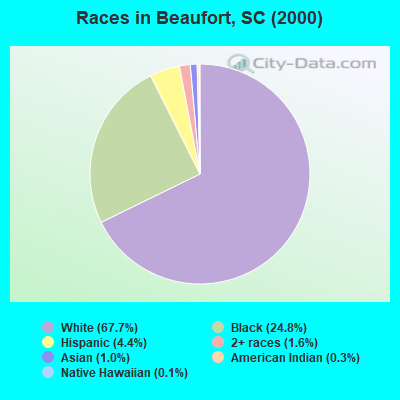
Race distribution in Beaufort
2000 2022
2,652,291 66.1% White alone 1,178,486 29.4% Black alone 95,076 2.4% Hispanic 35,568 0.9% Asian alone 33,290 0.8% Two or more races 12,765 0.3% American Indian alone 3,266 0.08% Other race alone 1,270 0.03% Native Hawaiian and Other
3,301,739 62.5% White alone 1,313,290 24.9% Black alone 343,783 6.5% Hispanic 190,508 3.6% Two or more races 89,888 1.7% Asian alone 29,390 0.6% Other race alone 12,112 0.2% American Indian alone 1,924 0.04% Native Hawaiian and Other
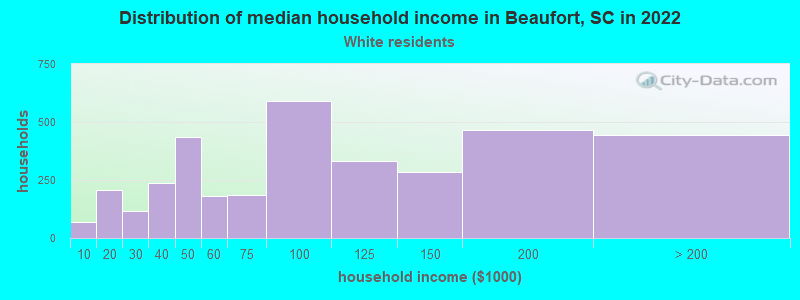
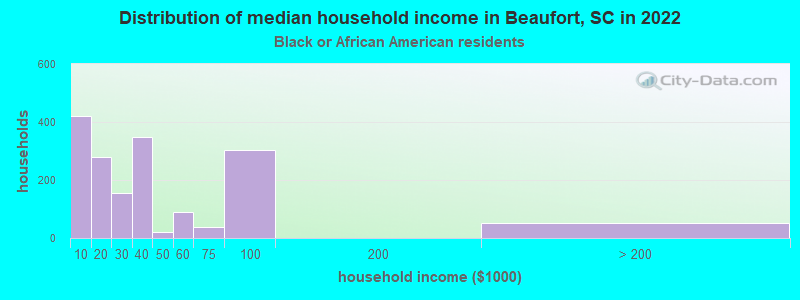
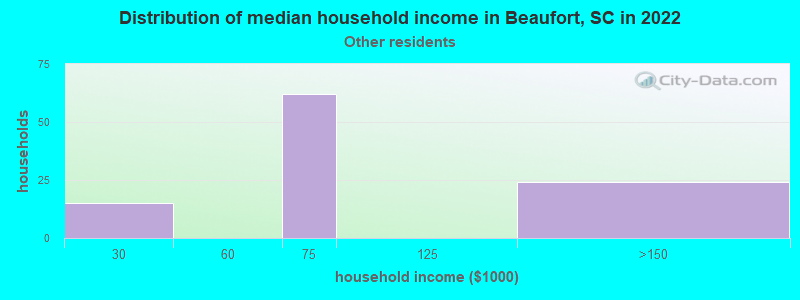
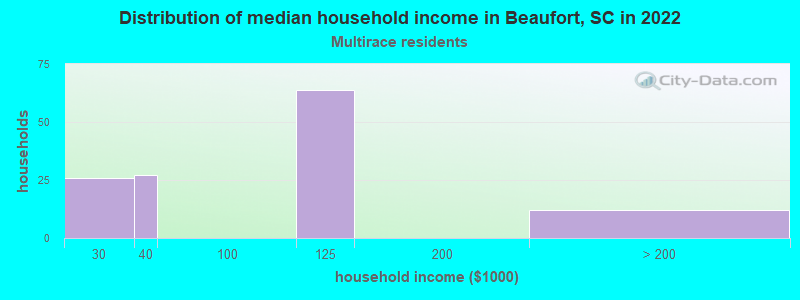
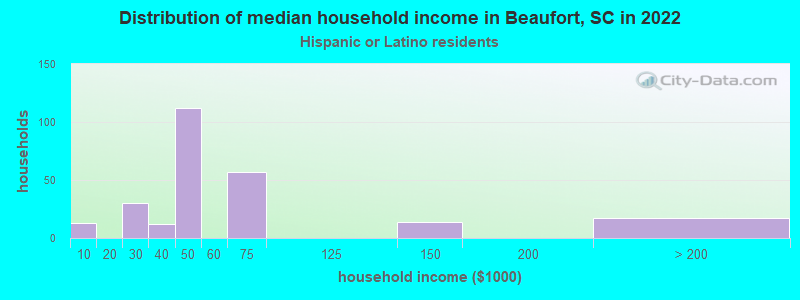
Income and house value in Beaufort Median household income in 2022 $93,472 White non-Hispanic householders$26,308 Black householders$105,089 Some other race householders$57,073 Hispanic or Latino race householdersMedian 2022 house value $426,823 White Non-Hispanic householders$312,090 Black or African American householders$270,598 American Indian or Alaska Native householders $694,175 Asian householders$347,448 Two or more races householders
Median age by race in Beaufort
41.5 Median age for White residents36.1 49.8 26.3 Median age for Black or African American residents29.9 26.5 -345,679,012.0 Median age for American Indian / Alaska Native residents-464,419,475.2 -659,400,544.3 23.8 Median age for Asian residents29.7 -649,885,582.9 -698,412,697.7 Median age for Native Hawaiian / Pacific Islander residents-551,574,375.1 -666,666,666.0 29.2 Median age for Other race residents18.9 47.1 22.8 Median age for Two or more races residents23.6 13.1 42.3 Median age for White alone residents38.6 49.3 25.0 Median age for Hispanic or Latino residents22.8 38.0
Owner/renter occupied households by race in Beaufort
House owners and renters - White residents 2,614 73.7% Owner occupied934 26.3% Renter occupiedHouse owners and renters - Black or African American residents 262 15.4% Owner occupied1,443 84.6% Renter occupiedHouse owners and renters - American Indian / Alaska Native residents 10 100.0% Owner occupiedHouse owners and renters - Asian residents 38 100.0% Owner occupiedHouse owners and renters - Other race residents 59 100.0% Owner occupiedHouse owners and renters - Two or more races residents 77 62.6% Owner occupied46 37.4% Renter occupiedHouse owners and renters - White alone residents 2,474 72.5% Owner occupied941 27.5% Renter occupiedHouse owners and renters - Hispanic or Latino residents 222 80.9% Owner occupied52 19.1% Renter occupied
Language usage in Beaufort
English speakers - Total 93.7% of residents of Beaufort speak English at home.
4.9% of residents speak Spanish at home 496 78.1% Speak English very well139 21.9% Speak English less than very well1.6% of residents speak other language at home 207 100.0% Speak English very well
English speakers - Born in the United States 93.4% of residents of Beaufort speak English at home.
5.4% of residents speak Spanish at home 361 92.1% Speak English very well31 7.9% Speak English less than very well1.4% of residents speak other language at home 105 100.0% Speak English very well
English speakers - Native, born elsewhere 80.9% of residents of Beaufort speak English at home.
40.4% of residents speak other language at home 19 100.0% Speak English very well
English speakers - Foreign-born 33.3% of residents of Beaufort speak English at home.
57.0% of residents speak Spanish at home 212 66.9% Speak English very well105 33.1% Speak English less than very well12.6% of residents speak other language at home 70 100.0% Speak English very well
White (Caucasian) - Speak only English Native:
98.7% (8,116)Foreign-born:
44.1% (97)
White (Caucasian) - Speak another language Native:
1.3% (106)Foreign-born:
53.0% (117)
Black or African American - Speak only English Native:
97.6% (3,233)Foreign-born:
47.2% (55)
Black or African American - Speak another language Native:
2.6% (86)Foreign-born:
44.6% (52)
Asian - Speak another language Native:
100.0% (55)Foreign-born:
81.3% (37)
Other race - Speak another language Native:
99.2% (165)Foreign-born:
100.0% (150)
Two or more races - Speak only English Native:
99.6% (690)Foreign-born:
100.0% (5)
White alone - Speak only English Native:
99.0% (8,045)Foreign-born:
97.0% (100)
White alone - Speak another language Native:
0.8% (66)Foreign-born:
6.8% (7)
Hispanic or Latino - Speak only English Native:
58.4% (313)Foreign-born:
1.2% (3)
Hispanic or Latino - Speak another language Native:
44.3% (238)Foreign-born:
100.0% (268)
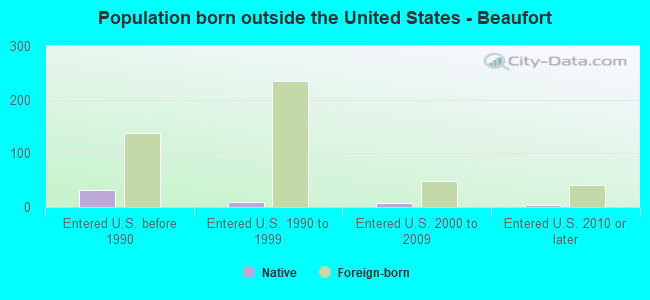
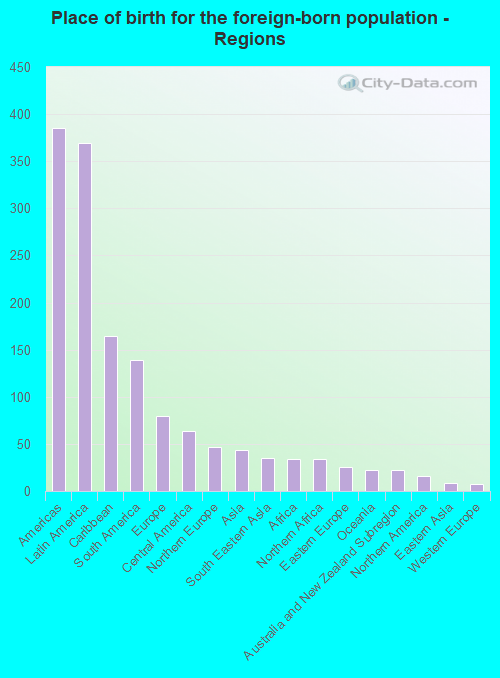
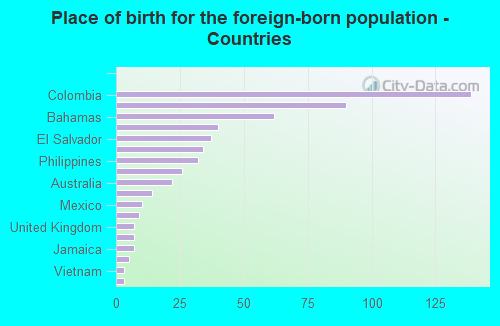
Foreign-born residents in Beaufort 567 residents are foreign born (2.7% Latin America , 0.6% Europe ).
This city:
4.0%South Carolina:
5.3%
Marital status for residents in Beaufort Marital status - White (Caucasian) population 15 years and over
Males 41.5% Never married50.1% Now married0.4% Separated2.7% Widowed5.4% DivorcedFemales 18.3% Never married52.0% Now married1.5% Separated14.9% Widowed13.3% DivorcedWomen who gave birth in the past 12 months Now married:
53.1% (42)Unmarried:
46.9% (37)
Women who did not give birth in the past 12 months Now married:
61.3% (891)Unmarried:
38.7% (562)
Marital status - Black or African American population 15 years and over
Males 62.7% Never married23.5% Now married1.5% Separated3.1% Widowed9.2% DivorcedFemales 66.6% Never married14.1% Now married4.3% Separated8.5% Widowed6.4% DivorcedWomen who gave birth in the past 12 months Now married:
0.0% (0)Unmarried:
100.0% (48)
Women who did not give birth in the past 12 months Now married:
18.3% (224)Unmarried:
81.7% (1,004)
Marital status - Asian population 15 years and over
Males 100.0% Never married0.0% Now married0.0% Separated0.0% Widowed0.0% DivorcedFemales 0.0% Never married100.0% Now married0.0% Separated0.0% Widowed0.0% DivorcedMarital status - Other race population 15 years and over
Males 68.9% Never married31.1% Now married0.0% Separated0.0% Widowed0.0% DivorcedFemales 33.1% Never married35.0% Now married0.0% Separated8.7% Widowed23.1% DivorcedWomen who did not give birth in the past 12 months Now married:
33.8% (62)Unmarried:
66.2% (122)
Marital status - Two or more races population 15 years and over
Males 72.3% Never married27.7% Now married0.0% Separated0.0% Widowed0.0% DivorcedFemales 38.1% Never married61.9% Now married0.0% Separated0.0% Widowed0.0% DivorcedWomen who gave birth in the past 12 months Now married:
100.0% (24)Unmarried:
0.0% (0)
Women who did not give birth in the past 12 months Now married:
0.0% (0)Unmarried:
100.0% (50)
Marital status - White alone, not Hispanic / Latino population 15 years and over
Males 37.4% Never married53.5% Now married0.4% Separated2.9% Widowed5.8% DivorcedFemales 18.5% Never married52.1% Now married1.5% Separated14.8% Widowed13.2% DivorcedWomen who gave birth in the past 12 months Now married:
53.1% (42)Unmarried:
46.9% (37)
Women who did not give birth in the past 12 months Now married:
61.4% (885)Unmarried:
38.6% (555)
Marital status - Hispanic or Latino population 15 years and over
Males 88.9% Never married11.1% Now married0.0% Separated0.0% Widowed0.0% DivorcedFemales 26.3% Never married47.0% Now married0.0% Separated8.9% Widowed17.8% DivorcedWomen who gave birth in the past 12 months Now married:
100.0% (20)Unmarried:
0.0% (0)
Women who did not give birth in the past 12 months Now married:
36.4% (76)Unmarried:
63.6% (133)
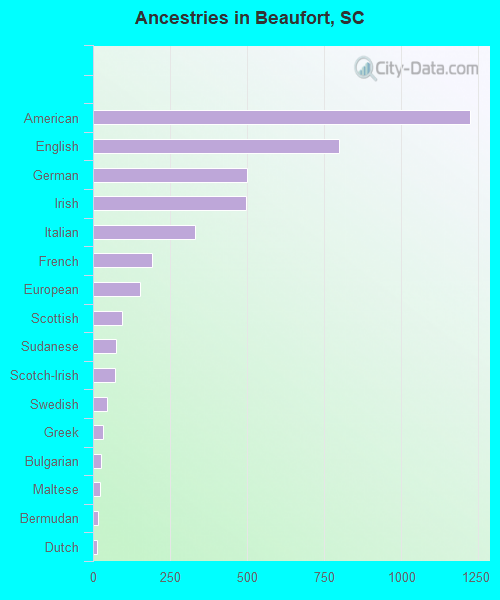
Ancestries in Beaufort
1,224 15.6% American800 10.2% English499 6.4% German495 6.3% Irish330 4.2% Italian190 2.4% French152 1.9% European93 1.2% Scottish76 1.0% Sudanese73 0.9% Scotch-Irish46 0.6% Swedish34 0.4% Greek27 0.3% Bulgarian23 0.3% Maltese16 0.2% Bermudan12 0.2% Dutch9 0.1% Australian8 0.1% British7 0.09% Armenian6 0.08% French Canadian6 0.08% Welsh5 0.06% African4 0.05% Belgian4 0.05% Northern European4 0.05% Polish4 0.05% Jamaican2 0.03% Scandinavian
Children Nativity (place of birth) in Beaufort
Children under 6 years - Living with two parents Both parents native 430 100.0% NativeOne native, one foreign-born parent 63 100.0% NativeChildren under 6 years - Living with one parent Native parent 643 100.0% NativeChildren 6 to 17 years - Living with two parents Both parents native 746 100.0% NativeChildren 6 to 17 years - Living with one parent Native parent 845 100.0% NativeForeign-born parent 61 49.6% Native62 50.4% Foreign-born
Grandparents responsible for own grandchildren in Beaufort
Grandparents (30 to 59 years) White / Caucasian 29 100.0% Not responsible for grandchildrenBlack or African American 32 100.0% Not responsible for grandchildrenWhite alone, not Hispanic / Latino 28 100.0% Not responsible for grandchildren
Grandparents (60 years and over)