Races in Beaver Dam, Wisconsin (WI) Detailed Stats
Ancestries, Foreign-born residents, place of birth
Settings
X


Recent posts about races in Beaver Dam, Wisconsin on our local forum with over 2,400,000 registered users:
 | Moving from LA to Beaver Dam WI (5 replies) |
| Can Milwaukee make you prejudice? (26 replies) |
| Former Wisconsinites...where did you move to and how do you like it in comparison to WI? (480 replies) |
| Homes for Rent in Beaver Dam area (4 replies) |
| Waupun, WI (14 replies) |
| Should I move to WI? (189 replies) |
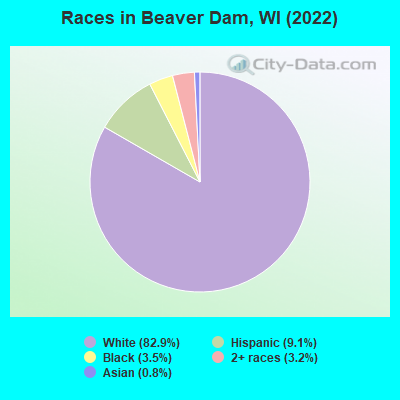
According to 2022 data, the most numerous races in Beaver Dam, WI are White alone (13,682 residents), Hispanic (1,499 residents), and Black alone (578 residents). 93.3% of Beaver Dam residents speak English at home. 4.6% of Beaver Dam, WI residents are foreign-born (2.8% born in Latin America, 1.4% born in Asia), which is 9.6% less than the foreign-born rate of 5.0% across the entire state of Wisconsin.
Race distribution in Beaver Dam
2000
2022

- 14,23793.9%White alone
- 6404.2%Hispanic
- 1050.7%Two or more races
- 910.6%Asian alone
- 430.3%Black alone
- 440.3%American Indian alone
- 70.05%Native Hawaiian and Other
Pacific Islander alone - 20.01%Other race alone

-
- 13,68282.9%White alone
- 1,4999.1%Hispanic
- 5783.5%Black alone
- 5323.2%Two or more races
- 1360.8%Asian alone
- 90.05%Native Hawaiian and Other
Pacific Islander alone
2000
2022
-
- 4,681,63087.3%White alone
- 300,2455.6%Black alone
- 192,9213.6%Hispanic
- 87,9951.6%Asian alone
- 51,9211.0%Two or more races
- 43,9800.8%American Indian alone
- 3,6370.07%Other race alone
- 1,3460.03%Native Hawaiian and Other
Pacific Islander alone

-
- 4,654,03179.0%White alone
- 447,0227.6%Hispanic
- 345,6785.9%Black alone
- 217,5323.7%Two or more races
- 172,2422.9%Asian alone
- 33,7620.6%American Indian alone
- 19,6800.3%Other race alone
- 2,5920.04%Native Hawaiian and Other
Pacific Islander alone

Income and house value in Beaver Dam
- Median household income in 2022
- $63,208White non-Hispanic householders
- $70,688Black householders
- $88,655Asian householders
- $77,956Some other race householders
- $33,827Two or more races householders
- $50,000Hispanic or Latino race householders
- Median 2022 house value
- $192,726White Non-Hispanic householders
- $158,144Black or African American householders
- $179,230American Indian or Alaska Native householders
- $474,434Asian householders
- $237,217Native Hawaiian and other Pacific Islander householders
- $320,718Two or more races householders
- $126,515Hispanic or Latino householders
Household income for White non-Hispanic householders

Household income for Black householders

Household income for Asian householders

Household income for Some other race householders

Household income for Two or more races householders

Household income for Hispanic or Latino race householders

Median age by race in Beaver Dam
- 43.7Median age for White residents
- 40.2Males
- 48.4Females
- 28.0Median age for Black or African American residents
- 41.0Males
- 29.6Females
- -686,991,869.2Median age for American Indian / Alaska Native residents
- -664,609,052.8Males
- -666,666,666.0Females
- 48.3Median age for Asian residents
- 40.8Males
- 23.8Females
- -825,688,072.6Median age for Native Hawaiian / Pacific Islander residents
- -862,745,097.2Males
- -666,666,666.0Females
- 58.5Median age for Other race residents
- 45.7Males
- 77.8Females
- 23.2Median age for Two or more races residents
- 27.8Males
- 32.9Females
- 43.7Median age for White alone residents
- 40.5Males
- 48.1Females
- 32.0Median age for Hispanic or Latino residents
- 32.3Males
- 23.6Females
Owner/renter occupied households by race in Beaver Dam
- House owners and renters - White residents
- 4,12759.2%Owner occupied
- 2,84540.8%Renter occupied
- House owners and renters - Black or African American residents
- 208.7%Owner occupied
- 21291.3%Renter occupied
- House owners and renters - American Indian / Alaska Native residents
- 18100.0%Renter occupied
- House owners and renters - Asian residents
- 2953.4%Owner occupied
- 2646.6%Renter occupied
- House owners and renters - Other race residents
- 1713.0%Owner occupied
- 11387.0%Renter occupied
- House owners and renters - Two or more races residents
- 11630.6%Owner occupied
- 26469.4%Renter occupied
- House owners and renters - White alone residents
- 4,08159.4%Owner occupied
- 2,79340.6%Renter occupied
- House owners and renters - Hispanic or Latino residents
- 9618.9%Owner occupied
- 41181.1%Renter occupied
Language usage in Beaver Dam
- English speakers - Total
- 93.3% of residents of Beaver Dam speak English at home.
- 4.2% of residents speak Spanish at home
- 29444.8%Speak English very well
- 36255.2%Speak English less than very well
- 2.0% of residents speak other language at home
- 28890.9%Speak English very well
- 299.1%Speak English less than very well
- English speakers - Born in the United States
- 95.1% of residents of Beaver Dam speak English at home.
- 7.1% of residents speak Spanish at home
- 20394.4%Speak English very well
- 125.6%Speak English less than very well
- 0.8% of residents speak other language at home
- 23100.0%Speak English very well
All residents speak only English at home
- English speakers - Foreign-born
- 10.6% of residents of Beaver Dam speak English at home.
- 70.2% of residents speak Spanish at home
- 18936.6%Speak English very well
- 32863.4%Speak English less than very well
- 32.6% of residents speak other language at home
- 22895.0%Speak English very well
- 125.0%Speak English less than very well
White (Caucasian) - Speak only English
| Native: | 98.2% (13,004) |
| Foreign-born: | 17.2% (22) |
White (Caucasian) - Speak another language
| Native: | 1.8% (240) |
| Foreign-born: | 76.1% (97) |
Black or African American - Speak only English
| Native: | 100.0% (416) |
| Foreign-born: | 76.6% (20) |
Asian - Speak only English
| Native: | 100.0% (41) |
| Foreign-born: | 1.1% (3) |
Other race - Speak another language
| Native: | 51.1% (133) |
| Foreign-born: | 98.8% (126) |
Two or more races - Speak another language
| Native: | 5.5% (53) |
| Foreign-born: | 100.0% (270) |
White alone - Speak only English
| Native: | 98.2% (12,858) |
| Foreign-born: | 60.4% (14) |
White alone - Speak another language
| Native: | 2.0% (262) |
| Foreign-born: | 44.1% (10) |
Hispanic or Latino - Speak only English
| Native: | 93.3% (771) |
| Foreign-born: | 1.6% (10) |
Hispanic or Latino - Speak another language
| Native: | 45.4% (375) |
| Foreign-born: | 88.8% (532) |
Foreign-born residents in Beaver Dam
753 residents are foreign born (2.8% Latin America, 1.4% Asia).
| This city: | 4.6% |
| Wisconsin: | 5.0% |


Marital status for residents in Beaver Dam
Marital status - White (Caucasian) population 15 years and over
- Males
- 40.9%Never married
- 43.8%Now married
- 0.5%Separated
- 4.2%Widowed
- 10.6%Divorced
- Females
- 23.1%Never married
- 41.7%Now married
- 1.5%Separated
- 13.9%Widowed
- 19.7%Divorced
Women who gave birth in the past 12 months
| Now married: | 62.6% (83) |
| Unmarried: | 37.4% (50) |
Women who did not give birth in the past 12 months
| Now married: | 46.1% (1,159) |
| Unmarried: | 53.9% (1,354) |
Marital status - Black or African American population 15 years and over
- Males
- 70.1%Never married
- 8.7%Now married
- 1.7%Separated
- 0.0%Widowed
- 19.5%Divorced
- Females
- 76.3%Never married
- 0.0%Now married
- 23.7%Separated
- 0.0%Widowed
- 0.0%Divorced
Women who did not give birth in the past 12 months
| Now married: | 23.9% (32) |
| Unmarried: | 76.1% (101) |
Marital status - Asian population 15 years and over
- Males
- 0.0%Never married
- 66.7%Now married
- 0.0%Separated
- 0.0%Widowed
- 33.3%Divorced
- Females
- 27.1%Never married
- 72.9%Now married
- 0.0%Separated
- 0.0%Widowed
- 0.0%Divorced
Women who did not give birth in the past 12 months
| Now married: | 62.8% (48) |
| Unmarried: | 37.2% (29) |
Marital status - Other race population 15 years and over
- Males
- 78.9%Never married
- 5.3%Now married
- 15.8%Separated
- 0.0%Widowed
- 0.0%Divorced
- Females
- 0.0%Never married
- 78.4%Now married
- 21.6%Separated
- 0.0%Widowed
- 0.0%Divorced
Women who did not give birth in the past 12 months
| Now married: | 100.0% (26) |
| Unmarried: | 0.0% (0) |
Marital status - Two or more races population 15 years and over
- Males
- 65.5%Never married
- 34.5%Now married
- 0.0%Separated
- 0.0%Widowed
- 0.0%Divorced
- Females
- 25.6%Never married
- 53.4%Now married
- 0.0%Separated
- 6.0%Widowed
- 15.0%Divorced
Women who did not give birth in the past 12 months
| Now married: | 49.6% (88) |
| Unmarried: | 50.4% (89) |
Marital status - White alone, not Hispanic / Latino population 15 years and over
- Males
- 40.5%Never married
- 43.8%Now married
- 0.3%Separated
- 4.3%Widowed
- 11.0%Divorced
- Females
- 22.8%Never married
- 41.8%Now married
- 1.6%Separated
- 14.2%Widowed
- 19.7%Divorced
Women who gave birth in the past 12 months
| Now married: | 59.1% (74) |
| Unmarried: | 40.9% (51) |
Women who did not give birth in the past 12 months
| Now married: | 46.5% (1,163) |
| Unmarried: | 53.5% (1,339) |
Marital status - Hispanic or Latino population 15 years and over
- Males
- 57.2%Never married
- 35.1%Now married
- 7.7%Separated
- 0.0%Widowed
- 0.0%Divorced
- Females
- 32.1%Never married
- 53.9%Now married
- 3.3%Separated
- 0.0%Widowed
- 10.7%Divorced
Women who gave birth in the past 12 months
| Now married: | 100.0% (11) |
| Unmarried: | 0.0% (0) |
Women who did not give birth in the past 12 months
| Now married: | 51.9% (76) |
| Unmarried: | 48.1% (70) |
Ancestries in Beaver Dam

- 3,30842.0%German
- 3894.9%English
- 3734.7%American
- 3694.7%Norwegian
- 3384.3%Polish
- 1952.5%European
- 1912.4%Dutch
- 1572.0%Italian
- 1381.8%Irish
- 871.1%Danish
- 640.8%Swiss
- 570.7%Eastern European
- 460.6%French
- 360.5%Scandinavian
- 250.3%Welsh
- 200.3%Northern European
- 190.2%Czech
- 190.2%Ghanaian
- 180.2%German Russian
- 160.2%African
- 140.2%Hungarian
- 140.2%Russian
- 140.2%Swedish
- 50.06%Austrian
- 10.01%Ethiopian

Geographical mobility in Beaver Dam

- Same house 1 year ago
- 12,41490.0%White (Caucasian)
- 55796.2%Black or African American
- 29100.0%American Indian / Alaska Native
- 27594.6%Asian
- 8100.0%Native Hawaiian / Pacific Islander
- 36695.4%Other race
- 1,44999.8%Two or more races
- 12,23290.0%White alone, not Hispanic / Latino
- 1,34594.6%Hispanic or Latino

-
- Moved within same county
- 6034.4%White / Caucasian
- 20.3%Black or African American
- 124.2%Asian
- 5794.3%White alone, not Hispanic / Latino
- 684.8%Hispanic or Latino

-
- Moved within same state
- 4353.1%White / Caucasian
- 315.4%Black or African American
- 30.7%Other race
- 191.3%Two or more races
- 4463.3%White alone, not Hispanic / Latino
- 30.2%Hispanic or Latino

-
- Moved from different state
- 1611.2%White / Caucasian
- 10.1%Black or African American
- 1611.2%White alone, not Hispanic / Latino

-
- Moved from abroad
- 190.1%White
- 190.1%White alone, not Hispanic / Latino

Children Nativity (place of birth) in Beaver Dam
Place of birth for residents in Beaver Dam
![Place of birth for the foreign-born population - Regions]()
- 479Americas
- 458Latin America
- 394Central America
- 236Asia
- 130South Eastern Asia
- 56South Central Asia
- 52South America
- 48Eastern Asia
- 21Northern America
- 20Africa
- 19Western Africa
- 17China
- 15Europe
- 15Northern Europe
- 10Caribbean

![Place of birth for the foreign-born population - Countries]()
- 380Mexico
- 130Philippines
- 56India
- 44Colombia
- 21Canada
- 19Ghana
- 17China
- 13Nicaragua
- 10Cuba
- 8United Kingdom
- 7Ecuador
- 6England
- 2Korea

Grandparents responsible for own grandchildren in Beaver Dam
Zip codes: 53916.