Races in Beaver, Utah (UT) Detailed Stats
Data:
Races - White alone (%)
Races - White alone (% change since 2000)
Races - Black alone (%)
Races - Black alone (% change since 2000)
Races - American Indian alone (%)
Races - American Indian alone (% change since 2000)
Races - Asian alone (%)
Races - Asian alone (% change since 2000)
Races - Hispanic (%)
Races - Hispanic (% change since 2000)
Races - Native Hawaiian and Other Pacific Islander alone (%)
Races - Native Hawaiian and Other Pacific Islander alone (% change since 2000)
Races - Two or more races(%)
Races - Two or more races(% change since 2000)
Races - Other race alone (%)
Races - Other race alone (% change since 2000)
Racial diversity
Place of birth - Born in state of residence (%)
Place of birth - Born in state of residence (%) - White
Place of birth - Born in state of residence (%) - Black or African American
Place of birth - Born in state of residence (%) - Asian
Place of birth - Born in state of residence (%) - Hispanic or Latino
Place of birth - Born in state of residence (%) - American Indian and Alaska Native
Place of birth - Born in state of residence (%) - Multirace
Place of birth - Born in state of residence (%) - Other Race
Place of birth - Born in other state (%)
Place of birth - Born in other state (%) - White
Place of birth - Born in other state (%) - Black or African American
Place of birth - Born in other state (%) - Asian
Place of birth - Born in other state (%) - Hispanic or Latino
Place of birth - Born in other state (%) - American Indian and Alaska Native
Place of birth - Born in other state (%) - Multirace
Place of birth - Born in other state (%) - Other Race
Place of birth - Native, outside of US (%)
Place of birth - Native, outside of US (%) - White
Place of birth - Native, outside of US (%) - Black or African American
Place of birth - Native, outside of US (%) - Asian
Place of birth - Native, outside of US (%) - Hispanic or Latino
Place of birth - Native, outside of US (%) - American Indian and Alaska Native
Place of birth - Native, outside of US (%) - Multirace
Place of birth - Native, outside of US (%) - Other Race
Place of birth - Foreign born (%)
Place of birth - Foreign born (%) - White
Place of birth - Foreign born (%) - Black or African American
Place of birth - Foreign born (%) - Asian
Place of birth - Foreign born (%) - Hispanic or Latino
Place of birth - Foreign born (%) - American Indian and Alaska Native
Place of birth - Foreign born (%) - Multirace
Place of birth - Foreign born (%) - Other Race
Residents speaking English at home (%)
Residents speaking English at home - Born in the United States (%)
Residents speaking English at home - Native, born elsewhere (%)
Residents speaking English at home - Foreign born (%)
Residents speaking Spanish at home (%)
Residents speaking Spanish at home - Born in the United States (%)
Residents speaking Spanish at home - Native, born elsewhere (%)
Residents speaking Spanish at home - Foreign born (%)
Residents speaking other language at home (%)
Residents speaking other language at home - Born in the United States (%)
Residents speaking other language at home - Native, born elsewhere (%)
Residents speaking other language at home - Foreign born (%)
Marital status - Never married (%)
Marital status - Now married (%)
Marital status - Separated (%)
Marital status - Widowed (%)
Marital status - Divorced (%)
Ancestries Reported - Arab (%)
Ancestries Reported - Czech (%)
Ancestries Reported - Danish (%)
Ancestries Reported - Dutch (%)
Ancestries Reported - English (%)
Ancestries Reported - French (%)
Ancestries Reported - French Canadian (%)
Ancestries Reported - German (%)
Ancestries Reported - Greek (%)
Ancestries Reported - Hungarian (%)
Ancestries Reported - Irish (%)
Ancestries Reported - Italian (%)
Ancestries Reported - Lithuanian (%)
Ancestries Reported - Norwegian (%)
Ancestries Reported - Polish (%)
Ancestries Reported - Portuguese (%)
Ancestries Reported - Russian (%)
Ancestries Reported - Scotch-Irish (%)
Ancestries Reported - Scottish (%)
Ancestries Reported - Slovak (%)
Ancestries Reported - Subsaharan African (%)
Ancestries Reported - Swedish (%)
Ancestries Reported - Swiss (%)
Ancestries Reported - Ukrainian (%)
Ancestries Reported - United States (%)
Ancestries Reported - Welsh (%)
Ancestries Reported - West Indian (%)
Ancestries Reported - Other (%)
Geographical mobility - Same house 1 year ago (%)
Geographical mobility - Same house 1 year ago (%) - White
Geographical mobility - Same house 1 year ago (%) - Black or African American
Geographical mobility - Same house 1 year ago (%) - Asian
Geographical mobility - Same house 1 year ago (%) - Hispanic or Latino
Geographical mobility - Same house 1 year ago (%) - American Indian and Alaska Native
Geographical mobility - Same house 1 year ago (%) - Multirace
Geographical mobility - Same house 1 year ago (%) - Other Race
Geographical mobility - Moved within same county (%)
Geographical mobility - Moved within same county (%) - White
Geographical mobility - Moved within same county (%) - Black or African American
Geographical mobility - Moved within same county (%) - Asian
Geographical mobility - Moved within same county (%) - Hispanic or Latino
Geographical mobility - Moved within same county (%) - American Indian and Alaska Native
Geographical mobility - Moved within same county (%) - Multirace
Geographical mobility - Moved within same county (%) - Other Race
Geographical mobility - Moved from different county within same state (%)
Geographical mobility - Moved from different county within same state (%) - White
Geographical mobility - Moved from different county within same state (%) - Black or African American
Geographical mobility - Moved from different county within same state (%) - Asian
Geographical mobility - Moved from different county within same state (%) - Hispanic or Latino
Geographical mobility - Moved from different county within same state (%) - American Indian and Alaska Native
Geographical mobility - Moved from different county within same state (%) - Multirace
Geographical mobility - Moved from different county within same state (%) - Other Race
Geographical mobility - Moved from different state (%)
Geographical mobility - Moved from different state (%) - White
Geographical mobility - Moved from different state (%) - Black or African American
Geographical mobility - Moved from different state (%) - Asian
Geographical mobility - Moved from different state (%) - Hispanic or Latino
Geographical mobility - Moved from different state (%) - American Indian and Alaska Native
Geographical mobility - Moved from different state (%) - Multirace
Geographical mobility - Moved from different state (%) - Other Race
Geographical mobility - Moved from abroad (%)
Geographical mobility - Moved from abroad (%) - White
Geographical mobility - Moved from abroad (%) - Black or African American
Geographical mobility - Moved from abroad (%) - Asian
Geographical mobility - Moved from abroad (%) - Hispanic or Latino
Geographical mobility - Moved from abroad (%) - American Indian and Alaska Native
Geographical mobility - Moved from abroad (%) - Multirace
Geographical mobility - Moved from abroad (%) - Other Race
Place of birth for the foreign-born population - Ireland (%)
Place of birth for the foreign-born population - Denmark (%)
Place of birth for the foreign-born population - Norway (%)
Place of birth for the foreign-born population - Sweden (%)
Place of birth for the foreign-born population - United Kingdom (%)
Place of birth for the foreign-born population - England (%)
Place of birth for the foreign-born population - Scotland (%)
Place of birth for the foreign-born population - Other Northern Europe (%)
Place of birth for the foreign-born population - Austria (%)
Place of birth for the foreign-born population - Belgium (%)
Place of birth for the foreign-born population - France (%)
Place of birth for the foreign-born population - Germany (%)
Place of birth for the foreign-born population - Netherlands (%)
Place of birth for the foreign-born population - Switzerland (%)
Place of birth for the foreign-born population - Other Western Europe (%)
Place of birth for the foreign-born population - Greece (%)
Place of birth for the foreign-born population - Italy (%)
Place of birth for the foreign-born population - Portugal (%)
Place of birth for the foreign-born population - Spain (%)
Place of birth for the foreign-born population - Other Southern Europe (%)
Place of birth for the foreign-born population - Albania (%)
Place of birth for the foreign-born population - Belarus (%)
Place of birth for the foreign-born population - Bosnia and Herzegovina (%)
Place of birth for the foreign-born population - Bulgaria (%)
Place of birth for the foreign-born population - Croatia (%)
Place of birth for the foreign-born population - Czechoslovakia (%)
Place of birth for the foreign-born population - Hungary (%)
Place of birth for the foreign-born population - Latvia (%)
Place of birth for the foreign-born population - Lithuania (%)
Place of birth for the foreign-born population - North Macedonia (Macedonia) (%)
Place of birth for the foreign-born population - Moldova (%)
Place of birth for the foreign-born population - Poland (%)
Place of birth for the foreign-born population - Romania (%)
Place of birth for the foreign-born population - Russia (%)
Place of birth for the foreign-born population - Serbia (%)
Place of birth for the foreign-born population - Ukraine (%)
Place of birth for the foreign-born population - Other Eastern Europe (%)
Place of birth for the foreign-born population - China (%)
Place of birth for the foreign-born population - Hong Kong (%)
Place of birth for the foreign-born population - Taiwan (%)
Place of birth for the foreign-born population - Japan (%)
Place of birth for the foreign-born population - Korea (%)
Place of birth for the foreign-born population - Other Eastern Asia (%)
Place of birth for the foreign-born population - Afghanistan (%)
Place of birth for the foreign-born population - Bangladesh (%)
Place of birth for the foreign-born population - India (%)
Place of birth for the foreign-born population - Iran (%)
Place of birth for the foreign-born population - Kazakhstan (%)
Place of birth for the foreign-born population - Nepal (%)
Place of birth for the foreign-born population - Pakistan (%)
Place of birth for the foreign-born population - Sri Lanka (%)
Place of birth for the foreign-born population - Uzbekistan (%)
Place of birth for the foreign-born population - Other South Central Asia (%)
Place of birth for the foreign-born population - Burma (%)
Place of birth for the foreign-born population - Cambodia (%)
Place of birth for the foreign-born population - Indonesia (%)
Place of birth for the foreign-born population - Laos (%)
Place of birth for the foreign-born population - Malaysia (%)
Place of birth for the foreign-born population - Philippines (%)
Place of birth for the foreign-born population - Singapore (%)
Place of birth for the foreign-born population - Thailand (%)
Place of birth for the foreign-born population - Vietnam (%)
Place of birth for the foreign-born population - Other South Eastern Asia (%)
Place of birth for the foreign-born population - Armenia (%)
Place of birth for the foreign-born population - Iraq (%)
Place of birth for the foreign-born population - Israel (%)
Place of birth for the foreign-born population - Jordan (%)
Place of birth for the foreign-born population - Kuwait (%)
Place of birth for the foreign-born population - Lebanon (%)
Place of birth for the foreign-born population - Saudi Arabia (%)
Place of birth for the foreign-born population - Syria (%)
Place of birth for the foreign-born population - Turkey (%)
Place of birth for the foreign-born population - Yemen (%)
Place of birth for the foreign-born population - Other Western Asia (%)
Place of birth for the foreign-born population - Eritrea (%)
Place of birth for the foreign-born population - Ethiopia (%)
Place of birth for the foreign-born population - Kenya (%)
Place of birth for the foreign-born population - Somalia (%)
Place of birth for the foreign-born population - Uganda (%)
Place of birth for the foreign-born population - Zimbabwe (%)
Place of birth for the foreign-born population - Other Eastern Africa (%)
Place of birth for the foreign-born population - Cameroon (%)
Place of birth for the foreign-born population - Congo (%)
Place of birth for the foreign-born population - Democratic Republic of Congo (Zaire) (%)
Place of birth for the foreign-born population - Other Middle Africa (%)
Place of birth for the foreign-born population - Egypt (%)
Place of birth for the foreign-born population - Morocco (%)
Place of birth for the foreign-born population - Sudan (%)
Place of birth for the foreign-born population - Other Northern Africa (%)
Place of birth for the foreign-born population - South Africa (%)
Place of birth for the foreign-born population - Other Southern Africa (%)
Place of birth for the foreign-born population - Cabo Verde (%)
Place of birth for the foreign-born population - Ghana (%)
Place of birth for the foreign-born population - Liberia (%)
Place of birth for the foreign-born population - Nigeria (%)
Place of birth for the foreign-born population - Senegal (%)
Place of birth for the foreign-born population - Sierra Leone (%)
Place of birth for the foreign-born population - Other Western Africa (%)
Place of birth for the foreign-born population - Australia (%)
Place of birth for the foreign-born population - New Zealand (%)
Place of birth for the foreign-born population - Fiji (%)
Place of birth for the foreign-born population - Micronesia (%)
Place of birth for the foreign-born population - Bahamas (%)
Place of birth for the foreign-born population - Barbados (%)
Place of birth for the foreign-born population - Cuba (%)
Place of birth for the foreign-born population - Dominica (%)
Place of birth for the foreign-born population - Dominican Republic (%)
Place of birth for the foreign-born population - Grenada (%)
Place of birth for the foreign-born population - Haiti (%)
Place of birth for the foreign-born population - Jamaica (%)
Place of birth for the foreign-born population - St. Vincent and the Grenadines (%)
Place of birth for the foreign-born population - Trinidad and Tobago (%)
Place of birth for the foreign-born population - West Indies (%)
Place of birth for the foreign-born population - Other Caribbean (%)
Place of birth for the foreign-born population - Belize (%)
Place of birth for the foreign-born population - Costa Rica (%)
Place of birth for the foreign-born population - El Salvador (%)
Place of birth for the foreign-born population - Guatemala (%)
Place of birth for the foreign-born population - Honduras (%)
Place of birth for the foreign-born population - Mexico (%)
Place of birth for the foreign-born population - Nicaragua (%)
Place of birth for the foreign-born population - Panama (%)
Place of birth for the foreign-born population - Other Central America (%)
Place of birth for the foreign-born population - Argentina (%)
Place of birth for the foreign-born population - Bolivia (%)
Place of birth for the foreign-born population - Brazil (%)
Place of birth for the foreign-born population - Chile (%)
Place of birth for the foreign-born population - Colombia (%)
Place of birth for the foreign-born population - Ecuador (%)
Place of birth for the foreign-born population - Guyana (%)
Place of birth for the foreign-born population - Peru (%)
Place of birth for the foreign-born population - Uruguay (%)
Place of birth for the foreign-born population - Venezuela (%)
Place of birth for the foreign-born population - Other South America (%)
Place of birth for the foreign-born population - Canada (%)
Place of birth for the foreign-born population - Other Northern America (%)
Place of birth for the foreign-born population - Other (%)
Latest news about races in Beaver, UT collected exclusively by city-data.com from local newspapers, TV, and radio stations
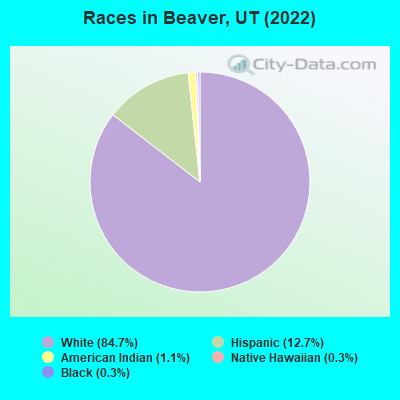
According to 2022 data, the most numerous races in Beaver, UT are White alone (3,127 residents), Hispanic (469 residents), and Two or more races (0 residents). 84.9% of Beaver residents speak English at home. 5.3% of Beaver, UT residents are foreign-born (4.0% born in Latin America, 0.6% born in Europe), which is 50.7% less than the foreign-born rate of 8.0% across the entire state of Utah.
Race distribution in Beaver
2000 2022
1,904,265 85.3% White alone 201,559 9.0% Hispanic 36,483 1.6% Asian alone 31,308 1.4% Two or more races 26,663 1.2% American Indian alone 14,806 0.7% Native Hawaiian and Other 16,137 0.7% Black alone 1,948 0.09% Other race alone
2,557,466 75.6% White alone 512,086 15.1% Hispanic 119,308 3.5% Two or more races 82,388 2.4% Asian alone 36,978 1.1% Native Hawaiian and Other 34,873 1.0% Black alone 22,803 0.7% American Indian alone 14,898 0.4% Other race alone
Income and house value in Beaver Median household income in 2022 $85,457 White non-Hispanic householdersMedian 2022 house value $350,540 White Non-Hispanic householders$315,923 Some other race householders$592,128 Two or more races householders$315,923 Hispanic or Latino householders
Median age by race in Beaver
40.0 Median age for White residents40.9 39.6 -640,726,328.8 Median age for Black or African American residents-620,437,955.6 -686,357,242.6 57.8 Median age for American Indian / Alaska Native residents-720,955,482.4 -694,006,308.5 -682,306,939.7 Median age for Asian residents-685,128,204.4 -679,775,280.2 -664,268,584.5 Median age for Native Hawaiian / Pacific Islander residents-659,420,289.2 -664,285,713.6 34.9 Median age for Other race residents34.0 35.8 42.7 Median age for Two or more races residents-704,845,814.3 -714,499,251.9 41.0 Median age for White alone residents41.9 39.8 33.9 Median age for Hispanic or Latino residents33.1 35.0
Owner/renter occupied households by race in Beaver
House owners and renters - White residents 1,041 81.8% Owner occupied232 18.2% Renter occupiedHouse owners and renters - American Indian / Alaska Native residents 13 100.0% Renter occupiedHouse owners and renters - Other race residents 23 39.5% Owner occupied35 60.5% Renter occupiedHouse owners and renters - White alone residents 1,010 80.9% Owner occupied238 19.1% Renter occupiedHouse owners and renters - Hispanic or Latino residents 68 68.6% Owner occupied31 31.4% Renter occupied
Language usage in Beaver
English speakers - Total 84.9% of residents of Beaver speak English at home.
11.8% of residents speak Spanish at home 216 53.6% Speak English very well187 46.4% Speak English less than very well3.4% of residents speak other language at home 58 49.6% Speak English very well59 50.4% Speak English less than very well
English speakers - Born in the United States 70.4% of residents of Beaver speak English at home.
17.2% of residents speak Spanish at home 115 100.0% Speak English very well12.3% of residents speak other language at home 57 69.5% Speak English very well25 30.5% Speak English less than very well
English speakers - Native, born elsewhere 0.0% of residents of Beaver speak English at home.
88.9% of residents speak Spanish at home 8 100.0% Speak English less than very well
English speakers - Foreign-born 5.1% of residents of Beaver speak English at home.
80.6% of residents speak Spanish at home 16 10.1% Speak English very well142 89.9% Speak English less than very well17.9% of residents speak other language at home 35 100.0% Speak English less than very well
White (Caucasian) - Speak another language Native:
4.5% (133)Foreign-born:
86.9% (39)
Other race - Speak another language Native:
93.1% (127)Foreign-born:
97.1% (119)
White alone - Speak another language Native:
2.7% (78)Foreign-born:
95.6% (22)
Hispanic or Latino - Speak another language Native:
76.0% (200)Foreign-born:
99.4% (151)
Foreign-born residents in Beaver 196 residents are foreign born (4.0% Latin America , 0.6% Europe ).
Marital status for residents in Beaver Marital status - White (Caucasian) population 15 years and over
Males 21.1% Never married66.2% Now married1.1% Separated0.0% Widowed11.7% DivorcedFemales 9.3% Never married76.9% Now married2.3% Separated5.3% Widowed6.2% DivorcedWomen who gave birth in the past 12 months Now married:
95.3% (142)Unmarried:
4.7% (7)
Women who did not give birth in the past 12 months Now married:
70.8% (366)Unmarried:
29.2% (151)
Marital status - American Indian / Alaska Native population 15 years and over
Males 62.1% Never married37.9% Now married0.0% Separated0.0% Widowed0.0% DivorcedFemales 0.0% Never married100.0% Now married0.0% Separated0.0% Widowed0.0% DivorcedMarital status - Other race population 15 years and over
Males 26.9% Never married73.1% Now married0.0% Separated0.0% Widowed0.0% DivorcedFemales 37.3% Never married62.7% Now married0.0% Separated0.0% Widowed0.0% DivorcedWomen who gave birth in the past 12 months Now married:
0.0% (0)Unmarried:
100.0% (21)
Women who did not give birth in the past 12 months Now married:
68.3% (32)Unmarried:
31.7% (15)
Marital status - Two or more races population 15 years and over
Males 0.0% Never married0.0% Now married0.0% Separated0.0% Widowed100.0% DivorcedFemales 100.0% Never married0.0% Now married0.0% Separated0.0% Widowed0.0% DivorcedWomen who did not give birth in the past 12 months Now married:
0.0% (0)Unmarried:
100.0% (15)
Marital status - White alone, not Hispanic / Latino population 15 years and over
Males 20.6% Never married66.0% Now married1.1% Separated0.0% Widowed12.3% DivorcedFemales 8.9% Never married76.7% Now married2.4% Separated5.5% Widowed6.5% DivorcedWomen who gave birth in the past 12 months Now married:
94.4% (122)Unmarried:
5.6% (7)
Women who did not give birth in the past 12 months Now married:
71.0% (353)Unmarried:
29.0% (144)
Marital status - Hispanic or Latino population 15 years and over
Males 26.6% Never married67.5% Now married0.0% Separated0.0% Widowed5.8% DivorcedFemales 35.1% Never married64.9% Now married0.0% Separated0.0% Widowed0.0% DivorcedWomen who gave birth in the past 12 months Now married:
56.1% (24)Unmarried:
43.9% (19)
Women who did not give birth in the past 12 months Now married:
59.0% (52)Unmarried:
41.0% (36)
Ancestries in Beaver
780 34.4% English278 12.2% American200 8.8% German116 5.1% Irish111 4.9% Scottish99 4.4% Ukrainian96 4.2% European45 2.0% Danish35 1.5% Scandinavian33 1.5% Scotch-Irish29 1.3% Swedish18 0.8% Dutch16 0.7% British9 0.4% Norwegian8 0.4% Eastern European8 0.4% Polish6 0.3% Italian
Children Nativity (place of birth) in Beaver
Children under 6 years - Living with two parents Both parents native 300 100.0% NativeBoth parents foreign-born 35 100.0% NativeChildren under 6 years - Living with one parent Foreign-born parent 15 100.0% NativeChildren 6 to 17 years - Living with two parents Both parents native 486 100.0% NativeBoth parents foreign-born 52 100.0% NativeChildren 6 to 17 years - Living with one parent Native parent 40 100.0% NativeForeign-born parent 27 50.7% Native26 49.3% Foreign-born
Place of birth for residents in Beaver 151 Americas151 Latin America151 Central America24 Europe24 Eastern Europe10 Asia10 South Eastern Asia10 Africa10 Western Africa