Races in Beech Grove, Indiana (IN) Detailed Stats
Data:
Races - White alone (%)
Races - White alone (% change since 2000)
Races - Black alone (%)
Races - Black alone (% change since 2000)
Races - American Indian alone (%)
Races - American Indian alone (% change since 2000)
Races - Asian alone (%)
Races - Asian alone (% change since 2000)
Races - Hispanic (%)
Races - Hispanic (% change since 2000)
Races - Native Hawaiian and Other Pacific Islander alone (%)
Races - Native Hawaiian and Other Pacific Islander alone (% change since 2000)
Races - Two or more races(%)
Races - Two or more races(% change since 2000)
Races - Other race alone (%)
Races - Other race alone (% change since 2000)
Racial diversity
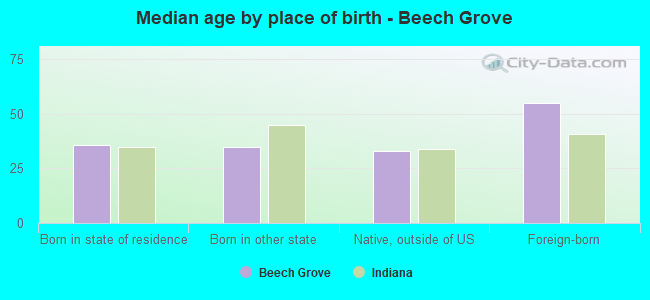
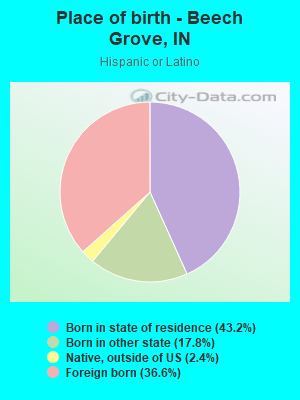
Place of birth - Born in state of residence (%)
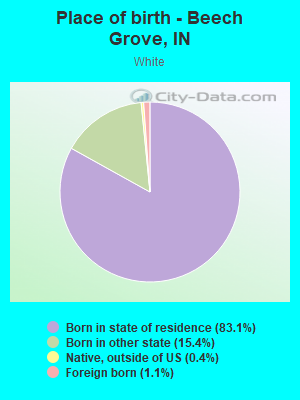
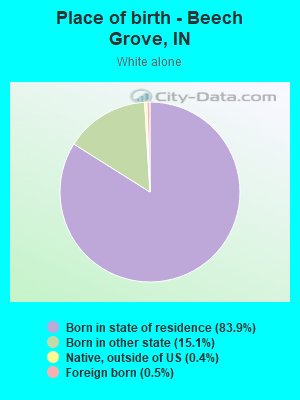
Place of birth - Born in state of residence (%) - White
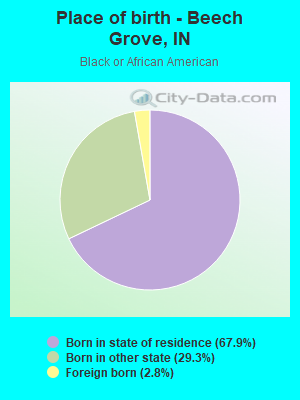
Place of birth - Born in state of residence (%) - Black or African American
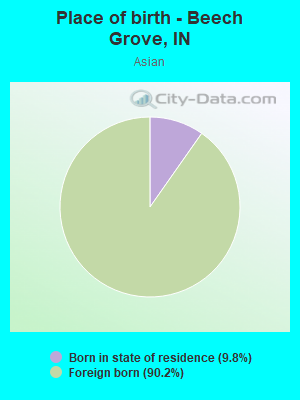
Place of birth - Born in state of residence (%) - Asian
Place of birth - Born in state of residence (%) - Hispanic or Latino
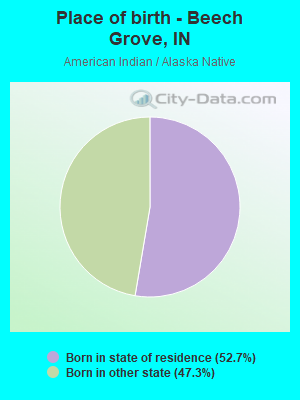
Place of birth - Born in state of residence (%) - American Indian and Alaska Native
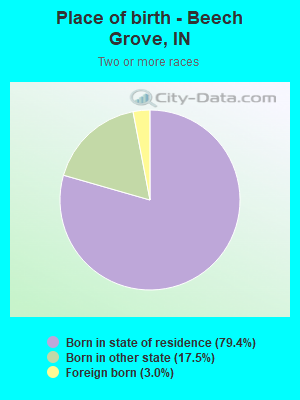
Place of birth - Born in state of residence (%) - Multirace
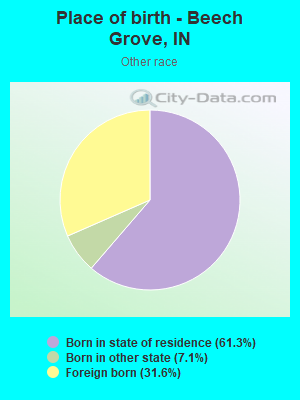
Place of birth - Born in state of residence (%) - Other Race
Place of birth - Born in other state (%)
Place of birth - Born in other state (%) - White
Place of birth - Born in other state (%) - Black or African American
Place of birth - Born in other state (%) - Asian
Place of birth - Born in other state (%) - Hispanic or Latino
Place of birth - Born in other state (%) - American Indian and Alaska Native
Place of birth - Born in other state (%) - Multirace
Place of birth - Born in other state (%) - Other Race
Place of birth - Native, outside of US (%)
Place of birth - Native, outside of US (%) - White
Place of birth - Native, outside of US (%) - Black or African American
Place of birth - Native, outside of US (%) - Asian
Place of birth - Native, outside of US (%) - Hispanic or Latino
Place of birth - Native, outside of US (%) - American Indian and Alaska Native
Place of birth - Native, outside of US (%) - Multirace
Place of birth - Native, outside of US (%) - Other Race
Place of birth - Foreign born (%)
Place of birth - Foreign born (%) - White
Place of birth - Foreign born (%) - Black or African American
Place of birth - Foreign born (%) - Asian
Place of birth - Foreign born (%) - Hispanic or Latino
Place of birth - Foreign born (%) - American Indian and Alaska Native
Place of birth - Foreign born (%) - Multirace
Place of birth - Foreign born (%) - Other Race
Residents speaking English at home (%)
Residents speaking English at home - Born in the United States (%)
Residents speaking English at home - Native, born elsewhere (%)
Residents speaking English at home - Foreign born (%)
Residents speaking Spanish at home (%)
Residents speaking Spanish at home - Born in the United States (%)
Residents speaking Spanish at home - Native, born elsewhere (%)
Residents speaking Spanish at home - Foreign born (%)
Residents speaking other language at home (%)
Residents speaking other language at home - Born in the United States (%)
Residents speaking other language at home - Native, born elsewhere (%)
Residents speaking other language at home - Foreign born (%)
Marital status - Never married (%)
Marital status - Now married (%)
Marital status - Separated (%)
Marital status - Widowed (%)
Marital status - Divorced (%)
Ancestries Reported - Arab (%)
Ancestries Reported - Czech (%)
Ancestries Reported - Danish (%)
Ancestries Reported - Dutch (%)
Ancestries Reported - English (%)
Ancestries Reported - French (%)
Ancestries Reported - French Canadian (%)
Ancestries Reported - German (%)
Ancestries Reported - Greek (%)
Ancestries Reported - Hungarian (%)
Ancestries Reported - Irish (%)
Ancestries Reported - Italian (%)
Ancestries Reported - Lithuanian (%)
Ancestries Reported - Norwegian (%)
Ancestries Reported - Polish (%)
Ancestries Reported - Portuguese (%)
Ancestries Reported - Russian (%)
Ancestries Reported - Scotch-Irish (%)
Ancestries Reported - Scottish (%)
Ancestries Reported - Slovak (%)
Ancestries Reported - Subsaharan African (%)
Ancestries Reported - Swedish (%)
Ancestries Reported - Swiss (%)
Ancestries Reported - Ukrainian (%)
Ancestries Reported - United States (%)
Ancestries Reported - Welsh (%)
Ancestries Reported - West Indian (%)
Ancestries Reported - Other (%)
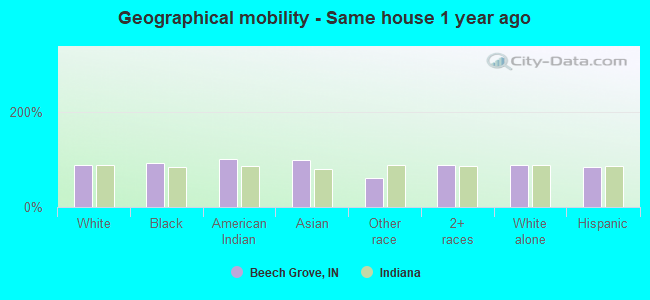
Geographical mobility - Same house 1 year ago (%)
Geographical mobility - Same house 1 year ago (%) - White
Geographical mobility - Same house 1 year ago (%) - Black or African American
Geographical mobility - Same house 1 year ago (%) - Asian
Geographical mobility - Same house 1 year ago (%) - Hispanic or Latino
Geographical mobility - Same house 1 year ago (%) - American Indian and Alaska Native
Geographical mobility - Same house 1 year ago (%) - Multirace
Geographical mobility - Same house 1 year ago (%) - Other Race
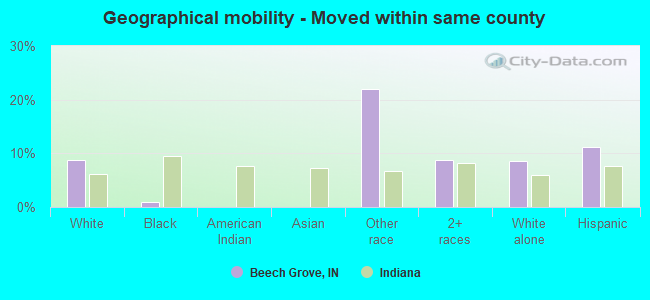
Geographical mobility - Moved within same county (%)
Geographical mobility - Moved within same county (%) - White
Geographical mobility - Moved within same county (%) - Black or African American
Geographical mobility - Moved within same county (%) - Asian
Geographical mobility - Moved within same county (%) - Hispanic or Latino
Geographical mobility - Moved within same county (%) - American Indian and Alaska Native
Geographical mobility - Moved within same county (%) - Multirace
Geographical mobility - Moved within same county (%) - Other Race
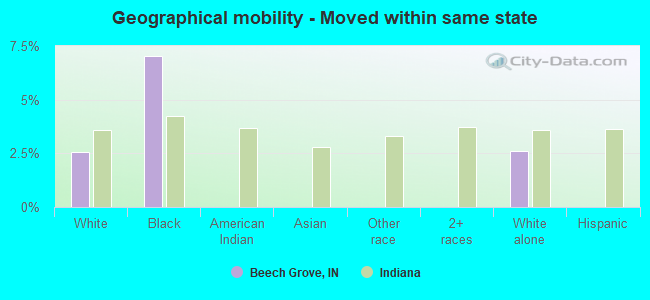
Geographical mobility - Moved from different county within same state (%)
Geographical mobility - Moved from different county within same state (%) - White
Geographical mobility - Moved from different county within same state (%) - Black or African American
Geographical mobility - Moved from different county within same state (%) - Asian
Geographical mobility - Moved from different county within same state (%) - Hispanic or Latino
Geographical mobility - Moved from different county within same state (%) - American Indian and Alaska Native
Geographical mobility - Moved from different county within same state (%) - Multirace
Geographical mobility - Moved from different county within same state (%) - Other Race
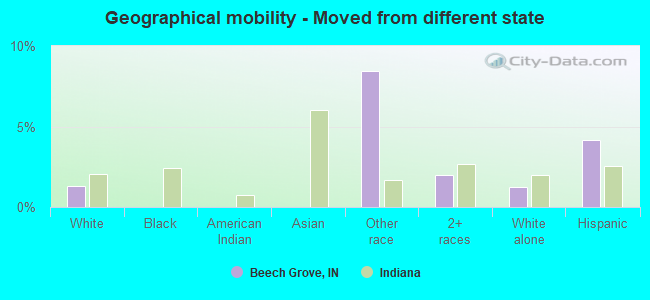
Geographical mobility - Moved from different state (%)
Geographical mobility - Moved from different state (%) - White
Geographical mobility - Moved from different state (%) - Black or African American
Geographical mobility - Moved from different state (%) - Asian
Geographical mobility - Moved from different state (%) - Hispanic or Latino
Geographical mobility - Moved from different state (%) - American Indian and Alaska Native
Geographical mobility - Moved from different state (%) - Multirace
Geographical mobility - Moved from different state (%) - Other Race
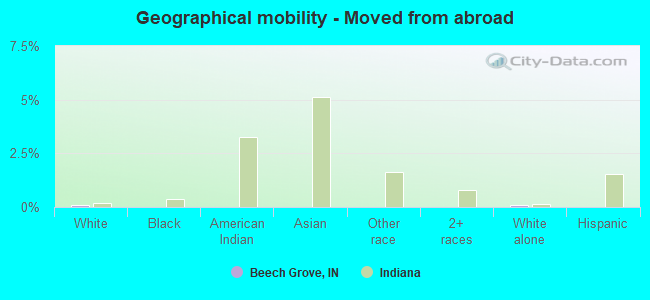
Geographical mobility - Moved from abroad (%)
Geographical mobility - Moved from abroad (%) - White
Geographical mobility - Moved from abroad (%) - Black or African American
Geographical mobility - Moved from abroad (%) - Asian
Geographical mobility - Moved from abroad (%) - Hispanic or Latino
Geographical mobility - Moved from abroad (%) - American Indian and Alaska Native
Geographical mobility - Moved from abroad (%) - Multirace
Geographical mobility - Moved from abroad (%) - Other Race
Place of birth for the foreign-born population - Ireland (%)
Place of birth for the foreign-born population - Denmark (%)
Place of birth for the foreign-born population - Norway (%)
Place of birth for the foreign-born population - Sweden (%)
Place of birth for the foreign-born population - United Kingdom (%)
Place of birth for the foreign-born population - England (%)
Place of birth for the foreign-born population - Scotland (%)
Place of birth for the foreign-born population - Other Northern Europe (%)
Place of birth for the foreign-born population - Austria (%)
Place of birth for the foreign-born population - Belgium (%)
Place of birth for the foreign-born population - France (%)
Place of birth for the foreign-born population - Germany (%)
Place of birth for the foreign-born population - Netherlands (%)
Place of birth for the foreign-born population - Switzerland (%)
Place of birth for the foreign-born population - Other Western Europe (%)
Place of birth for the foreign-born population - Greece (%)
Place of birth for the foreign-born population - Italy (%)
Place of birth for the foreign-born population - Portugal (%)
Place of birth for the foreign-born population - Spain (%)
Place of birth for the foreign-born population - Other Southern Europe (%)
Place of birth for the foreign-born population - Albania (%)
Place of birth for the foreign-born population - Belarus (%)
Place of birth for the foreign-born population - Bosnia and Herzegovina (%)
Place of birth for the foreign-born population - Bulgaria (%)
Place of birth for the foreign-born population - Croatia (%)
Place of birth for the foreign-born population - Czechoslovakia (%)
Place of birth for the foreign-born population - Hungary (%)
Place of birth for the foreign-born population - Latvia (%)
Place of birth for the foreign-born population - Lithuania (%)
Place of birth for the foreign-born population - North Macedonia (Macedonia) (%)
Place of birth for the foreign-born population - Moldova (%)
Place of birth for the foreign-born population - Poland (%)
Place of birth for the foreign-born population - Romania (%)
Place of birth for the foreign-born population - Russia (%)
Place of birth for the foreign-born population - Serbia (%)
Place of birth for the foreign-born population - Ukraine (%)
Place of birth for the foreign-born population - Other Eastern Europe (%)
Place of birth for the foreign-born population - China (%)
Place of birth for the foreign-born population - Hong Kong (%)
Place of birth for the foreign-born population - Taiwan (%)
Place of birth for the foreign-born population - Japan (%)
Place of birth for the foreign-born population - Korea (%)
Place of birth for the foreign-born population - Other Eastern Asia (%)
Place of birth for the foreign-born population - Afghanistan (%)
Place of birth for the foreign-born population - Bangladesh (%)
Place of birth for the foreign-born population - India (%)
Place of birth for the foreign-born population - Iran (%)
Place of birth for the foreign-born population - Kazakhstan (%)
Place of birth for the foreign-born population - Nepal (%)
Place of birth for the foreign-born population - Pakistan (%)
Place of birth for the foreign-born population - Sri Lanka (%)
Place of birth for the foreign-born population - Uzbekistan (%)
Place of birth for the foreign-born population - Other South Central Asia (%)
Place of birth for the foreign-born population - Burma (%)
Place of birth for the foreign-born population - Cambodia (%)
Place of birth for the foreign-born population - Indonesia (%)
Place of birth for the foreign-born population - Laos (%)
Place of birth for the foreign-born population - Malaysia (%)
Place of birth for the foreign-born population - Philippines (%)
Place of birth for the foreign-born population - Singapore (%)
Place of birth for the foreign-born population - Thailand (%)
Place of birth for the foreign-born population - Vietnam (%)
Place of birth for the foreign-born population - Other South Eastern Asia (%)
Place of birth for the foreign-born population - Armenia (%)
Place of birth for the foreign-born population - Iraq (%)
Place of birth for the foreign-born population - Israel (%)
Place of birth for the foreign-born population - Jordan (%)
Place of birth for the foreign-born population - Kuwait (%)
Place of birth for the foreign-born population - Lebanon (%)
Place of birth for the foreign-born population - Saudi Arabia (%)
Place of birth for the foreign-born population - Syria (%)
Place of birth for the foreign-born population - Turkey (%)
Place of birth for the foreign-born population - Yemen (%)
Place of birth for the foreign-born population - Other Western Asia (%)
Place of birth for the foreign-born population - Eritrea (%)
Place of birth for the foreign-born population - Ethiopia (%)
Place of birth for the foreign-born population - Kenya (%)
Place of birth for the foreign-born population - Somalia (%)
Place of birth for the foreign-born population - Uganda (%)
Place of birth for the foreign-born population - Zimbabwe (%)
Place of birth for the foreign-born population - Other Eastern Africa (%)
Place of birth for the foreign-born population - Cameroon (%)
Place of birth for the foreign-born population - Congo (%)
Place of birth for the foreign-born population - Democratic Republic of Congo (Zaire) (%)
Place of birth for the foreign-born population - Other Middle Africa (%)
Place of birth for the foreign-born population - Egypt (%)
Place of birth for the foreign-born population - Morocco (%)
Place of birth for the foreign-born population - Sudan (%)
Place of birth for the foreign-born population - Other Northern Africa (%)
Place of birth for the foreign-born population - South Africa (%)
Place of birth for the foreign-born population - Other Southern Africa (%)
Place of birth for the foreign-born population - Cabo Verde (%)
Place of birth for the foreign-born population - Ghana (%)
Place of birth for the foreign-born population - Liberia (%)
Place of birth for the foreign-born population - Nigeria (%)
Place of birth for the foreign-born population - Senegal (%)
Place of birth for the foreign-born population - Sierra Leone (%)
Place of birth for the foreign-born population - Other Western Africa (%)
Place of birth for the foreign-born population - Australia (%)
Place of birth for the foreign-born population - New Zealand (%)
Place of birth for the foreign-born population - Fiji (%)
Place of birth for the foreign-born population - Micronesia (%)
Place of birth for the foreign-born population - Bahamas (%)
Place of birth for the foreign-born population - Barbados (%)
Place of birth for the foreign-born population - Cuba (%)
Place of birth for the foreign-born population - Dominica (%)
Place of birth for the foreign-born population - Dominican Republic (%)
Place of birth for the foreign-born population - Grenada (%)
Place of birth for the foreign-born population - Haiti (%)
Place of birth for the foreign-born population - Jamaica (%)
Place of birth for the foreign-born population - St. Vincent and the Grenadines (%)
Place of birth for the foreign-born population - Trinidad and Tobago (%)
Place of birth for the foreign-born population - West Indies (%)
Place of birth for the foreign-born population - Other Caribbean (%)
Place of birth for the foreign-born population - Belize (%)
Place of birth for the foreign-born population - Costa Rica (%)
Place of birth for the foreign-born population - El Salvador (%)
Place of birth for the foreign-born population - Guatemala (%)
Place of birth for the foreign-born population - Honduras (%)
Place of birth for the foreign-born population - Mexico (%)
Place of birth for the foreign-born population - Nicaragua (%)
Place of birth for the foreign-born population - Panama (%)
Place of birth for the foreign-born population - Other Central America (%)
Place of birth for the foreign-born population - Argentina (%)
Place of birth for the foreign-born population - Bolivia (%)
Place of birth for the foreign-born population - Brazil (%)
Place of birth for the foreign-born population - Chile (%)
Place of birth for the foreign-born population - Colombia (%)
Place of birth for the foreign-born population - Ecuador (%)
Place of birth for the foreign-born population - Guyana (%)
Place of birth for the foreign-born population - Peru (%)
Place of birth for the foreign-born population - Uruguay (%)
Place of birth for the foreign-born population - Venezuela (%)
Place of birth for the foreign-born population - Other South America (%)
Place of birth for the foreign-born population - Canada (%)
Place of birth for the foreign-born population - Other Northern America (%)
Place of birth for the foreign-born population - Other (%)
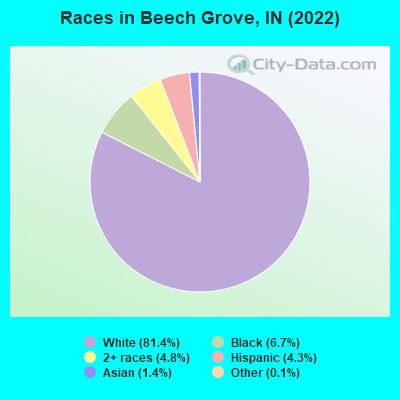
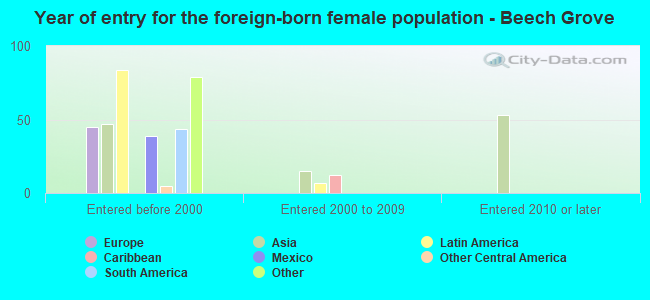
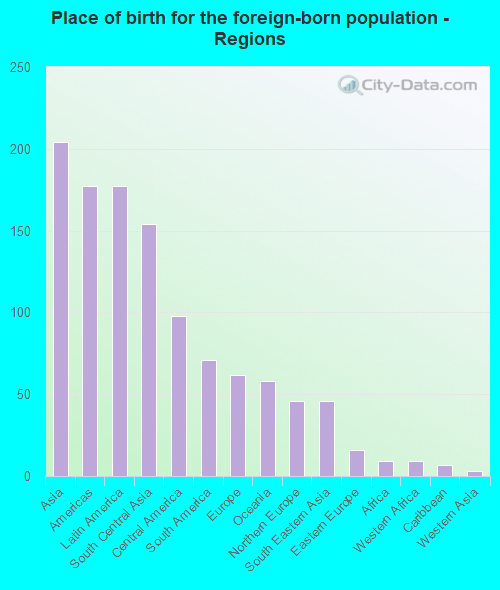
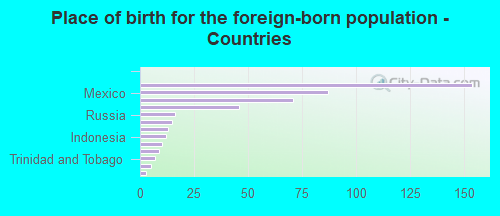
According to 2022 data, the most numerous races in Beech Grove, IN are White alone (12,334 residents), Black alone (1,010 residents), and Hispanic (647 residents). 93.9% of Beech Grove residents speak English at home. 3.4% of Beech Grove, IN residents are foreign-born (1.2% born in Asia, 1.1% born in Latin America, 0.4% born in Europe, 0.3% born in Oceania), which is 77.5% less than the foreign-born rate of 6.0% across the entire state of Indiana.
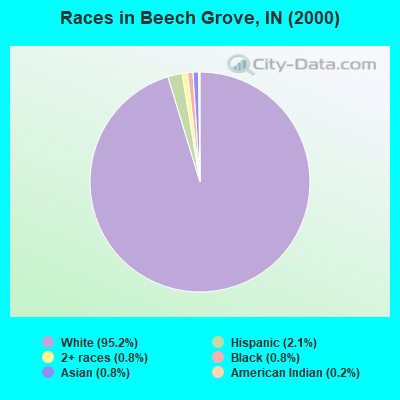
Race distribution in Beech Grove
2000 2022
5,219,373 85.8% White alone 505,462 8.3% Black alone 214,536 3.5% Hispanic 61,115 1.0% Two or more races 58,424 1.0% Asian alone 13,654 0.2% American Indian alone 6,348 0.1% Other race alone 1,573 0.03% Native Hawaiian and Other
5,192,455 76.0% White alone 628,054 9.2% Black alone 534,528 7.8% Hispanic 263,242 3.9% Two or more races 172,880 2.5% Asian alone 33,467 0.5% Other race alone 5,866 0.09% American Indian alone 2,545 0.04% Native Hawaiian and Other
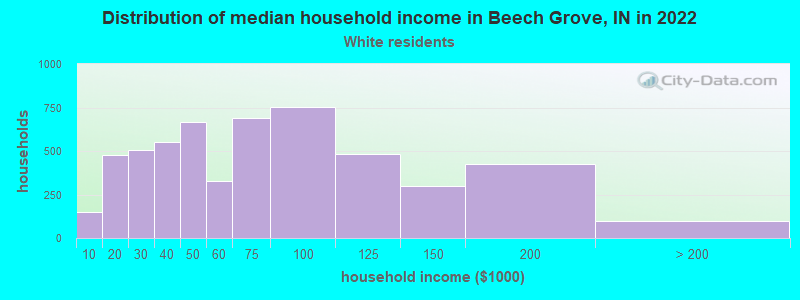
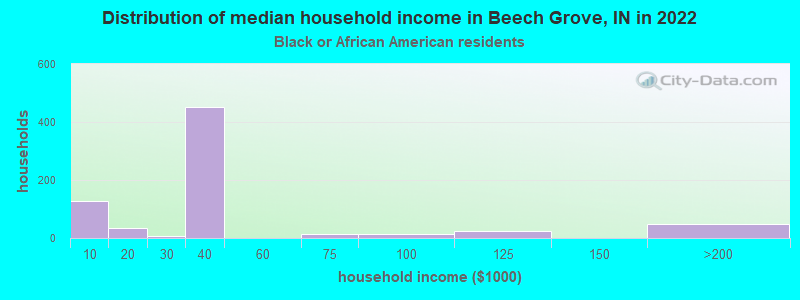
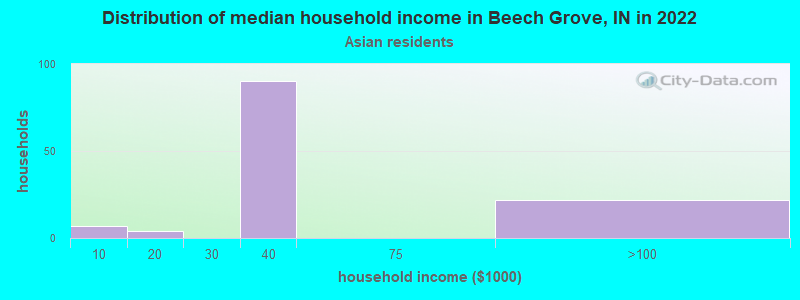
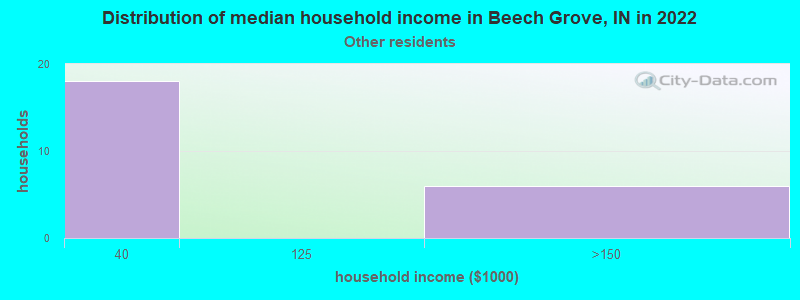
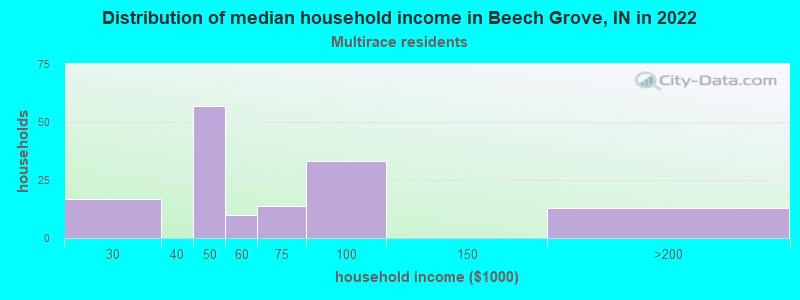
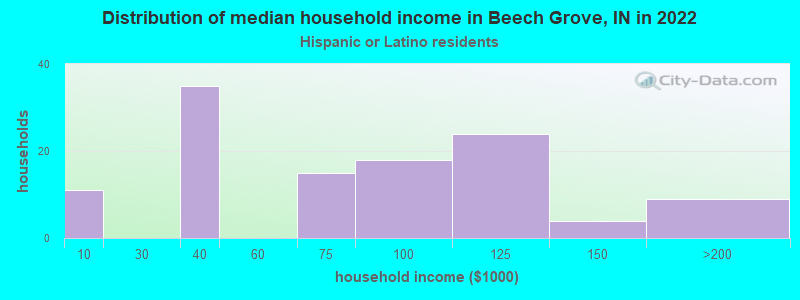
Income and house value in Beech Grove Median household income in 2022 $61,572 White non-Hispanic householders$38,890 Black householders$46,743 Two or more races householdersMedian 2022 house value $168,382 White Non-Hispanic householders$218,466 Black or African American householders $152,585 Asian householders$807,805 Two or more races householders
Median age by race in Beech Grove
38.3 Median age for White residents37.0 39.8 37.4 Median age for Black or African American residents34.7 36.9 -638,352,637.7 Median age for American Indian / Alaska Native residents-786,377,708.2 -612,021,857.3 52.9 Median age for Asian residents-664,502,163.8 34.8 -664,335,663.7 Median age for Native Hawaiian / Pacific Islander residents-644,025,156.6 -664,437,011.6 61.4 Median age for Other race residents-674,448,767.2 65.1 12.8 Median age for Two or more races residents13.1 12.1 38.3 Median age for White alone residents37.1 39.4 18.6 Median age for Hispanic or Latino residents17.8 33.1
Owner/renter occupied households by race in Beech Grove
House owners and renters - White residents 3,418 62.0% Owner occupied2,093 38.0% Renter occupiedHouse owners and renters - Black or African American residents 85 13.2% Owner occupied558 86.8% Renter occupiedHouse owners and renters - American Indian / Alaska Native residents 12 100.0% Renter occupiedHouse owners and renters - Asian residents 94 77.2% Owner occupied28 22.8% Renter occupiedHouse owners and renters - Other race residents 4 21.3% Owner occupied15 78.7% Renter occupiedHouse owners and renters - Two or more races residents 97 64.3% Owner occupied54 35.7% Renter occupiedHouse owners and renters - White alone residents 3,412 61.4% Owner occupied2,142 38.6% Renter occupiedHouse owners and renters - Hispanic or Latino residents 71 64.8% Owner occupied39 35.2% Renter occupied
Language usage in Beech Grove
English speakers - Total 93.9% of residents of Beech Grove speak English at home.
1.5% of residents speak Spanish at home 97 47.1% Speak English very well109 52.9% Speak English less than very well1.9% of residents speak other language at home 129 48.7% Speak English very well136 51.3% Speak English less than very well
English speakers - Born in the United States 96.3% of residents of Beech Grove speak English at home.
2.8% of residents speak Spanish at home 64 100.0% Speak English very well0.1% of residents speak other language at home 3 100.0% Speak English less than very well
All residents speak only English at home
English speakers - Foreign-born 48.5% of residents of Beech Grove speak English at home.
10.2% of residents speak Spanish at home 7 12.3% Speak English very well50 87.7% Speak English less than very well30.7% of residents speak other language at home 37 21.6% Speak English very well134 78.4% Speak English less than very well
White (Caucasian) - Speak only English Native:
99.4% (11,355)Foreign-born:
92.5% (130)
White (Caucasian) - Speak another language Native:
1.0% (119)Foreign-born:
15.2% (21)
Black or African American - Speak only English Native:
97.0% (835)Foreign-born:
59.4% (16)
Asian - Speak only English Native:
96.9% (20)Foreign-born:
35.3% (64)
Other race - Speak another language Native:
68.1% (16)Foreign-born:
98.9% (12)
Two or more races - Speak another language Native:
4.6% (37)Foreign-born:
100.0% (26)
White alone - Speak only English Native:
99.4% (11,294)Foreign-born:
73.2% (47)
White alone - Speak another language Native:
0.6% (72)Foreign-born:
27.4% (18)
Hispanic or Latino - Speak only English Native:
71.9% (240)Foreign-born:
42.9% (101)
Hispanic or Latino - Speak another language Native:
24.6% (82)Foreign-born:
23.7% (56)
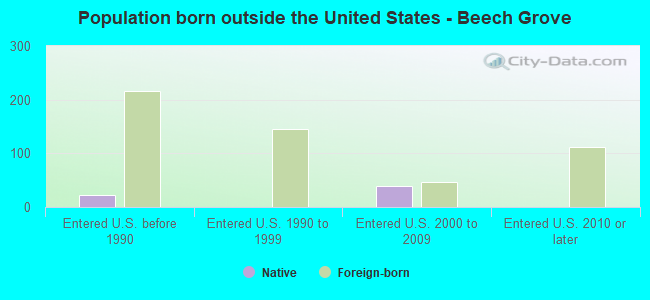
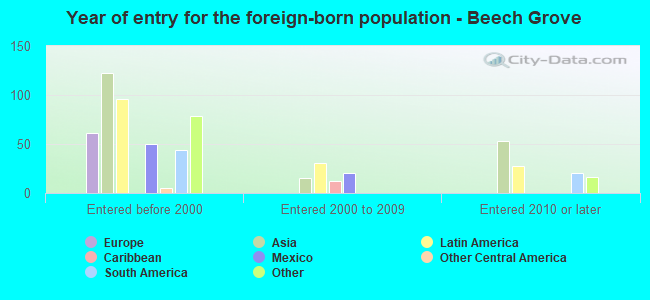
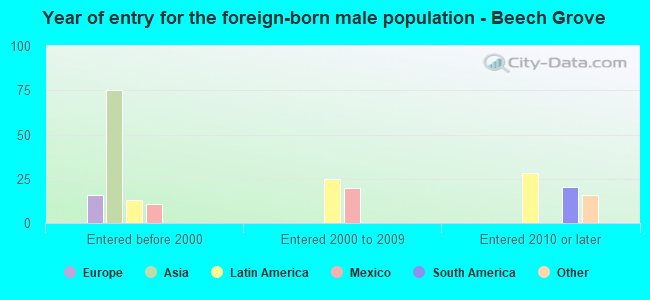
Foreign-born residents in Beech Grove 512 residents are foreign born (1.2% Asia , 1.1% Latin America , 0.4% Europe , 0.3% Oceania ).
This city:
3.4%Indiana:
5.6%
Marital status for residents in Beech Grove Marital status - White (Caucasian) population 15 years and over
Males 35.4% Never married46.8% Now married1.3% Separated2.6% Widowed13.8% DivorcedFemales 35.7% Never married36.8% Now married1.8% Separated6.3% Widowed19.4% DivorcedWomen who gave birth in the past 12 months Now married:
50.7% (96)Unmarried:
49.3% (93)
Women who did not give birth in the past 12 months Now married:
38.2% (1,117)Unmarried:
61.8% (1,806)
Marital status - Black or African American population 15 years and over
Males 51.6% Never married35.6% Now married0.0% Separated0.0% Widowed12.9% DivorcedFemales 92.0% Never married1.7% Now married0.0% Separated0.0% Widowed6.3% DivorcedWomen who did not give birth in the past 12 months Now married:
1.1% (7)Unmarried:
98.9% (632)
Marital status - Asian population 15 years and over
Males 0.0% Never married13.9% Now married0.0% Separated0.0% Widowed86.1% DivorcedFemales 0.0% Never married94.3% Now married0.0% Separated0.0% Widowed5.7% DivorcedWomen who did not give birth in the past 12 months Now married:
89.8% (58)Unmarried:
10.2% (7)
Marital status - Two or more races population 15 years and over
Males 43.4% Never married34.1% Now married0.0% Separated0.0% Widowed22.5% DivorcedFemales 34.5% Never married42.4% Now married0.0% Separated0.0% Widowed23.0% DivorcedWomen who did not give birth in the past 12 months Now married:
17.6% (19)Unmarried:
82.4% (87)
Marital status - White alone, not Hispanic / Latino population 15 years and over
Males 34.9% Never married47.0% Now married1.3% Separated2.7% Widowed14.0% DivorcedFemales 35.1% Never married36.6% Now married1.9% Separated6.5% Widowed19.9% DivorcedWomen who gave birth in the past 12 months Now married:
50.7% (99)Unmarried:
49.3% (96)
Women who did not give birth in the past 12 months Now married:
37.1% (1,083)Unmarried:
62.9% (1,836)
Marital status - Hispanic or Latino population 15 years and over
Males 47.6% Never married40.2% Now married0.0% Separated0.0% Widowed12.2% DivorcedFemales 45.9% Never married46.3% Now married4.1% Separated0.0% Widowed3.7% DivorcedWomen who did not give birth in the past 12 months Now married:
73.0% (107)Unmarried:
27.0% (40)
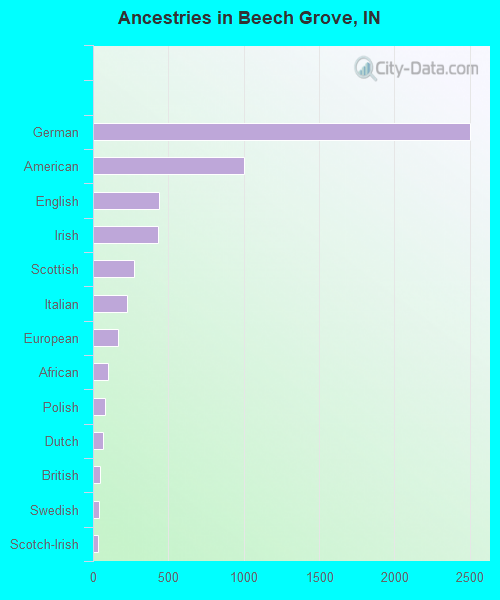
Ancestries in Beech Grove
2,502 35.5% German1,004 14.3% American435 6.2% English430 6.1% Irish273 3.9% Scottish228 3.2% Italian168 2.4% European101 1.4% African78 1.1% Polish68 1.0% Dutch45 0.6% British42 0.6% Swedish30 0.4% Scotch-Irish16 0.2% French15 0.2% French Canadian14 0.2% Russian13 0.2% Scandinavian12 0.2% Serbian10 0.1% Armenian9 0.1% Welsh6 0.09% Slovak5 0.07% Greek5 0.07% Hungarian4 0.06% Bulgarian3 0.04% Turkish
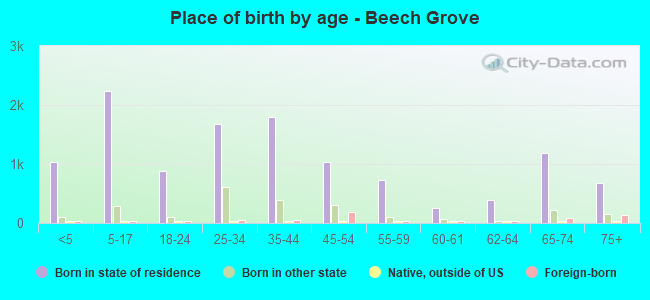
Children Nativity (place of birth) in Beech Grove
Children under 6 years - Living with two parents Both parents native 685 100.0% NativeBoth parents foreign-born 52 100.0% NativeChildren under 6 years - Living with one parent Native parent 435 100.0% NativeForeign-born parent 12 100.0% NativeChildren 6 to 17 years - Living with two parents Both parents native 1,557 100.0% NativeBoth parents foreign-born 36 100.0% NativeOne native, one foreign-born parent 85 100.0% NativeChildren 6 to 17 years - Living with one parent Native parent 751 100.0% NativeForeign-born parent 19 54.9% Native16 45.1% Foreign-born
Grandparents responsible for own grandchildren in Beech Grove
Grandparents (30 to 59 years) White / Caucasian 72 77.8% Responsible for grandchildren21 22.2% Not responsible for grandchildrenBlack or African American 14 100.0% Not responsible for grandchildrenWhite alone, not Hispanic / Latino 79 73.2% Responsible for grandchildren29 26.8% Not responsible for grandchildrenGrandparents (60 years and over) White / Caucasian 19 21.5% Responsible for grandchildren68 78.5% Not responsible for grandchildrenWhite alone, not Hispanic / Latino 21 22.3% Responsible for grandchildren72 77.7% Not responsible for grandchildren