Races in Bellerive, Missouri (MO) Detailed Stats
Ancestries, Foreign-born residents, place of birth

Recent posts about races in Bellerive, Missouri on our local forum with over 2,400,000 registered users:
 | Where to live near UMSL? (23 replies) |
| Moving with Family to St. Louis (12 replies) |
| Webster Grove or CWE for families? (40 replies) |
| Information on Cardondelet neighborhood (25 replies) |
| So...where did YOU go to high school? (186 replies) |
| "Off the Map" St. Louis (7 replies) |
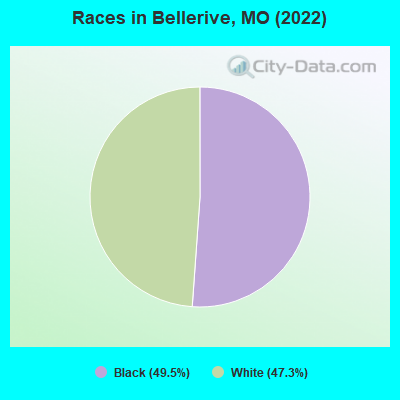
According to 2022 data, the most numerous races in Bellerive, MO are White alone (87 residents), Black alone (91 residents), and Two or more races (0 residents). 97.3% of Bellerive residents speak English at home. 1.6% of Bellerive, MO residents are foreign-born , which is 145.3% less than the foreign-born rate of 4.0% across the entire state of Missouri.
Race distribution in Bellerive

2000
2022

- 4,686,47483.8%White alone
- 625,66711.2%Black alone
- 118,5922.1%Hispanic
- 71,9051.3%Two or more races
- 61,0411.1%Asian alone
- 23,3020.4%American Indian alone
- 5,2910.09%Other race alone
- 2,9390.05%Native Hawaiian and Other
Pacific Islander alone

-
- 4,733,41176.6%White alone
- 656,73910.6%Black alone
- 316,3005.1%Two or more races
- 291,7634.7%Hispanic
- 132,4362.1%Asian alone
- 27,4670.4%Other race alone
- 12,3130.2%American Indian alone
- 7,5280.1%Native Hawaiian and Other
Pacific Islander alone

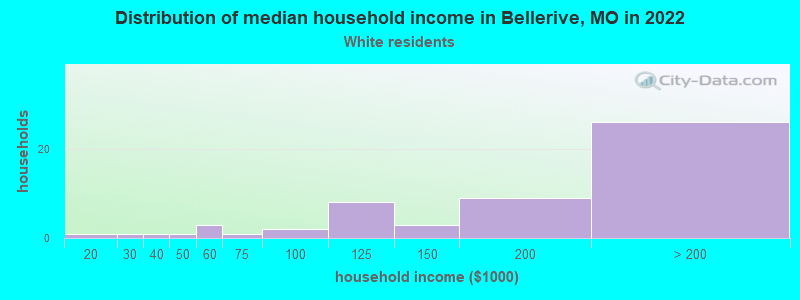
Income and house value in Bellerive
- Median household income in 2022
- $176,109White non-Hispanic householders
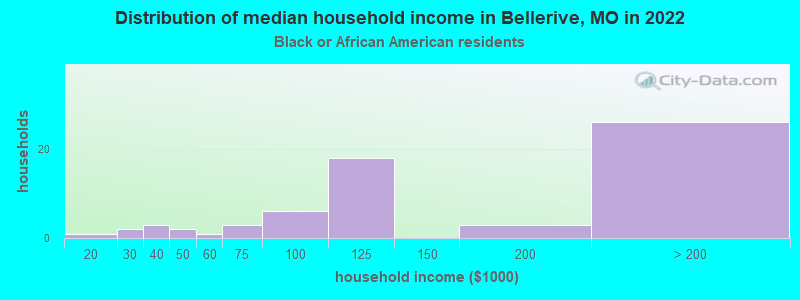
- $170,366Black householders
- Median 2022 house value
- $419,242White Non-Hispanic householders
- $417,400Black or African American householders
Household income for White non-Hispanic householders
Household income for Black householders
Median age by race in Bellerive
- 61.5Median age for White residents
- 60.4Males
- 65.1Females
- 64.3Median age for Black or African American residents
- 60.4Males
- 66.8Females
- 61.5Median age for White alone residents
- 60.4Males
- 64.9Females
Owner/renter occupied households by race in Bellerive
- House owners and renters - White residents
- 3591.6%Owner occupied
- 38.4%Renter occupied
- House owners and renters - Black or African American residents
- 3388.6%Owner occupied
- 411.4%Renter occupied
- House owners and renters - White alone residents
- 3491.6%Owner occupied
- 38.4%Renter occupied
Language usage in Bellerive
- English speakers - Total
- 97.3% of residents of Bellerive speak English at home.
- 1.6% of residents speak Spanish at home
- 3100.0%Speak English very well
- English speakers - Born in the United States
- 98.5% of residents of Bellerive speak English at home.
- 1.5% of residents speak Spanish at home
- 1100.0%Speak English very well
All residents speak only English at home
All residents speak only English at home
White (Caucasian) - Speak only English
| Native: | 96.1% (80) |
| Foreign-born: | 100.0% (1) |
Black or African American - Speak only English
| Native: | 100.0% (89) |
| Foreign-born: | 100.0% (2) |
White alone - Speak only English
| Native: | 96.4% (80) |
| Foreign-born: | 84.9% (1) |
Foreign-born residents in Bellerive
3 residents are foreign born
| This city: | 1.6% |
| Missouri: | 100.0% |


Marital status for residents in Bellerive
Marital status - White (Caucasian) population 15 years and over
- Males
- 26.1%Never married
- 63.0%Now married
- 2.2%Separated
- 2.2%Widowed
- 6.5%Divorced
- Females
- 13.2%Never married
- 73.7%Now married
- 0.0%Separated
- 10.5%Widowed
- 2.6%Divorced
Women who did not give birth in the past 12 months
| Now married: | 66.7% (7) |
| Unmarried: | 33.3% (4) |
Marital status - Black or African American population 15 years and over
- Males
- 29.0%Never married
- 71.0%Now married
- 0.0%Separated
- 0.0%Widowed
- 0.0%Divorced
- Females
- 16.0%Never married
- 46.0%Now married
- 0.0%Separated
- 24.0%Widowed
- 14.0%Divorced
Women who did not give birth in the past 12 months
| Now married: | 21.4% (3) |
| Unmarried: | 78.6% (11) |
Marital status - White alone, not Hispanic / Latino population 15 years and over
- Males
- 26.1%Never married
- 63.0%Now married
- 2.2%Separated
- 2.2%Widowed
- 6.5%Divorced
- Females
- 13.2%Never married
- 73.7%Now married
- 0.0%Separated
- 10.5%Widowed
- 2.6%Divorced
Women who did not give birth in the past 12 months
| Now married: | 66.7% (7) |
| Unmarried: | 33.3% (4) |
Ancestries in Bellerive

- 1411.6%German
- 1310.7%European
- 54.1%American
- 21.7%African
- 10.8%Croatian
- 10.8%English
- 10.8%Irish
- 10.8%Northern European

Geographical mobility in Bellerive

- Same house 1 year ago
- 8698.9%White (Caucasian)
- 8593.9%Black or African American
- 8698.6%White alone, not Hispanic / Latino

-
- Moved within same county
- 22.1%White / Caucasian
- 88.4%Black or African American
- 22.1%White alone, not Hispanic / Latino

Children Nativity (place of birth) in Bellerive
Place of birth for residents in Bellerive
![Place of birth for the foreign-born population - Regions]()
- 3Americas
- 2Latin America
- 2South America
- 1Northern America

Grandparents responsible for own grandchildren in Bellerive
Zip codes: 63121.