Races in Bellerose Terrace, New York (NY) Detailed Stats
Ancestries, Foreign-born residents, place of birth
Settings
X


Recent posts about races in Bellerose Terrace, New York on our local forum with over 2,400,000 registered users:
 | Mineola or New Hyde Park for school? (13 replies) |
| Any info on Bellerose Village? (12 replies) |
| Tell Me About Floral Park (Nassau) North of Jericho (60 replies) |
| Great Eastern Mills in Elmont, NY (107 replies) |
| Anyone from Elmont? (68 replies) |
| Nice Suburbs bordering Queens and Long Island? (45 replies) |
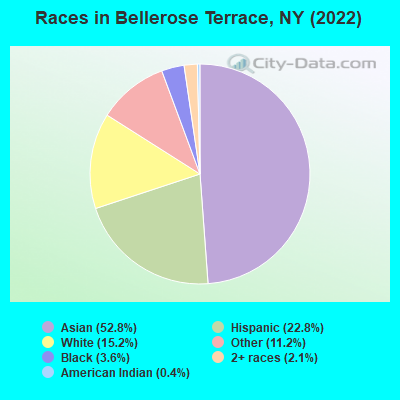
According to 2022 data, the most numerous races in Bellerose Terrace, NY are White alone (324 residents), Hispanic (485 residents), and Black alone (77 residents). 29.7% of Bellerose Terrace residents speak English at home. 53.9% of Bellerose Terrace, NY residents are foreign-born (36.0% born in Asia, 15.7% born in Latin America), which is 59.2% greater than the foreign-born rate of 22.0% across the entire state of New York.
Race distribution in Bellerose Terrace
2000
2022

- 1,17654.5%White alone
- 42919.9%Hispanic
- 33715.6%Asian alone
- 1225.7%Black alone
- 552.5%Two or more races
- 331.5%Other race alone
- 40.2%American Indian alone
- 10.05%Native Hawaiian and Other
Pacific Islander alone

-
- 1,12252.8%Asian alone
- 48522.8%Hispanic
- 32415.2%White alone
- 23911.2%Other race alone
- 773.6%Black alone
- 452.1%Two or more races
- 80.4%American Indian alone
2000
2022
-
- 11,760,98162.0%White alone
- 2,867,58315.1%Hispanic
- 2,812,62314.8%Black alone
- 1,035,9265.5%Asian alone
- 366,1161.9%Two or more races
- 75,4990.4%Other race alone
- 52,4990.3%American Indian alone
- 5,2300.03%Native Hawaiian and Other
Pacific Islander alone

-
- 10,408,93352.9%White alone
- 3,867,29919.7%Hispanic
- 2,633,84013.4%Black alone
- 1,776,2869.0%Asian alone
- 732,6703.7%Two or more races
- 216,1101.1%Other race alone
- 35,0820.2%American Indian alone
- 6,9310.04%Native Hawaiian and Other
Pacific Islander alone

Income and house value in Bellerose Terrace
- Median household income in 2022
- $110,706White non-Hispanic householders
- $110,904Asian householders
- $165,234Some other race householders
- $87,106Hispanic or Latino race householders
- Median 2022 house value
- $534,869White Non-Hispanic householders
- $500,071Black or African American householders
- $605,664Asian householders
- $623,363Some other race householders
- $586,466Two or more races householders
- $605,664Hispanic or Latino householders
Household income for White non-Hispanic householders

Household income for Black householders

Household income for American Indian and Alaska Native householders

Household income for Asian householders

Household income for Some other race householders

Household income for Two or more races householders

Household income for Hispanic or Latino race householders

Median age by race in Bellerose Terrace
- 56.3Median age for White residents
- 54.3Males
- 59.9Females
- 45.7Median age for Black or African American residents
- -666,666,666.0Males
- 47.2Females
- 59.4Median age for American Indian / Alaska Native residents
- 8.9Males
- -837,121,211.3Females
- 32.6Median age for Asian residents
- 27.9Males
- 42.0Females
- -487,992,314.6Median age for Native Hawaiian / Pacific Islander residents
- -477,502,295.2Males
- -497,387,669.3Females
- 48.2Median age for Other race residents
- 48.3Males
- 67.3Females
- 44.1Median age for Two or more races residents
- 51.0Males
- 44.2Females
- 55.3Median age for White alone residents
- 55.3Males
- 55.6Females
- 45.6Median age for Hispanic or Latino residents
- 46.3Males
- 45.2Females
Owner/renter occupied households by race in Bellerose Terrace
- House owners and renters - White residents
- 9158.4%Owner occupied
- 6541.6%Renter occupied
- House owners and renters - Black or African American residents
- 26100.0%Owner occupied
- House owners and renters - American Indian / Alaska Native residents
- 41100.0%Owner occupied
- House owners and renters - Asian residents
- 24491.6%Owner occupied
- 228.4%Renter occupied
- House owners and renters - Other race residents
- 23097.7%Owner occupied
- 52.3%Renter occupied
- House owners and renters - Two or more races residents
- 5867.7%Owner occupied
- 2832.3%Renter occupied
- House owners and renters - White alone residents
- 8961.5%Owner occupied
- 5638.5%Renter occupied
- House owners and renters - Hispanic or Latino residents
- 10578.2%Owner occupied
- 2921.8%Renter occupied
Language usage in Bellerose Terrace
- English speakers - Total
- 29.7% of residents of Bellerose Terrace speak English at home.
- 21.1% of residents speak Spanish at home
- 24155.3%Speak English very well
- 19544.7%Speak English less than very well
- 51.5% of residents speak other language at home
- 66962.9%Speak English very well
- 39537.1%Speak English less than very well
- English speakers - Born in the United States
- 15.3% of residents of Bellerose Terrace speak English at home.
- 66.7% of residents speak Spanish at home
- 48100.0%Speak English very well
- 37.5% of residents speak other language at home
- 27100.0%Speak English very well
- English speakers - Native, born elsewhere
- 0.0% of residents of Bellerose Terrace speak English at home.
- 96.7% of residents speak Spanish at home
- 1551.7%Speak English very well
- 1448.3%Speak English less than very well
- English speakers - Foreign-born
- 17.1% of residents of Bellerose Terrace speak English at home.
- 15.4% of residents speak Spanish at home
- 3720.3%Speak English very well
- 14579.7%Speak English less than very well
- 70.2% of residents speak other language at home
- 43852.7%Speak English very well
- 39347.3%Speak English less than very well
White (Caucasian) - Speak only English
| Native: | 76.7% (233) |
| Foreign-born: | 68.1% (27) |
White (Caucasian) - Speak another language
| Native: | 19.5% (59) |
| Foreign-born: | 40.4% (16) |
Black or African American - Speak only English
| Native: | 99.1% (57) |
| Foreign-born: | 99.0% (19) |
American Indian / Alaska Native - Speak another language
| Native: | 100.0% (49) |
| Foreign-born: | 100.0% (34) |
Asian - Speak only English
| Native: | 23.0% (56) |
| Foreign-born: | 2.6% (23) |
Asian - Speak another language
| Native: | 75.2% (183) |
| Foreign-born: | 99.9% (885) |
Other race - Speak only English
| Native: | 31.1% (54) |
| Foreign-born: | 39.9% (117) |
Other race - Speak another language
| Native: | 67.6% (118) |
| Foreign-born: | 50.2% (147) |
Two or more races - Speak another language
| Native: | 98.9% (151) |
| Foreign-born: | 100.0% (25) |
White alone - Speak only English
| Native: | 76.2% (223) |
| Foreign-born: | 86.3% (28) |
White alone - Speak another language
| Native: | 22.0% (64) |
| Foreign-born: | 12.2% (4) |
Hispanic or Latino - Speak another language
| Native: | 93.8% (250) |
| Foreign-born: | 100.0% (196) |
Foreign-born residents in Bellerose Terrace
1,146 residents are foreign born (36.0% Asia, 15.7% Latin America).
| This city: | 53.9% |
| New York: | 22.6% |


Marital status for residents in Bellerose Terrace
Marital status - White (Caucasian) population 15 years and over
- Males
- 33.9%Never married
- 52.9%Now married
- 0.0%Separated
- 13.2%Widowed
- 0.0%Divorced
- Females
- 3.1%Never married
- 83.8%Now married
- 3.1%Separated
- 10.0%Widowed
- 0.0%Divorced
Women who did not give birth in the past 12 months
| Now married: | 50.0% (4) |
| Unmarried: | 50.0% (4) |
Marital status - Black or African American population 15 years and over
- Males
- 0.0%Never married
- 100.0%Now married
- 0.0%Separated
- 0.0%Widowed
- 0.0%Divorced
- Females
- 0.0%Never married
- 64.1%Now married
- 35.9%Separated
- 0.0%Widowed
- 0.0%Divorced
Women who did not give birth in the past 12 months
| Now married: | 100.0% (22) |
| Unmarried: | 0.0% (0) |
Marital status - American Indian / Alaska Native population 15 years and over
- Males
- 0.0%Never married
- 100.0%Now married
- 0.0%Separated
- 0.0%Widowed
- 0.0%Divorced
- Females
- 0.0%Never married
- 100.0%Now married
- 0.0%Separated
- 0.0%Widowed
- 0.0%Divorced
Women who did not give birth in the past 12 months
| Now married: | 100.0% (30) |
| Unmarried: | 0.0% (0) |
Marital status - Asian population 15 years and over
- Males
- 44.9%Never married
- 46.4%Now married
- 3.4%Separated
- 0.0%Widowed
- 5.4%Divorced
- Females
- 35.3%Never married
- 50.0%Now married
- 0.0%Separated
- 0.0%Widowed
- 14.7%Divorced
Women who gave birth in the past 12 months
| Now married: | 100.0% (17) |
| Unmarried: | 0.0% (0) |
Women who did not give birth in the past 12 months
| Now married: | 41.3% (91) |
| Unmarried: | 58.7% (130) |
Marital status - Other race population 15 years and over
- Males
- 26.7%Never married
- 73.3%Now married
- 0.0%Separated
- 0.0%Widowed
- 0.0%Divorced
- Females
- 17.1%Never married
- 22.2%Now married
- 60.7%Separated
- 0.0%Widowed
- 0.0%Divorced
Women who did not give birth in the past 12 months
| Now married: | 48.8% (48) |
| Unmarried: | 51.2% (50) |
Marital status - Two or more races population 15 years and over
- Males
- 26.9%Never married
- 40.4%Now married
- 0.0%Separated
- 0.0%Widowed
- 32.7%Divorced
- Females
- 32.7%Never married
- 55.8%Now married
- 0.0%Separated
- 11.5%Widowed
- 0.0%Divorced
Women who did not give birth in the past 12 months
| Now married: | 50.0% (26) |
| Unmarried: | 50.0% (26) |
Marital status - White alone, not Hispanic / Latino population 15 years and over
- Males
- 35.3%Never married
- 50.9%Now married
- 0.0%Separated
- 13.8%Widowed
- 0.0%Divorced
- Females
- 3.7%Never married
- 96.3%Now married
- 0.0%Separated
- 0.0%Widowed
- 0.0%Divorced
Women who did not give birth in the past 12 months
| Now married: | 50.0% (4) |
| Unmarried: | 50.0% (4) |
Marital status - Hispanic or Latino population 15 years and over
- Males
- 24.6%Never married
- 75.4%Now married
- 0.0%Separated
- 0.0%Widowed
- 0.0%Divorced
- Females
- 37.4%Never married
- 40.8%Now married
- 16.4%Separated
- 5.5%Widowed
- 0.0%Divorced
Women who did not give birth in the past 12 months
| Now married: | 42.2% (64) |
| Unmarried: | 57.8% (88) |
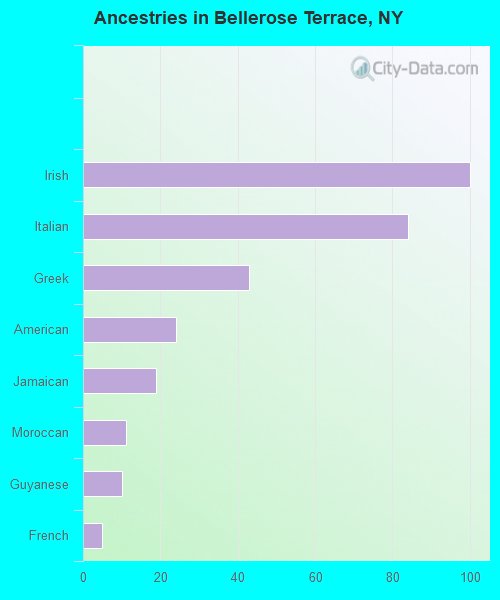
Ancestries in Bellerose Terrace

- 1008.7%Irish
- 847.3%Italian
- 433.7%Greek
- 242.1%American
- 191.7%Jamaican
- 111.0%Moroccan
- 100.9%Guyanese
- 50.4%French
Geographical mobility in Bellerose Terrace

- Same house 1 year ago
- 32895.7%White (Caucasian)
- 4660.3%Black or African American
- 133100.0%American Indian / Alaska Native
- 1,10795.4%Asian
- 41386.9%Other race
- 14784.1%Two or more races
- 32199.2%White alone, not Hispanic / Latino
- 44992.6%Hispanic or Latino

-
- Moved within same state
- 144.2%White / Caucasian
- 3444.7%Black or African American
- 393.3%Asian
- 377.7%Other race
- 2715.5%Two or more races
- 295.9%Hispanic or Latino

Children Nativity (place of birth) in Bellerose Terrace
Place of birth for residents in Bellerose Terrace
![Place of birth for the foreign-born population - Regions]()
- 761Asia
- 417South Central Asia
- 333Americas
- 333Latin America
- 255South America
- 195Eastern Asia
- 195China
- 148South Eastern Asia
- 40Caribbean
- 37Central America
- 32Europe
- 28Northern Europe
- 18Africa
- 18Northern Africa
- 3Southern Europe

![Place of birth for the foreign-born population - Countries]()
- 195China
- 193Pakistan
- 142Guyana
- 140India
- 112Colombia
- 83Bangladesh
- 78Philippines
- 70Burma (Myanmar)
- 28Ireland
- 23Guatemala
- 20Dominican Republic
- 19Jamaica
- 18Morocco
- 9Mexico
- 3Greece
- 3El Salvador

Zip codes: 11001.