Races in Bellevue, Pennsylvania (PA) Detailed Stats
Data:
Races - White alone (%)
Races - White alone (% change since 2000)
Races - Black alone (%)
Races - Black alone (% change since 2000)
Races - American Indian alone (%)
Races - American Indian alone (% change since 2000)
Races - Asian alone (%)
Races - Asian alone (% change since 2000)
Races - Hispanic (%)
Races - Hispanic (% change since 2000)
Races - Native Hawaiian and Other Pacific Islander alone (%)
Races - Native Hawaiian and Other Pacific Islander alone (% change since 2000)
Races - Two or more races(%)
Races - Two or more races(% change since 2000)
Races - Other race alone (%)
Races - Other race alone (% change since 2000)
Racial diversity
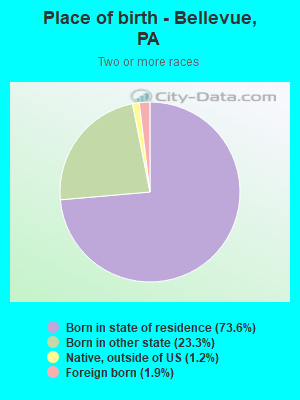
Place of birth - Born in state of residence (%)
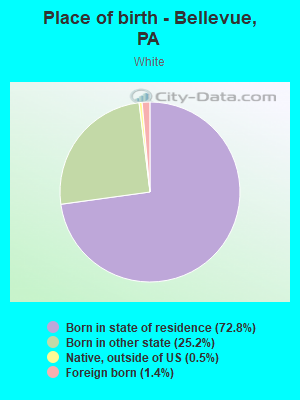
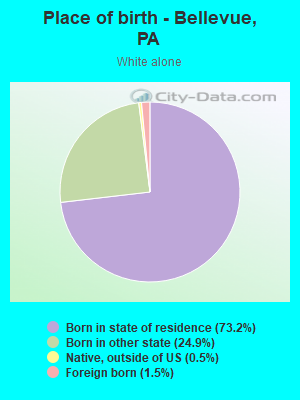
Place of birth - Born in state of residence (%) - White
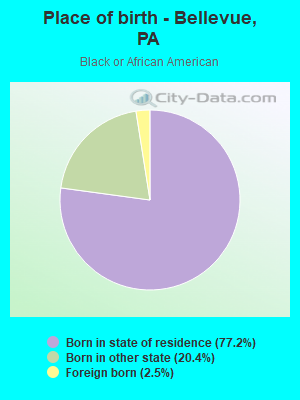
Place of birth - Born in state of residence (%) - Black or African American
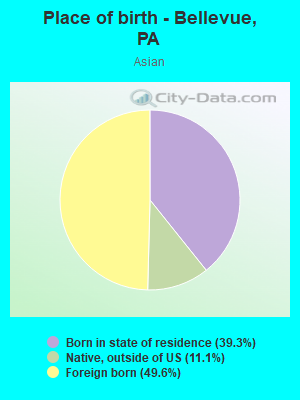
Place of birth - Born in state of residence (%) - Asian
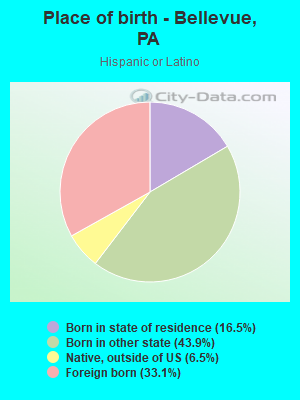
Place of birth - Born in state of residence (%) - Hispanic or Latino
Place of birth - Born in state of residence (%) - American Indian and Alaska Native
Place of birth - Born in state of residence (%) - Multirace
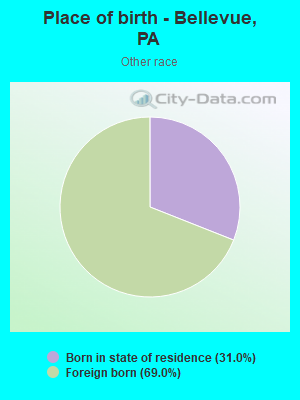
Place of birth - Born in state of residence (%) - Other Race
Place of birth - Born in other state (%)
Place of birth - Born in other state (%) - White
Place of birth - Born in other state (%) - Black or African American
Place of birth - Born in other state (%) - Asian
Place of birth - Born in other state (%) - Hispanic or Latino
Place of birth - Born in other state (%) - American Indian and Alaska Native
Place of birth - Born in other state (%) - Multirace
Place of birth - Born in other state (%) - Other Race
Place of birth - Native, outside of US (%)
Place of birth - Native, outside of US (%) - White
Place of birth - Native, outside of US (%) - Black or African American
Place of birth - Native, outside of US (%) - Asian
Place of birth - Native, outside of US (%) - Hispanic or Latino
Place of birth - Native, outside of US (%) - American Indian and Alaska Native
Place of birth - Native, outside of US (%) - Multirace
Place of birth - Native, outside of US (%) - Other Race
Place of birth - Foreign born (%)
Place of birth - Foreign born (%) - White
Place of birth - Foreign born (%) - Black or African American
Place of birth - Foreign born (%) - Asian
Place of birth - Foreign born (%) - Hispanic or Latino
Place of birth - Foreign born (%) - American Indian and Alaska Native
Place of birth - Foreign born (%) - Multirace
Place of birth - Foreign born (%) - Other Race
Residents speaking English at home (%)
Residents speaking English at home - Born in the United States (%)
Residents speaking English at home - Native, born elsewhere (%)
Residents speaking English at home - Foreign born (%)
Residents speaking Spanish at home (%)
Residents speaking Spanish at home - Born in the United States (%)
Residents speaking Spanish at home - Native, born elsewhere (%)
Residents speaking Spanish at home - Foreign born (%)
Residents speaking other language at home (%)
Residents speaking other language at home - Born in the United States (%)
Residents speaking other language at home - Native, born elsewhere (%)
Residents speaking other language at home - Foreign born (%)
Marital status - Never married (%)
Marital status - Now married (%)
Marital status - Separated (%)
Marital status - Widowed (%)
Marital status - Divorced (%)
Ancestries Reported - Arab (%)
Ancestries Reported - Czech (%)
Ancestries Reported - Danish (%)
Ancestries Reported - Dutch (%)
Ancestries Reported - English (%)
Ancestries Reported - French (%)
Ancestries Reported - French Canadian (%)
Ancestries Reported - German (%)
Ancestries Reported - Greek (%)
Ancestries Reported - Hungarian (%)
Ancestries Reported - Irish (%)
Ancestries Reported - Italian (%)
Ancestries Reported - Lithuanian (%)
Ancestries Reported - Norwegian (%)
Ancestries Reported - Polish (%)
Ancestries Reported - Portuguese (%)
Ancestries Reported - Russian (%)
Ancestries Reported - Scotch-Irish (%)
Ancestries Reported - Scottish (%)
Ancestries Reported - Slovak (%)
Ancestries Reported - Subsaharan African (%)
Ancestries Reported - Swedish (%)
Ancestries Reported - Swiss (%)
Ancestries Reported - Ukrainian (%)
Ancestries Reported - United States (%)
Ancestries Reported - Welsh (%)
Ancestries Reported - West Indian (%)
Ancestries Reported - Other (%)
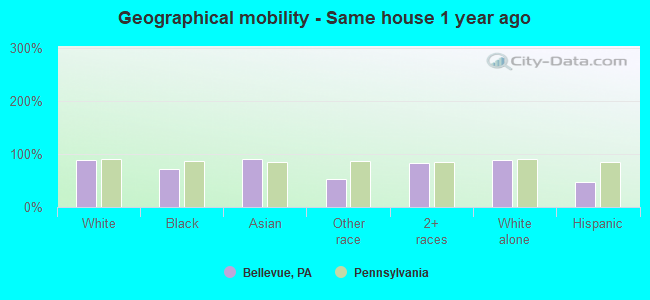
Geographical mobility - Same house 1 year ago (%)
Geographical mobility - Same house 1 year ago (%) - White
Geographical mobility - Same house 1 year ago (%) - Black or African American
Geographical mobility - Same house 1 year ago (%) - Asian
Geographical mobility - Same house 1 year ago (%) - Hispanic or Latino
Geographical mobility - Same house 1 year ago (%) - American Indian and Alaska Native
Geographical mobility - Same house 1 year ago (%) - Multirace
Geographical mobility - Same house 1 year ago (%) - Other Race
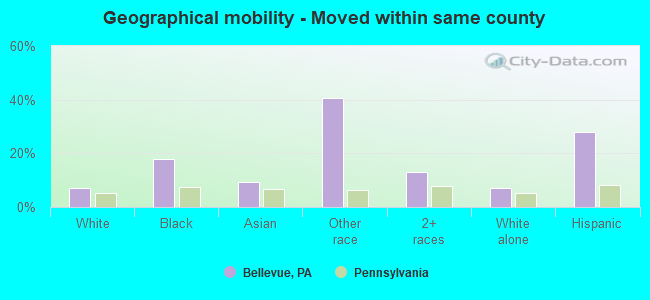
Geographical mobility - Moved within same county (%)
Geographical mobility - Moved within same county (%) - White
Geographical mobility - Moved within same county (%) - Black or African American
Geographical mobility - Moved within same county (%) - Asian
Geographical mobility - Moved within same county (%) - Hispanic or Latino
Geographical mobility - Moved within same county (%) - American Indian and Alaska Native
Geographical mobility - Moved within same county (%) - Multirace
Geographical mobility - Moved within same county (%) - Other Race
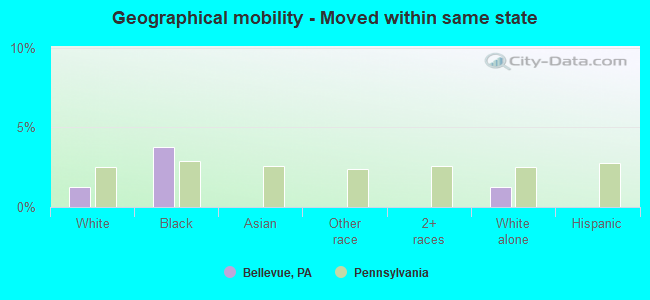
Geographical mobility - Moved from different county within same state (%)
Geographical mobility - Moved from different county within same state (%) - White
Geographical mobility - Moved from different county within same state (%) - Black or African American
Geographical mobility - Moved from different county within same state (%) - Asian
Geographical mobility - Moved from different county within same state (%) - Hispanic or Latino
Geographical mobility - Moved from different county within same state (%) - American Indian and Alaska Native
Geographical mobility - Moved from different county within same state (%) - Multirace
Geographical mobility - Moved from different county within same state (%) - Other Race
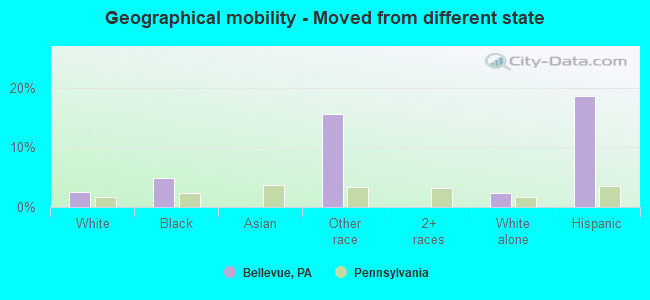
Geographical mobility - Moved from different state (%)
Geographical mobility - Moved from different state (%) - White
Geographical mobility - Moved from different state (%) - Black or African American
Geographical mobility - Moved from different state (%) - Asian
Geographical mobility - Moved from different state (%) - Hispanic or Latino
Geographical mobility - Moved from different state (%) - American Indian and Alaska Native
Geographical mobility - Moved from different state (%) - Multirace
Geographical mobility - Moved from different state (%) - Other Race
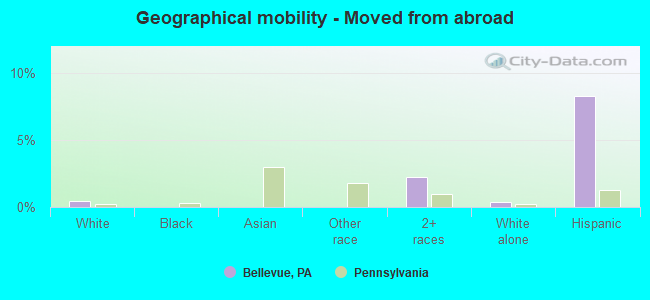
Geographical mobility - Moved from abroad (%)
Geographical mobility - Moved from abroad (%) - White
Geographical mobility - Moved from abroad (%) - Black or African American
Geographical mobility - Moved from abroad (%) - Asian
Geographical mobility - Moved from abroad (%) - Hispanic or Latino
Geographical mobility - Moved from abroad (%) - American Indian and Alaska Native
Geographical mobility - Moved from abroad (%) - Multirace
Geographical mobility - Moved from abroad (%) - Other Race
Place of birth for the foreign-born population - Ireland (%)
Place of birth for the foreign-born population - Denmark (%)
Place of birth for the foreign-born population - Norway (%)
Place of birth for the foreign-born population - Sweden (%)
Place of birth for the foreign-born population - United Kingdom (%)
Place of birth for the foreign-born population - England (%)
Place of birth for the foreign-born population - Scotland (%)
Place of birth for the foreign-born population - Other Northern Europe (%)
Place of birth for the foreign-born population - Austria (%)
Place of birth for the foreign-born population - Belgium (%)
Place of birth for the foreign-born population - France (%)
Place of birth for the foreign-born population - Germany (%)
Place of birth for the foreign-born population - Netherlands (%)
Place of birth for the foreign-born population - Switzerland (%)
Place of birth for the foreign-born population - Other Western Europe (%)
Place of birth for the foreign-born population - Greece (%)
Place of birth for the foreign-born population - Italy (%)
Place of birth for the foreign-born population - Portugal (%)
Place of birth for the foreign-born population - Spain (%)
Place of birth for the foreign-born population - Other Southern Europe (%)
Place of birth for the foreign-born population - Albania (%)
Place of birth for the foreign-born population - Belarus (%)
Place of birth for the foreign-born population - Bosnia and Herzegovina (%)
Place of birth for the foreign-born population - Bulgaria (%)
Place of birth for the foreign-born population - Croatia (%)
Place of birth for the foreign-born population - Czechoslovakia (%)
Place of birth for the foreign-born population - Hungary (%)
Place of birth for the foreign-born population - Latvia (%)
Place of birth for the foreign-born population - Lithuania (%)
Place of birth for the foreign-born population - North Macedonia (Macedonia) (%)
Place of birth for the foreign-born population - Moldova (%)
Place of birth for the foreign-born population - Poland (%)
Place of birth for the foreign-born population - Romania (%)
Place of birth for the foreign-born population - Russia (%)
Place of birth for the foreign-born population - Serbia (%)
Place of birth for the foreign-born population - Ukraine (%)
Place of birth for the foreign-born population - Other Eastern Europe (%)
Place of birth for the foreign-born population - China (%)
Place of birth for the foreign-born population - Hong Kong (%)
Place of birth for the foreign-born population - Taiwan (%)
Place of birth for the foreign-born population - Japan (%)
Place of birth for the foreign-born population - Korea (%)
Place of birth for the foreign-born population - Other Eastern Asia (%)
Place of birth for the foreign-born population - Afghanistan (%)
Place of birth for the foreign-born population - Bangladesh (%)
Place of birth for the foreign-born population - India (%)
Place of birth for the foreign-born population - Iran (%)
Place of birth for the foreign-born population - Kazakhstan (%)
Place of birth for the foreign-born population - Nepal (%)
Place of birth for the foreign-born population - Pakistan (%)
Place of birth for the foreign-born population - Sri Lanka (%)
Place of birth for the foreign-born population - Uzbekistan (%)
Place of birth for the foreign-born population - Other South Central Asia (%)
Place of birth for the foreign-born population - Burma (%)
Place of birth for the foreign-born population - Cambodia (%)
Place of birth for the foreign-born population - Indonesia (%)
Place of birth for the foreign-born population - Laos (%)
Place of birth for the foreign-born population - Malaysia (%)
Place of birth for the foreign-born population - Philippines (%)
Place of birth for the foreign-born population - Singapore (%)
Place of birth for the foreign-born population - Thailand (%)
Place of birth for the foreign-born population - Vietnam (%)
Place of birth for the foreign-born population - Other South Eastern Asia (%)
Place of birth for the foreign-born population - Armenia (%)
Place of birth for the foreign-born population - Iraq (%)
Place of birth for the foreign-born population - Israel (%)
Place of birth for the foreign-born population - Jordan (%)
Place of birth for the foreign-born population - Kuwait (%)
Place of birth for the foreign-born population - Lebanon (%)
Place of birth for the foreign-born population - Saudi Arabia (%)
Place of birth for the foreign-born population - Syria (%)
Place of birth for the foreign-born population - Turkey (%)
Place of birth for the foreign-born population - Yemen (%)
Place of birth for the foreign-born population - Other Western Asia (%)
Place of birth for the foreign-born population - Eritrea (%)
Place of birth for the foreign-born population - Ethiopia (%)
Place of birth for the foreign-born population - Kenya (%)
Place of birth for the foreign-born population - Somalia (%)
Place of birth for the foreign-born population - Uganda (%)
Place of birth for the foreign-born population - Zimbabwe (%)
Place of birth for the foreign-born population - Other Eastern Africa (%)
Place of birth for the foreign-born population - Cameroon (%)
Place of birth for the foreign-born population - Congo (%)
Place of birth for the foreign-born population - Democratic Republic of Congo (Zaire) (%)
Place of birth for the foreign-born population - Other Middle Africa (%)
Place of birth for the foreign-born population - Egypt (%)
Place of birth for the foreign-born population - Morocco (%)
Place of birth for the foreign-born population - Sudan (%)
Place of birth for the foreign-born population - Other Northern Africa (%)
Place of birth for the foreign-born population - South Africa (%)
Place of birth for the foreign-born population - Other Southern Africa (%)
Place of birth for the foreign-born population - Cabo Verde (%)
Place of birth for the foreign-born population - Ghana (%)
Place of birth for the foreign-born population - Liberia (%)
Place of birth for the foreign-born population - Nigeria (%)
Place of birth for the foreign-born population - Senegal (%)
Place of birth for the foreign-born population - Sierra Leone (%)
Place of birth for the foreign-born population - Other Western Africa (%)
Place of birth for the foreign-born population - Australia (%)
Place of birth for the foreign-born population - New Zealand (%)
Place of birth for the foreign-born population - Fiji (%)
Place of birth for the foreign-born population - Micronesia (%)
Place of birth for the foreign-born population - Bahamas (%)
Place of birth for the foreign-born population - Barbados (%)
Place of birth for the foreign-born population - Cuba (%)
Place of birth for the foreign-born population - Dominica (%)
Place of birth for the foreign-born population - Dominican Republic (%)
Place of birth for the foreign-born population - Grenada (%)
Place of birth for the foreign-born population - Haiti (%)
Place of birth for the foreign-born population - Jamaica (%)
Place of birth for the foreign-born population - St. Vincent and the Grenadines (%)
Place of birth for the foreign-born population - Trinidad and Tobago (%)
Place of birth for the foreign-born population - West Indies (%)
Place of birth for the foreign-born population - Other Caribbean (%)
Place of birth for the foreign-born population - Belize (%)
Place of birth for the foreign-born population - Costa Rica (%)
Place of birth for the foreign-born population - El Salvador (%)
Place of birth for the foreign-born population - Guatemala (%)
Place of birth for the foreign-born population - Honduras (%)
Place of birth for the foreign-born population - Mexico (%)
Place of birth for the foreign-born population - Nicaragua (%)
Place of birth for the foreign-born population - Panama (%)
Place of birth for the foreign-born population - Other Central America (%)
Place of birth for the foreign-born population - Argentina (%)
Place of birth for the foreign-born population - Bolivia (%)
Place of birth for the foreign-born population - Brazil (%)
Place of birth for the foreign-born population - Chile (%)
Place of birth for the foreign-born population - Colombia (%)
Place of birth for the foreign-born population - Ecuador (%)
Place of birth for the foreign-born population - Guyana (%)
Place of birth for the foreign-born population - Peru (%)
Place of birth for the foreign-born population - Uruguay (%)
Place of birth for the foreign-born population - Venezuela (%)
Place of birth for the foreign-born population - Other South America (%)
Place of birth for the foreign-born population - Canada (%)
Place of birth for the foreign-born population - Other Northern America (%)
Place of birth for the foreign-born population - Other (%)
Latest news about races in Bellevue, PA collected exclusively by city-data.com from local newspapers, TV, and radio stations
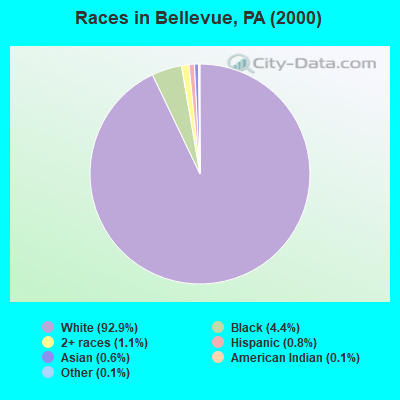
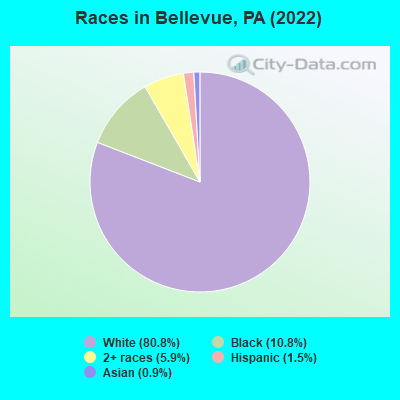
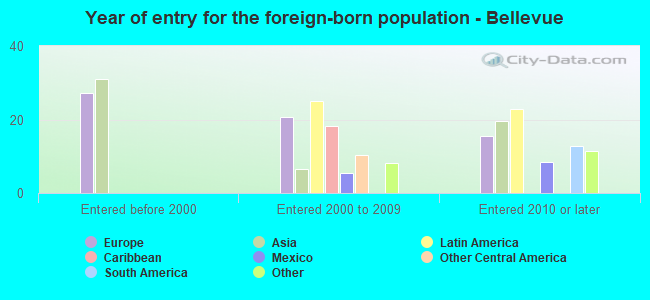
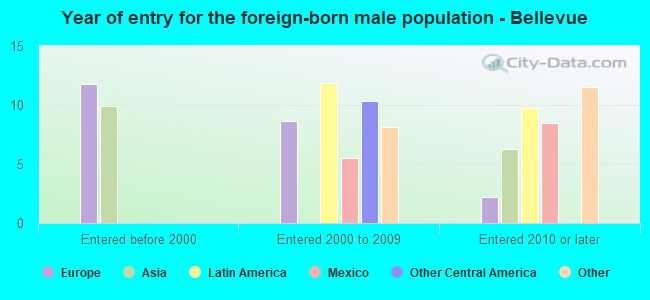
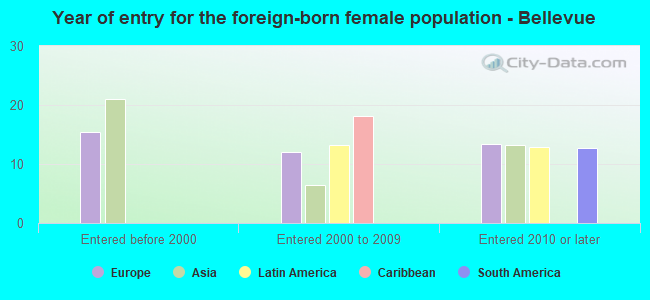
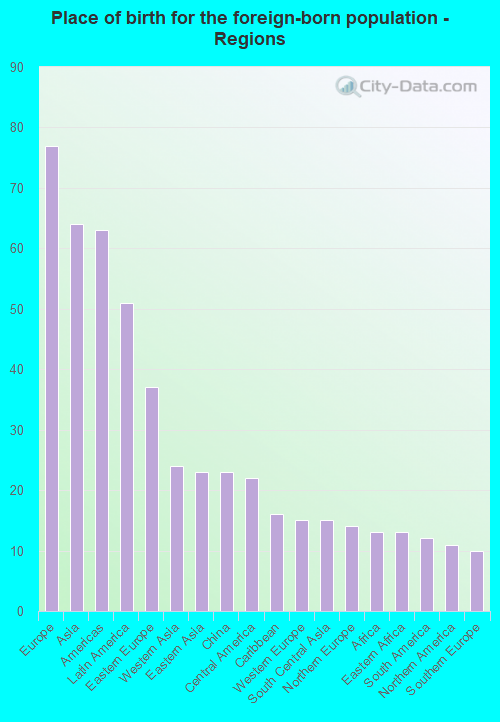
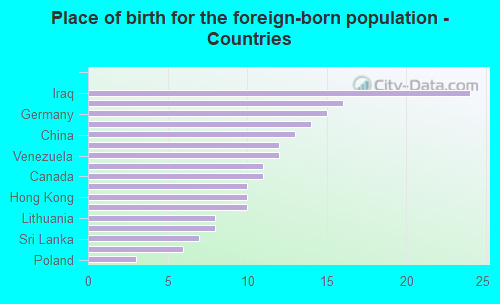
According to 2022 data, the most numerous races in Bellevue, PA are White alone (6,592 residents), Black alone (882 residents), and Hispanic (123 residents). 95.9% of Bellevue residents speak English at home. 2.7% of Bellevue, PA residents are foreign-born (0.9% born in Europe, 0.7% born in Asia, 0.6% born in Latin America), which is 160.7% less than the foreign-born rate of 7.0% across the entire state of Pennsylvania.
Race distribution in Bellevue
2000 2022
10,322,455 84.1% White alone 1,202,437 9.8% Black alone 394,088 3.2% Hispanic 218,296 1.8% Asian alone 113,097 0.9% Two or more races 13,086 0.1% Other race alone 14,904 0.1% American Indian alone 2,691 0.02% Native Hawaiian and Other
9,487,228 73.1% White alone 1,311,581 10.1% Black alone 1,115,997 8.6% Hispanic 493,942 3.8% Two or more races 487,124 3.8% Asian alone 63,582 0.5% Other race alone 10,130 0.08% American Indian alone 2,424 0.02% Native Hawaiian and Other
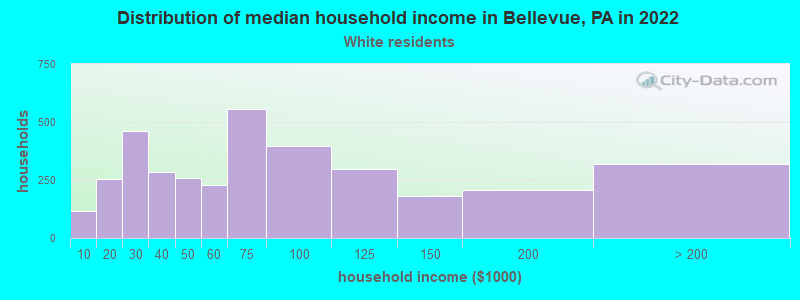
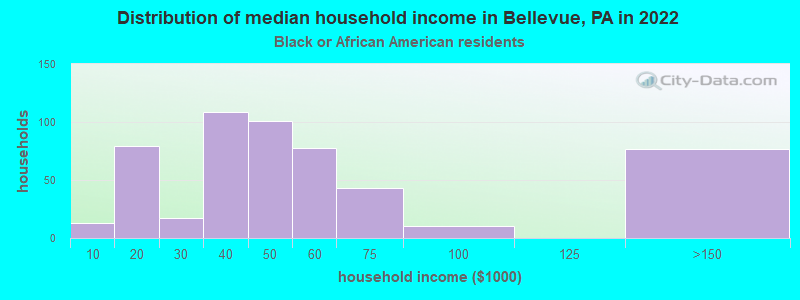
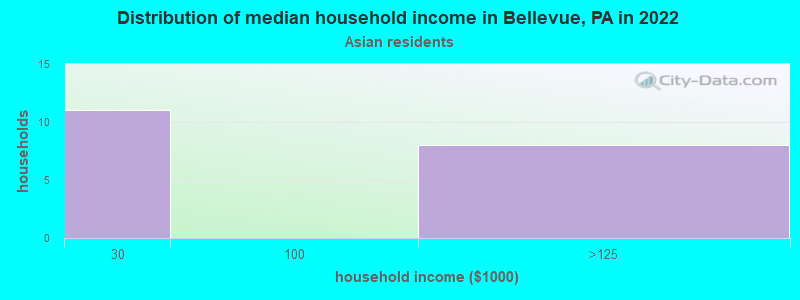
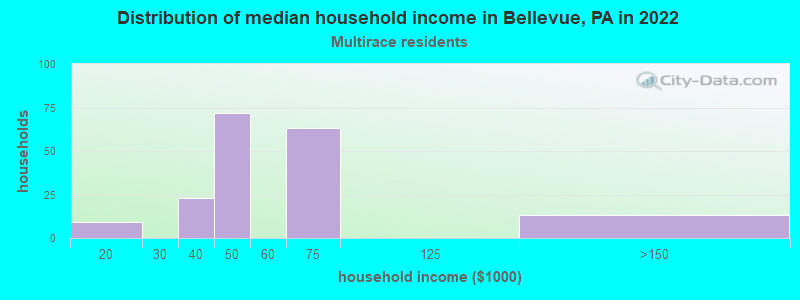
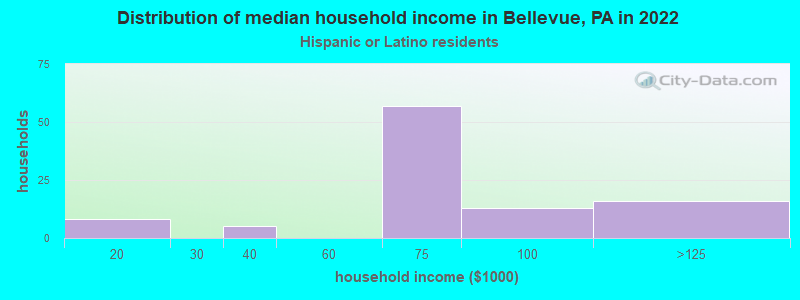
Income and house value in Bellevue Median household income in 2022 $64,930 White non-Hispanic householders$43,074 Black householders$40,293 Two or more races householders$71,064 Hispanic or Latino race householdersMedian 2022 house value $181,192 White Non-Hispanic householders$167,685 Black or African American householders$140,162 Hispanic or Latino householders
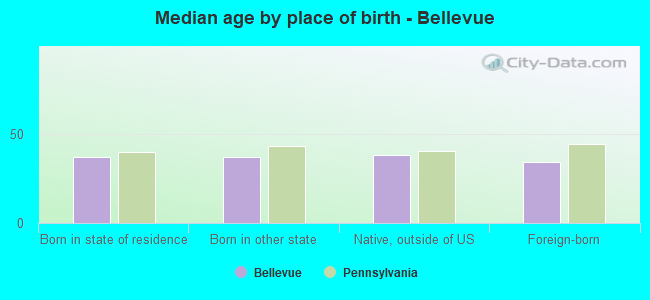
Median age by race in Bellevue
37.6 Median age for White residents37.0 40.7 27.6 Median age for Black or African American residents27.5 29.0 -642,857,142.2 Median age for American Indian / Alaska Native residents-714,583,332.6 -577,519,379.3 35.2 Median age for Asian residents37.5 34.2 -656,534,953.8 Median age for Native Hawaiian / Pacific Islander residents-919,148,935.3 -747,474,746.7 32.7 Median age for Other race residents32.5 -681,623,930.9 28.4 Median age for Two or more races residents20.9 35.8 37.7 Median age for White alone residents36.9 41.1 28.2 Median age for Hispanic or Latino residents31.7 28.1
Owner/renter occupied households by race in Bellevue
House owners and renters - White residents 1,659 46.8% Owner occupied1,886 53.2% Renter occupiedHouse owners and renters - Black or African American residents 37 7.4% Owner occupied465 92.6% Renter occupiedHouse owners and renters - Asian residents 22 100.0% Renter occupiedHouse owners and renters - Other race residents 9 100.0% Renter occupiedHouse owners and renters - Two or more races residents 74 46.9% Owner occupied84 53.1% Renter occupiedHouse owners and renters - White alone residents 1,660 47.5% Owner occupied1,836 52.5% Renter occupiedHouse owners and renters - Hispanic or Latino residents 86 100.0% Renter occupied
Language usage in Bellevue
English speakers - Total 95.9% of residents of Bellevue speak English at home.
0.8% of residents speak Spanish at home 57 89.1% Speak English very well7 10.9% Speak English less than very well3.2% of residents speak other language at home 110 44.9% Speak English very well135 55.1% Speak English less than very well
English speakers - Born in the United States 97.1% of residents of Bellevue speak English at home.
0.4% of residents speak Spanish at home 8 100.0% Speak English very well1.4% of residents speak other language at home 29 100.0% Speak English very well
English speakers - Native, born elsewhere 85.7% of residents of Bellevue speak English at home.
English speakers - Foreign-born 29.2% of residents of Bellevue speak English at home.
31.3% of residents speak Spanish at home 55 90.2% Speak English very well6 9.8% Speak English less than very well46.7% of residents speak other language at home 20 22.0% Speak English very well71 78.0% Speak English less than very well
White (Caucasian) - Speak only English Native:
97.9% (6,024)Foreign-born:
51.5% (47)
White (Caucasian) - Speak another language Native:
2.1% (128)Foreign-born:
49.5% (45)
Asian - Speak only English Native:
69.9% (29)Foreign-born:
25.9% (9)
Two or more races - Speak another language Native:
7.1% (30)Foreign-born:
100.0% (10)
White alone - Speak only English Native:
97.8% (5,978)Foreign-born:
48.8% (48)
White alone - Speak another language Native:
2.2% (137)Foreign-born:
51.1% (50)
Hispanic or Latino - Speak another language Native:
13.1% (11)Foreign-born:
100.0% (39)
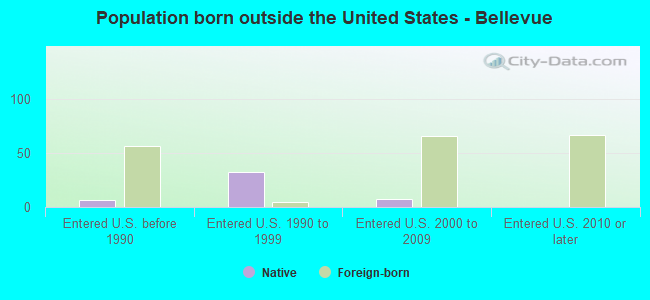
Foreign-born residents in Bellevue 219 residents are foreign born (0.9% Europe , 0.7% Asia , 0.6% Latin America ).
This city:
2.7%Pennsylvania:
7.3%
Marital status for residents in Bellevue Marital status - White (Caucasian) population 15 years and over
Males 46.7% Never married41.3% Now married0.0% Separated1.7% Widowed10.3% DivorcedFemales 39.4% Never married37.6% Now married1.4% Separated10.0% Widowed11.7% DivorcedWomen who gave birth in the past 12 months Now married:
96.9% (154)Unmarried:
3.1% (5)
Women who did not give birth in the past 12 months Now married:
35.3% (518)Unmarried:
64.7% (951)
Marital status - Black or African American population 15 years and over
Males 57.8% Never married33.3% Now married0.0% Separated7.1% Widowed1.8% DivorcedFemales 66.1% Never married16.2% Now married0.0% Separated6.9% Widowed10.8% DivorcedWomen who did not give birth in the past 12 months Now married:
23.2% (86)Unmarried:
76.8% (283)
Marital status - Asian population 15 years and over
Males 20.6% Never married79.4% Now married0.0% Separated0.0% Widowed0.0% DivorcedFemales 51.5% Never married48.5% Now married0.0% Separated0.0% Widowed0.0% DivorcedWomen who did not give birth in the past 12 months Now married:
32.0% (8)Unmarried:
68.0% (18)
Marital status - Other race population 15 years and over
Males 61.5% Never married38.5% Now married0.0% Separated0.0% Widowed0.0% DivorcedFemales 100.0% Never married0.0% Now married0.0% Separated0.0% Widowed0.0% DivorcedWomen who did not give birth in the past 12 months Now married:
0.0% (0)Unmarried:
100.0% (15)
Marital status - Two or more races population 15 years and over
Males 84.6% Never married9.6% Now married0.0% Separated0.0% Widowed5.8% DivorcedFemales 56.4% Never married9.4% Now married2.7% Separated4.0% Widowed27.5% DivorcedWomen who gave birth in the past 12 months Now married:
100.0% (11)Unmarried:
0.0% (0)
Women who did not give birth in the past 12 months Now married:
4.7% (8)Unmarried:
95.3% (165)
Marital status - White alone, not Hispanic / Latino population 15 years and over
Males 46.8% Never married41.4% Now married0.0% Separated1.7% Widowed10.1% DivorcedFemales 39.1% Never married38.0% Now married1.4% Separated10.1% Widowed11.3% DivorcedWomen who gave birth in the past 12 months Now married:
96.9% (154)Unmarried:
3.1% (5)
Women who did not give birth in the past 12 months Now married:
36.1% (513)Unmarried:
63.9% (909)
Marital status - Hispanic or Latino population 15 years and over
Males 62.5% Never married25.0% Now married0.0% Separated0.0% Widowed12.5% DivorcedFemales 64.1% Never married9.4% Now married0.0% Separated0.0% Widowed26.6% DivorcedWomen who did not give birth in the past 12 months Now married:
9.4% (6)Unmarried:
90.6% (62)
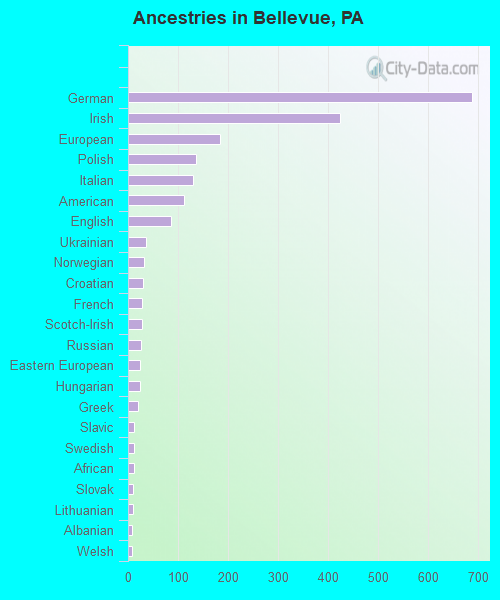
Ancestries in Bellevue
687 22.8% German423 14.0% Irish183 6.1% European135 4.5% Polish129 4.3% Italian111 3.7% American86 2.8% English36 1.2% Ukrainian32 1.1% Norwegian30 1.0% Croatian28 0.9% French28 0.9% Scotch-Irish26 0.9% Russian23 0.8% Eastern European23 0.8% Hungarian20 0.7% Greek12 0.4% Slavic12 0.4% Swedish11 0.4% African10 0.3% Slovak9 0.3% Lithuanian8 0.3% Albanian8 0.3% Welsh6 0.2% Syrian6 0.2% Finnish5 0.2% British3 0.10% Swiss1 0.03% French Canadian
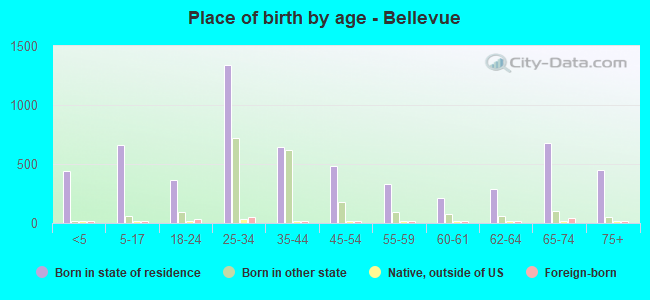
Children Nativity (place of birth) in Bellevue
Children under 6 years - Living with two parents Both parents native 385 100.0% NativeOne native, one foreign-born parent 13 100.0% NativeChildren under 6 years - Living with one parent Native parent 133 100.0% NativeChildren 6 to 17 years - Living with two parents Both parents native 328 97.7% Native8 2.3% Foreign-bornChildren 6 to 17 years - Living with one parent Native parent 270 100.0% NativeForeign-born parent 7 58.3% Native5 41.7% Foreign-born
Grandparents responsible for own grandchildren in Bellevue
Grandparents (30 to 59 years) White / Caucasian 4 24.7% Responsible for grandchildren13 75.3% Not responsible for grandchildrenTwo or more races 10 100.0% Responsible for grandchildrenWhite alone, not Hispanic / Latino 4 24.8% Responsible for grandchildren13 75.2% Not responsible for grandchildren
Grandparents (60 years and over) White / Caucasian 19 100.0% Responsible for grandchildrenTwo or more races 2 100.0% Not responsible for grandchildrenWhite alone, not Hispanic / Latino 19 100.0% Responsible for grandchildren