Races in Bellevue, Washington (WA) Detailed Stats
Data:
Races - White alone (%)
Races - White alone (% change since 2000)
Races - Black alone (%)
Races - Black alone (% change since 2000)
Races - American Indian alone (%)
Races - American Indian alone (% change since 2000)
Races - Asian alone (%)
Races - Asian alone (% change since 2000)
Races - Hispanic (%)
Races - Hispanic (% change since 2000)
Races - Native Hawaiian and Other Pacific Islander alone (%)
Races - Native Hawaiian and Other Pacific Islander alone (% change since 2000)
Races - Two or more races(%)
Races - Two or more races(% change since 2000)
Races - Other race alone (%)
Races - Other race alone (% change since 2000)
Racial diversity
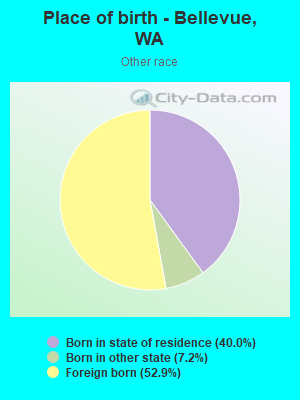
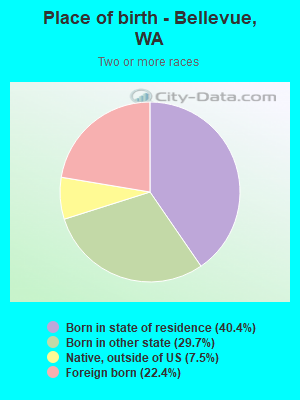
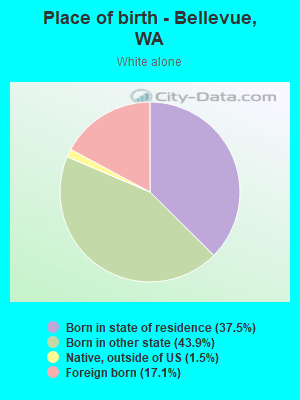
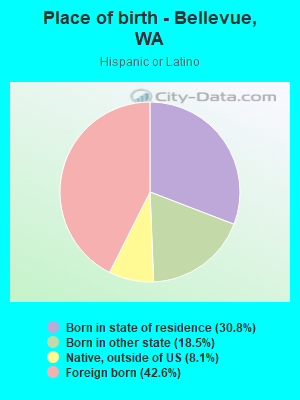
Place of birth - Born in state of residence (%)
Place of birth - Born in state of residence (%) - White
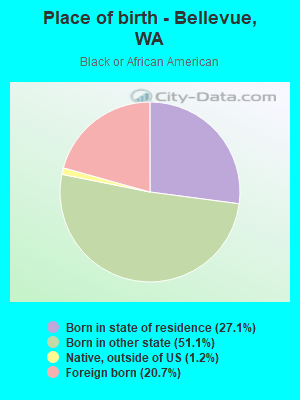
Place of birth - Born in state of residence (%) - Black or African American
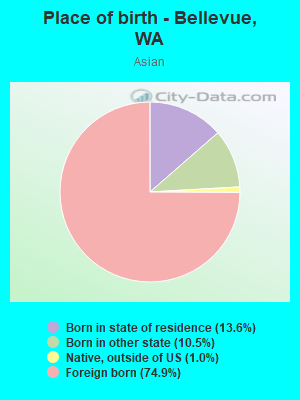
Place of birth - Born in state of residence (%) - Asian
Place of birth - Born in state of residence (%) - Hispanic or Latino
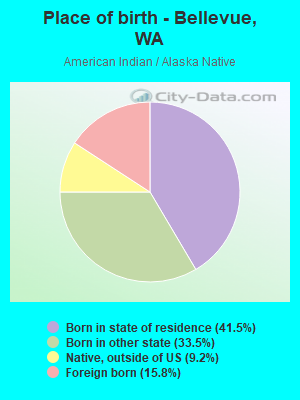
Place of birth - Born in state of residence (%) - American Indian and Alaska Native
Place of birth - Born in state of residence (%) - Multirace
Place of birth - Born in state of residence (%) - Other Race
Place of birth - Born in other state (%)
Place of birth - Born in other state (%) - White
Place of birth - Born in other state (%) - Black or African American
Place of birth - Born in other state (%) - Asian
Place of birth - Born in other state (%) - Hispanic or Latino
Place of birth - Born in other state (%) - American Indian and Alaska Native
Place of birth - Born in other state (%) - Multirace
Place of birth - Born in other state (%) - Other Race
Place of birth - Native, outside of US (%)
Place of birth - Native, outside of US (%) - White
Place of birth - Native, outside of US (%) - Black or African American
Place of birth - Native, outside of US (%) - Asian
Place of birth - Native, outside of US (%) - Hispanic or Latino
Place of birth - Native, outside of US (%) - American Indian and Alaska Native
Place of birth - Native, outside of US (%) - Multirace
Place of birth - Native, outside of US (%) - Other Race
Place of birth - Foreign born (%)
Place of birth - Foreign born (%) - White
Place of birth - Foreign born (%) - Black or African American
Place of birth - Foreign born (%) - Asian
Place of birth - Foreign born (%) - Hispanic or Latino
Place of birth - Foreign born (%) - American Indian and Alaska Native
Place of birth - Foreign born (%) - Multirace
Place of birth - Foreign born (%) - Other Race
Residents speaking English at home (%)
Residents speaking English at home - Born in the United States (%)
Residents speaking English at home - Native, born elsewhere (%)
Residents speaking English at home - Foreign born (%)
Residents speaking Spanish at home (%)
Residents speaking Spanish at home - Born in the United States (%)
Residents speaking Spanish at home - Native, born elsewhere (%)
Residents speaking Spanish at home - Foreign born (%)
Residents speaking other language at home (%)
Residents speaking other language at home - Born in the United States (%)
Residents speaking other language at home - Native, born elsewhere (%)
Residents speaking other language at home - Foreign born (%)
Marital status - Never married (%)
Marital status - Now married (%)
Marital status - Separated (%)
Marital status - Widowed (%)
Marital status - Divorced (%)
Ancestries Reported - Arab (%)
Ancestries Reported - Czech (%)
Ancestries Reported - Danish (%)
Ancestries Reported - Dutch (%)
Ancestries Reported - English (%)
Ancestries Reported - French (%)
Ancestries Reported - French Canadian (%)
Ancestries Reported - German (%)
Ancestries Reported - Greek (%)
Ancestries Reported - Hungarian (%)
Ancestries Reported - Irish (%)
Ancestries Reported - Italian (%)
Ancestries Reported - Lithuanian (%)
Ancestries Reported - Norwegian (%)
Ancestries Reported - Polish (%)
Ancestries Reported - Portuguese (%)
Ancestries Reported - Russian (%)
Ancestries Reported - Scotch-Irish (%)
Ancestries Reported - Scottish (%)
Ancestries Reported - Slovak (%)
Ancestries Reported - Subsaharan African (%)
Ancestries Reported - Swedish (%)
Ancestries Reported - Swiss (%)
Ancestries Reported - Ukrainian (%)
Ancestries Reported - United States (%)
Ancestries Reported - Welsh (%)
Ancestries Reported - West Indian (%)
Ancestries Reported - Other (%)
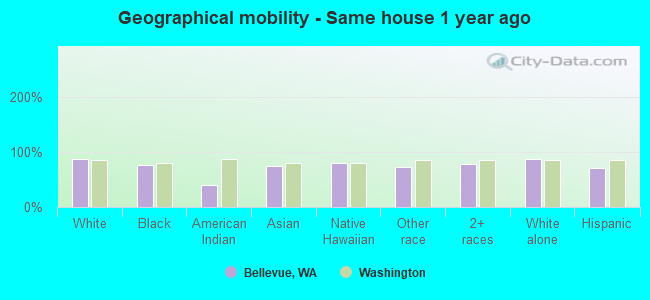
Geographical mobility - Same house 1 year ago (%)
Geographical mobility - Same house 1 year ago (%) - White
Geographical mobility - Same house 1 year ago (%) - Black or African American
Geographical mobility - Same house 1 year ago (%) - Asian
Geographical mobility - Same house 1 year ago (%) - Hispanic or Latino
Geographical mobility - Same house 1 year ago (%) - American Indian and Alaska Native
Geographical mobility - Same house 1 year ago (%) - Multirace
Geographical mobility - Same house 1 year ago (%) - Other Race
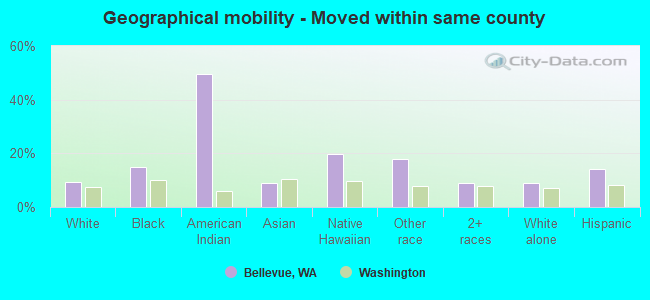
Geographical mobility - Moved within same county (%)
Geographical mobility - Moved within same county (%) - White
Geographical mobility - Moved within same county (%) - Black or African American
Geographical mobility - Moved within same county (%) - Asian
Geographical mobility - Moved within same county (%) - Hispanic or Latino
Geographical mobility - Moved within same county (%) - American Indian and Alaska Native
Geographical mobility - Moved within same county (%) - Multirace
Geographical mobility - Moved within same county (%) - Other Race
Geographical mobility - Moved from different county within same state (%)
Geographical mobility - Moved from different county within same state (%) - White
Geographical mobility - Moved from different county within same state (%) - Black or African American
Geographical mobility - Moved from different county within same state (%) - Asian
Geographical mobility - Moved from different county within same state (%) - Hispanic or Latino
Geographical mobility - Moved from different county within same state (%) - American Indian and Alaska Native
Geographical mobility - Moved from different county within same state (%) - Multirace
Geographical mobility - Moved from different county within same state (%) - Other Race
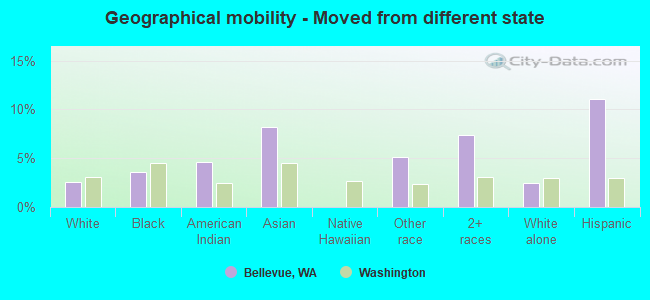
Geographical mobility - Moved from different state (%)
Geographical mobility - Moved from different state (%) - White
Geographical mobility - Moved from different state (%) - Black or African American
Geographical mobility - Moved from different state (%) - Asian
Geographical mobility - Moved from different state (%) - Hispanic or Latino
Geographical mobility - Moved from different state (%) - American Indian and Alaska Native
Geographical mobility - Moved from different state (%) - Multirace
Geographical mobility - Moved from different state (%) - Other Race
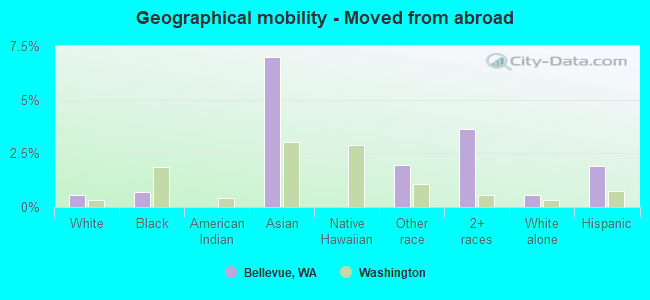
Geographical mobility - Moved from abroad (%)
Geographical mobility - Moved from abroad (%) - White
Geographical mobility - Moved from abroad (%) - Black or African American
Geographical mobility - Moved from abroad (%) - Asian
Geographical mobility - Moved from abroad (%) - Hispanic or Latino
Geographical mobility - Moved from abroad (%) - American Indian and Alaska Native
Geographical mobility - Moved from abroad (%) - Multirace
Geographical mobility - Moved from abroad (%) - Other Race
Place of birth for the foreign-born population - Ireland (%)
Place of birth for the foreign-born population - Denmark (%)
Place of birth for the foreign-born population - Norway (%)
Place of birth for the foreign-born population - Sweden (%)
Place of birth for the foreign-born population - United Kingdom (%)
Place of birth for the foreign-born population - England (%)
Place of birth for the foreign-born population - Scotland (%)
Place of birth for the foreign-born population - Other Northern Europe (%)
Place of birth for the foreign-born population - Austria (%)
Place of birth for the foreign-born population - Belgium (%)
Place of birth for the foreign-born population - France (%)
Place of birth for the foreign-born population - Germany (%)
Place of birth for the foreign-born population - Netherlands (%)
Place of birth for the foreign-born population - Switzerland (%)
Place of birth for the foreign-born population - Other Western Europe (%)
Place of birth for the foreign-born population - Greece (%)
Place of birth for the foreign-born population - Italy (%)
Place of birth for the foreign-born population - Portugal (%)
Place of birth for the foreign-born population - Spain (%)
Place of birth for the foreign-born population - Other Southern Europe (%)
Place of birth for the foreign-born population - Albania (%)
Place of birth for the foreign-born population - Belarus (%)
Place of birth for the foreign-born population - Bosnia and Herzegovina (%)
Place of birth for the foreign-born population - Bulgaria (%)
Place of birth for the foreign-born population - Croatia (%)
Place of birth for the foreign-born population - Czechoslovakia (%)
Place of birth for the foreign-born population - Hungary (%)
Place of birth for the foreign-born population - Latvia (%)
Place of birth for the foreign-born population - Lithuania (%)
Place of birth for the foreign-born population - North Macedonia (Macedonia) (%)
Place of birth for the foreign-born population - Moldova (%)
Place of birth for the foreign-born population - Poland (%)
Place of birth for the foreign-born population - Romania (%)
Place of birth for the foreign-born population - Russia (%)
Place of birth for the foreign-born population - Serbia (%)
Place of birth for the foreign-born population - Ukraine (%)
Place of birth for the foreign-born population - Other Eastern Europe (%)
Place of birth for the foreign-born population - China (%)
Place of birth for the foreign-born population - Hong Kong (%)
Place of birth for the foreign-born population - Taiwan (%)
Place of birth for the foreign-born population - Japan (%)
Place of birth for the foreign-born population - Korea (%)
Place of birth for the foreign-born population - Other Eastern Asia (%)
Place of birth for the foreign-born population - Afghanistan (%)
Place of birth for the foreign-born population - Bangladesh (%)
Place of birth for the foreign-born population - India (%)
Place of birth for the foreign-born population - Iran (%)
Place of birth for the foreign-born population - Kazakhstan (%)
Place of birth for the foreign-born population - Nepal (%)
Place of birth for the foreign-born population - Pakistan (%)
Place of birth for the foreign-born population - Sri Lanka (%)
Place of birth for the foreign-born population - Uzbekistan (%)
Place of birth for the foreign-born population - Other South Central Asia (%)
Place of birth for the foreign-born population - Burma (%)
Place of birth for the foreign-born population - Cambodia (%)
Place of birth for the foreign-born population - Indonesia (%)
Place of birth for the foreign-born population - Laos (%)
Place of birth for the foreign-born population - Malaysia (%)
Place of birth for the foreign-born population - Philippines (%)
Place of birth for the foreign-born population - Singapore (%)
Place of birth for the foreign-born population - Thailand (%)
Place of birth for the foreign-born population - Vietnam (%)
Place of birth for the foreign-born population - Other South Eastern Asia (%)
Place of birth for the foreign-born population - Armenia (%)
Place of birth for the foreign-born population - Iraq (%)
Place of birth for the foreign-born population - Israel (%)
Place of birth for the foreign-born population - Jordan (%)
Place of birth for the foreign-born population - Kuwait (%)
Place of birth for the foreign-born population - Lebanon (%)
Place of birth for the foreign-born population - Saudi Arabia (%)
Place of birth for the foreign-born population - Syria (%)
Place of birth for the foreign-born population - Turkey (%)
Place of birth for the foreign-born population - Yemen (%)
Place of birth for the foreign-born population - Other Western Asia (%)
Place of birth for the foreign-born population - Eritrea (%)
Place of birth for the foreign-born population - Ethiopia (%)
Place of birth for the foreign-born population - Kenya (%)
Place of birth for the foreign-born population - Somalia (%)
Place of birth for the foreign-born population - Uganda (%)
Place of birth for the foreign-born population - Zimbabwe (%)
Place of birth for the foreign-born population - Other Eastern Africa (%)
Place of birth for the foreign-born population - Cameroon (%)
Place of birth for the foreign-born population - Congo (%)
Place of birth for the foreign-born population - Democratic Republic of Congo (Zaire) (%)
Place of birth for the foreign-born population - Other Middle Africa (%)
Place of birth for the foreign-born population - Egypt (%)
Place of birth for the foreign-born population - Morocco (%)
Place of birth for the foreign-born population - Sudan (%)
Place of birth for the foreign-born population - Other Northern Africa (%)
Place of birth for the foreign-born population - South Africa (%)
Place of birth for the foreign-born population - Other Southern Africa (%)
Place of birth for the foreign-born population - Cabo Verde (%)
Place of birth for the foreign-born population - Ghana (%)
Place of birth for the foreign-born population - Liberia (%)
Place of birth for the foreign-born population - Nigeria (%)
Place of birth for the foreign-born population - Senegal (%)
Place of birth for the foreign-born population - Sierra Leone (%)
Place of birth for the foreign-born population - Other Western Africa (%)
Place of birth for the foreign-born population - Australia (%)
Place of birth for the foreign-born population - New Zealand (%)
Place of birth for the foreign-born population - Fiji (%)
Place of birth for the foreign-born population - Micronesia (%)
Place of birth for the foreign-born population - Bahamas (%)
Place of birth for the foreign-born population - Barbados (%)
Place of birth for the foreign-born population - Cuba (%)
Place of birth for the foreign-born population - Dominica (%)
Place of birth for the foreign-born population - Dominican Republic (%)
Place of birth for the foreign-born population - Grenada (%)
Place of birth for the foreign-born population - Haiti (%)
Place of birth for the foreign-born population - Jamaica (%)
Place of birth for the foreign-born population - St. Vincent and the Grenadines (%)
Place of birth for the foreign-born population - Trinidad and Tobago (%)
Place of birth for the foreign-born population - West Indies (%)
Place of birth for the foreign-born population - Other Caribbean (%)
Place of birth for the foreign-born population - Belize (%)
Place of birth for the foreign-born population - Costa Rica (%)
Place of birth for the foreign-born population - El Salvador (%)
Place of birth for the foreign-born population - Guatemala (%)
Place of birth for the foreign-born population - Honduras (%)
Place of birth for the foreign-born population - Mexico (%)
Place of birth for the foreign-born population - Nicaragua (%)
Place of birth for the foreign-born population - Panama (%)
Place of birth for the foreign-born population - Other Central America (%)
Place of birth for the foreign-born population - Argentina (%)
Place of birth for the foreign-born population - Bolivia (%)
Place of birth for the foreign-born population - Brazil (%)
Place of birth for the foreign-born population - Chile (%)
Place of birth for the foreign-born population - Colombia (%)
Place of birth for the foreign-born population - Ecuador (%)
Place of birth for the foreign-born population - Guyana (%)
Place of birth for the foreign-born population - Peru (%)
Place of birth for the foreign-born population - Uruguay (%)
Place of birth for the foreign-born population - Venezuela (%)
Place of birth for the foreign-born population - Other South America (%)
Place of birth for the foreign-born population - Canada (%)
Place of birth for the foreign-born population - Other Northern America (%)
Place of birth for the foreign-born population - Other (%)
Latest news about races in Bellevue, WA collected exclusively by city-data.com from local newspapers, TV, and radio stations
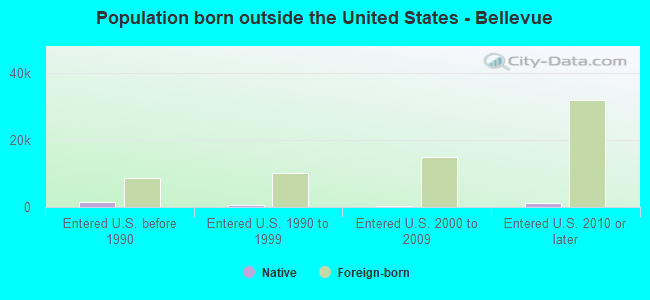
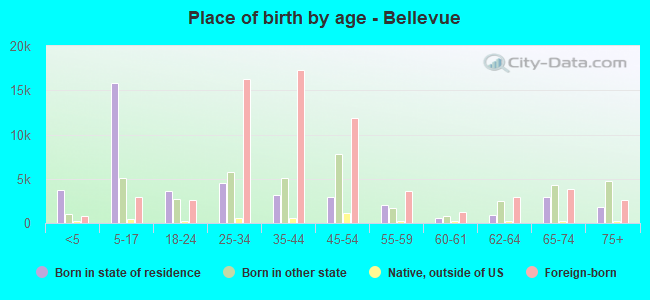
According to 2022 data, the most numerous races in Bellevue, WA are White alone (60,032 residents), Hispanic (13,149 residents), and Asian alone (63,500 residents). 50.4% of Bellevue residents speak English at home. 42.5% of Bellevue, WA residents are foreign-born (29.6% born in Asia, 5.0% born in Europe), which is 64.7% greater than the foreign-born rate of 15.0% across the entire state of Washington.
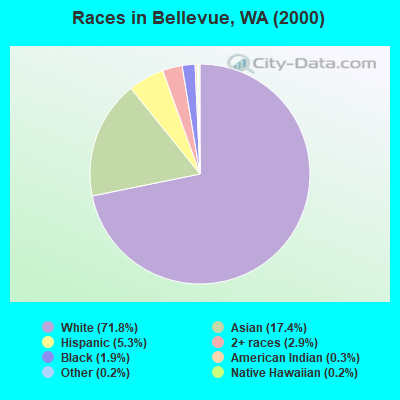
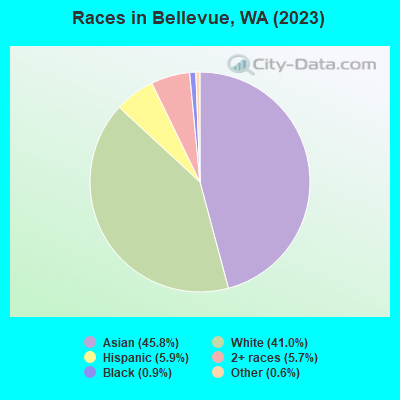
Race distribution in Bellevue
2000 2022
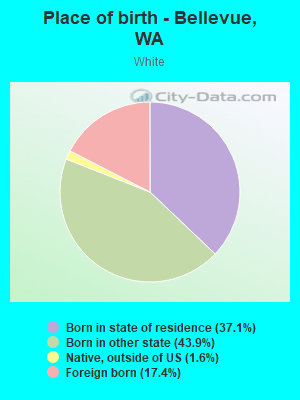
78,698 71.8% White alone 19,011 17.4% Asian alone 5,827 5.3% Hispanic 3,123 2.9% Two or more races 2,100 1.9% Black alone 301 0.3% American Indian alone 248 0.2% Native Hawaiian and Other 261 0.2% Other race alone
63,500 41.6% Asian alone 60,032 39.3% White alone 13,149 8.6% Hispanic 10,729 7.0% Two or more races 3,945 2.6% Black alone 766 0.5% Other race alone 570 0.4% Native Hawaiian and Other 74 0.05% American Indian alone
2000 2022
4,652,490 78.9% White alone 441,509 7.5% Hispanic 319,401 5.4% Asian alone 184,631 3.1% Black alone 175,926 3.0% Two or more races 85,396 1.4% American Indian alone 22,779 0.4% Native Hawaiian and Other 11,989 0.2% Other race alone
4,941,456 63.5% White alone 1,093,313 14.0% Hispanic 755,832 9.7% Asian alone 523,448 6.7% Two or more races 299,537 3.8% Black alone 69,024 0.9% American Indian alone 52,231 0.7% Native Hawaiian and Other 50,945 0.7% Other race alone
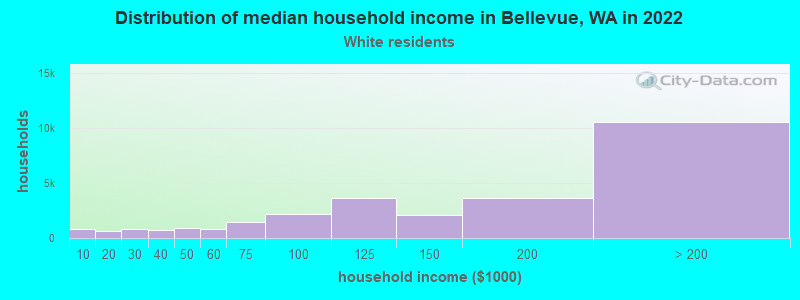
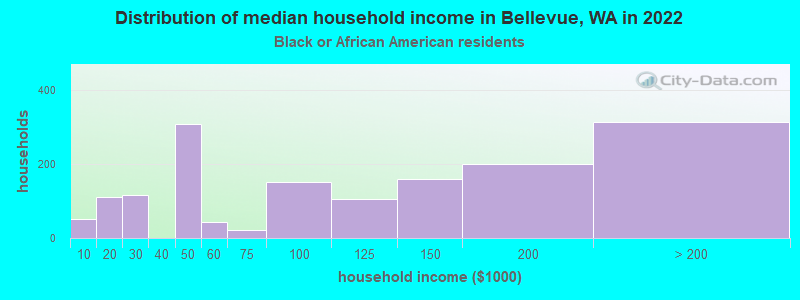
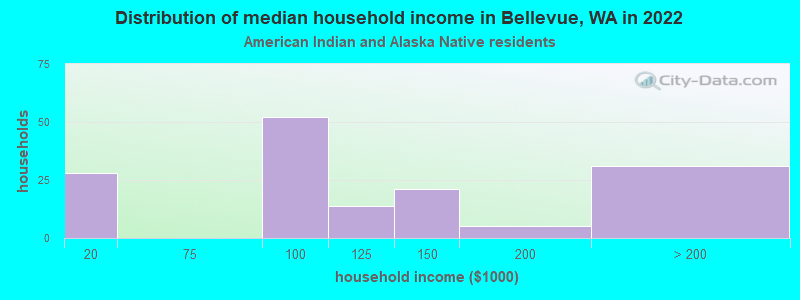
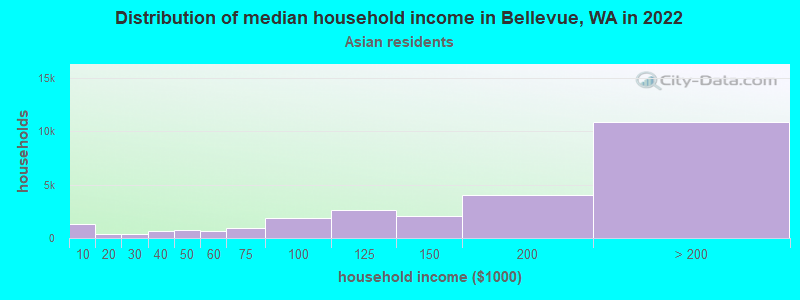
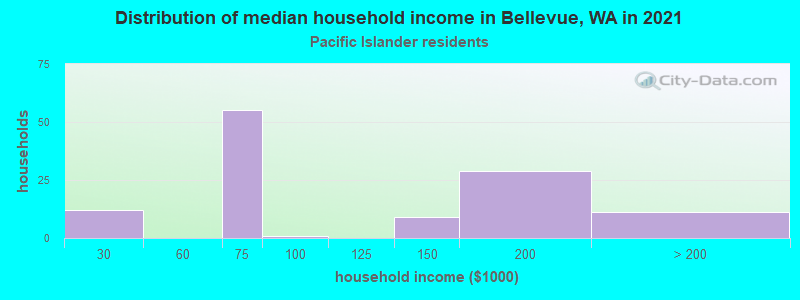
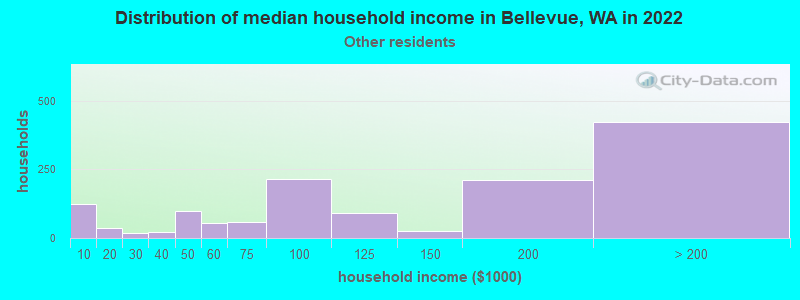
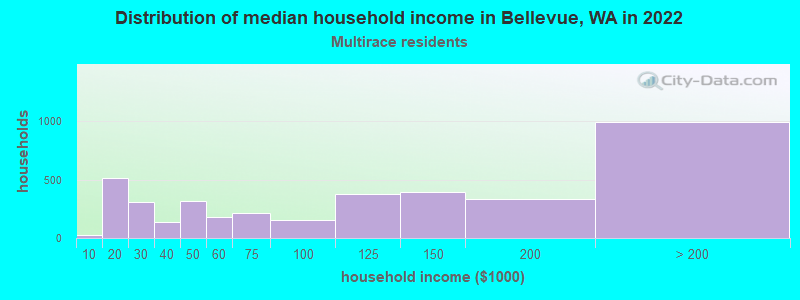
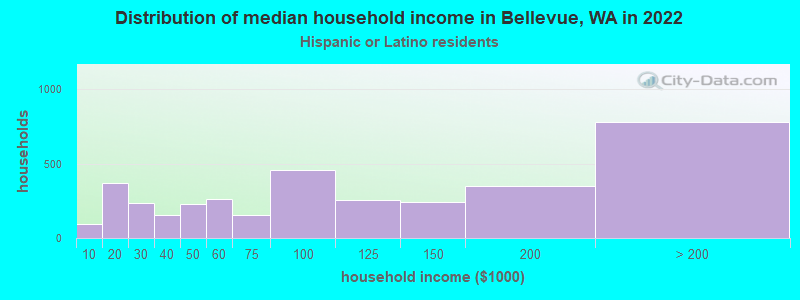
Income and house value in Bellevue Median household income in 2022 $152,007 White non-Hispanic householders$86,891 Black householders$167,228 Asian householdersover $200,000 Native Hawaiian and other Pacific Islander householders$91,924 Some other race householders$117,278 Two or more races householders$95,309 Hispanic or Latino race householdersMedian 2022 house value over $1,000,000 White Non-Hispanic householdersover $1,000,000 Black or African American householders$977,579 American Indian or Alaska Native householders over $1,000,000 Asian householdersover $1,000,000 Native Hawaiian and other Pacific Islander householdersover $1,000,000 Some other race householdersover $1,000,000 Two or more races householdersover $1,000,000 Hispanic or Latino householders
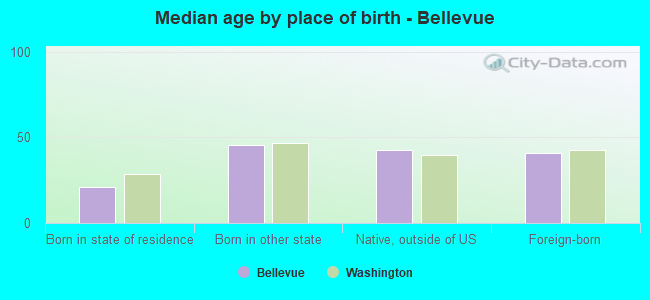
Median age by race in Bellevue
47.1 Median age for White residents45.2 50.6 33.6 Median age for Black or African American residents40.4 28.0 35.6 Median age for American Indian / Alaska Native residents-666,666,666.0 -666,666,666.0 35.8 Median age for Asian residents33.5 39.0 29.2 Median age for Native Hawaiian / Pacific Islander residents12.1 33.3 29.4 Median age for Other race residents29.9 27.2 25.8 Median age for Two or more races residents26.2 25.4 47.4 Median age for White alone residents45.4 50.7 32.4 Median age for Hispanic or Latino residents32.8 30.9
Owner/renter occupied households by race in Bellevue
House owners and renters - White residents 17,185 61.3% Owner occupied10,853 38.7% Renter occupiedHouse owners and renters - Black or African American residents 546 27.0% Owner occupied1,478 73.0% Renter occupiedHouse owners and renters - American Indian / Alaska Native residents 31 22.7% Owner occupied107 77.3% Renter occupiedHouse owners and renters - Asian residents 13,852 52.2% Owner occupied12,690 47.8% Renter occupiedHouse owners and renters - Native Hawaiian / Pacific Islander residents 42 43.4% Owner occupied55 56.6% Renter occupiedHouse owners and renters - Other race residents 241 22.5% Owner occupied829 77.5% Renter occupiedHouse owners and renters - Two or more races residents 869 19.4% Owner occupied3,607 80.6% Renter occupiedHouse owners and renters - White alone residents 16,934 61.7% Owner occupied10,531 38.3% Renter occupiedHouse owners and renters - Hispanic or Latino residents 433 11.8% Owner occupied3,251 88.2% Renter occupied
Language usage in Bellevue
English speakers - Total 50.4% of residents of Bellevue speak English at home.
6.7% of residents speak Spanish at home 5,976 60.9% Speak English very well3,844 39.1% Speak English less than very well42.9% of residents speak other language at home 44,040 69.8% Speak English very well19,085 30.2% Speak English less than very well
English speakers - Born in the United States 87.3% of residents of Bellevue speak English at home.
3.8% of residents speak Spanish at home 1,288 83.9% Speak English very well248 16.1% Speak English less than very well8.9% of residents speak other language at home 2,922 80.8% Speak English very well695 19.2% Speak English less than very well
English speakers - Native, born elsewhere 54.8% of residents of Bellevue speak English at home.
23.5% of residents speak Spanish at home 802 100.0% Speak English very well21.7% of residents speak other language at home 591 79.6% Speak English very well151 20.4% Speak English less than very well
English speakers - Foreign-born 14.1% of residents of Bellevue speak English at home.
7.7% of residents speak Spanish at home 1,596 31.9% Speak English very well3,410 68.1% Speak English less than very well78.2% of residents speak other language at home 33,288 65.3% Speak English very well17,656 34.7% Speak English less than very well
White (Caucasian) - Speak only English Native:
94.3% (45,755)Foreign-born:
30.6% (3,231)
White (Caucasian) - Speak another language Native:
5.7% (2,787)Foreign-born:
69.4% (7,336)
Black or African American - Speak only English Native:
93.5% (2,615)Foreign-born:
35.8% (403)
Black or African American - Speak another language Native:
6.7% (189)Foreign-born:
67.6% (760)
American Indian / Alaska Native - Speak another language Native:
22.1% (68)Foreign-born:
100.0% (62)
Asian - Speak only English Native:
43.5% (6,298)Foreign-born:
11.5% (5,426)
Asian - Speak another language Native:
56.5% (8,188)Foreign-born:
88.5% (41,817)
Native Hawaiian / Pacific Islander - Speak only English Native:
63.3% (150)Foreign-born:
67.2% (48)
Native Hawaiian / Pacific Islander - Speak another language Native:
35.7% (84)Foreign-born:
40.5% (29)
Other race - Speak only English Native:
20.8% (407)Foreign-born:
6.7% (161)
Other race - Speak another language Native:
79.2% (1,547)Foreign-born:
93.3% (2,256)
Two or more races - Speak only English Native:
69.1% (9,190)Foreign-born:
6.6% (259)
Two or more races - Speak another language Native:
30.9% (4,112)Foreign-born:
93.4% (3,681)
White alone - Speak only English Native:
94.5% (45,290)Foreign-born:
30.0% (3,070)
White alone - Speak another language Native:
5.5% (2,650)Foreign-born:
70.0% (7,152)
Hispanic or Latino - Speak only English Native:
45.2% (3,356)Foreign-born:
8.8% (473)
Hispanic or Latino - Speak another language Native:
54.8% (4,069)Foreign-born:
91.2% (4,913)
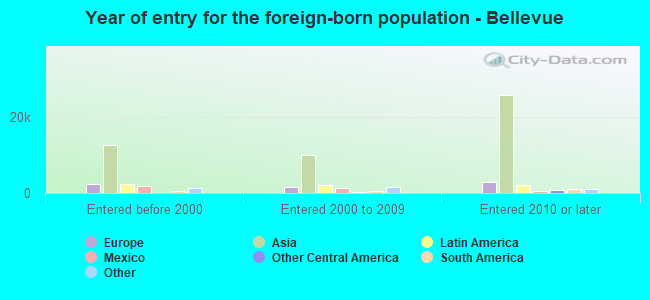
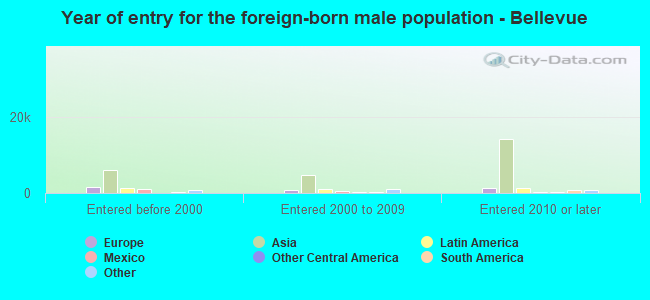
Foreign-born residents in Bellevue 64,295 residents are foreign born (29.6% Asia , 5.0% Europe ).
This city:
42.5%Washington:
14.9%
Marital status for residents in Bellevue Marital status - White (Caucasian) population 15 years and over
Males 29.7% Never married59.8% Now married0.3% Separated2.5% Widowed7.7% DivorcedFemales 19.9% Never married57.8% Now married0.8% Separated11.9% Widowed9.6% DivorcedWomen who gave birth in the past 12 months Now married:
100.0% (526)Unmarried:
0.0% (0)
Women who did not give birth in the past 12 months Now married:
53.0% (5,952)Unmarried:
47.0% (5,284)
Marital status - Black or African American population 15 years and over
Males 62.6% Never married24.2% Now married0.1% Separated1.6% Widowed11.6% DivorcedFemales 37.8% Never married24.2% Now married2.7% Separated4.1% Widowed31.2% DivorcedWomen who gave birth in the past 12 months Now married:
0.0% (0)Unmarried:
100.0% (35)
Women who did not give birth in the past 12 months Now married:
20.2% (190)Unmarried:
79.8% (749)
Marital status - American Indian / Alaska Native population 15 years and over
Males 75.5% Never married11.8% Now married0.0% Separated0.0% Widowed12.7% DivorcedFemales 55.9% Never married17.1% Now married0.0% Separated0.0% Widowed27.0% DivorcedWomen who gave birth in the past 12 months Now married:
0.0% (0)Unmarried:
100.0% (25)
Women who did not give birth in the past 12 months Now married:
0.0% (0)Unmarried:
100.0% (66)
Marital status - Asian population 15 years and over
Males 36.6% Never married61.1% Now married0.8% Separated0.0% Widowed1.5% DivorcedFemales 23.7% Never married64.9% Now married0.8% Separated5.2% Widowed5.5% DivorcedWomen who gave birth in the past 12 months Now married:
100.0% (505)Unmarried:
0.0% (0)
Women who did not give birth in the past 12 months Now married:
62.8% (11,039)Unmarried:
37.2% (6,527)
Marital status - Native Hawaiian / Pacific Islander population 15 years and over
Males 12.3% Never married73.7% Now married0.0% Separated0.0% Widowed14.0% DivorcedFemales 57.1% Never married38.7% Now married0.0% Separated0.0% Widowed4.3% DivorcedWomen who did not give birth in the past 12 months Now married:
9.7% (11)Unmarried:
90.3% (100)
Marital status - Other race population 15 years and over
Males 62.3% Never married28.8% Now married4.1% Separated0.0% Widowed4.7% DivorcedFemales 53.0% Never married35.8% Now married1.5% Separated0.8% Widowed8.9% DivorcedWomen who gave birth in the past 12 months Now married:
87.1% (61)Unmarried:
12.9% (9)
Women who did not give birth in the past 12 months Now married:
37.8% (414)Unmarried:
62.2% (681)
Marital status - Two or more races population 15 years and over
Males 50.8% Never married45.0% Now married0.8% Separated0.3% Widowed3.1% DivorcedFemales 46.5% Never married40.6% Now married1.3% Separated3.2% Widowed8.5% DivorcedWomen who gave birth in the past 12 months Now married:
100.0% (66)Unmarried:
0.0% (0)
Women who did not give birth in the past 12 months Now married:
38.6% (1,358)Unmarried:
61.4% (2,157)
Marital status - White alone, not Hispanic / Latino population 15 years and over
Males 29.3% Never married60.2% Now married0.4% Separated2.5% Widowed7.6% DivorcedFemales 19.9% Never married57.7% Now married0.8% Separated12.0% Widowed9.6% DivorcedWomen who gave birth in the past 12 months Now married:
100.0% (526)Unmarried:
0.0% (0)
Women who did not give birth in the past 12 months Now married:
52.8% (5,859)Unmarried:
47.2% (5,240)
Marital status - Hispanic or Latino population 15 years and over
Males 59.4% Never married33.5% Now married1.5% Separated0.0% Widowed5.6% DivorcedFemales 33.7% Never married55.2% Now married4.3% Separated2.0% Widowed4.8% DivorcedWomen who gave birth in the past 12 months Now married:
99.0% (107)Unmarried:
1.0% (1)
Women who did not give birth in the past 12 months Now married:
43.6% (1,471)Unmarried:
56.4% (1,903)
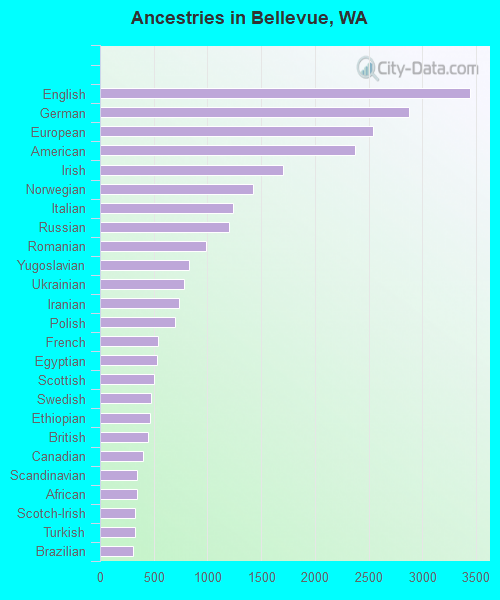
Ancestries in Bellevue
3,447 3.7% English2,871 3.0% German2,538 2.7% European2,373 2.5% American1,703 1.8% Irish1,427 1.5% Norwegian1,241 1.3% Italian1,200 1.3% Russian986 1.0% Romanian826 0.9% Yugoslavian777 0.8% Ukrainian731 0.8% Iranian702 0.7% Polish544 0.6% French531 0.6% Egyptian505 0.5% Scottish474 0.5% Swedish468 0.5% Ethiopian448 0.5% British401 0.4% Canadian348 0.4% Scandinavian341 0.4% African324 0.3% Scotch-Irish321 0.3% Turkish303 0.3% Brazilian294 0.3% Danish291 0.3% Moroccan288 0.3% Portuguese277 0.3% Northern European245 0.3% Armenian236 0.3% Jamaican234 0.2% Serbian230 0.2% Dutch174 0.2% Eastern European155 0.2% Israeli155 0.2% Welsh153 0.2% Czech143 0.2% French Canadian130 0.1% Slovak129 0.1% Swiss127 0.1% Bulgarian120 0.1% Belgian98 0.1% Nigerian91 0.10% Latvian89 0.09% Somali79 0.08% Hungarian62 0.07% Greek54 0.06% Lebanese53 0.06% Austrian49 0.05% Australian47 0.05% Finnish44 0.05% Jordanian40 0.04% Sudanese38 0.04% Icelander37 0.04% Guyanese31 0.03% Palestinian29 0.03% Croatian27 0.03% Haitian25 0.03% Estonian22 0.02% Kenyan20 0.02% Assyrian16 0.02% Ugandan11 0.01% Lithuanian11 0.01% South African10 0.01% Afghan7 0.01% New Zealander6 0.01% Slovene5 0.01% West Indian
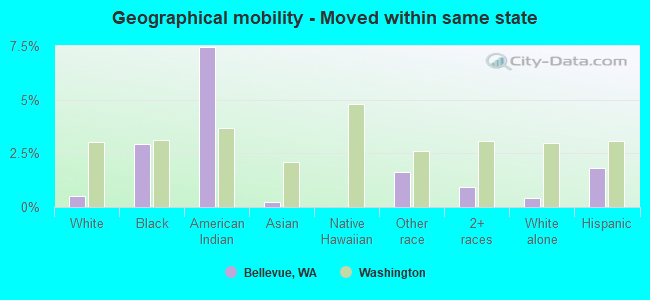
Geographical mobility in Bellevue Same house 1 year ago 52,716 87.1% White (Caucasian)3,070 76.1% Black or African American154 40.4% American Indian / Alaska Native47,888 75.6% Asian269 79.4% Native Hawaiian / Pacific Islander3,185 73.2% Other race10,708 78.2% Two or more races52,118 87.5% White alone, not Hispanic / Latino8,992 70.7% Hispanic or LatinoMoved within same county 5,620 9.3% White / Caucasian600 14.9% Black or African American190 49.6% American Indian / Alaska Native5,710 9.0% Asian67 19.8% Native Hawaiian / Pacific Islander771 17.7% Other race1,213 8.9% Two or more races5,414 9.1% White alone, not Hispanic / Latino1,811 14.2% Hispanic or LatinoMoved within same state 303 0.5% White / Caucasian119 2.9% Black or African American28 7.4% American Indian / Alaska Native147 0.2% Asian70 1.6% Other race126 0.9% Two or more races255 0.4% White alone, not Hispanic / Latino231 1.8% Hispanic or LatinoMoved from different state 1,556 2.6% White / Caucasian145 3.6% Black or African American18 4.6% American Indian / Alaska Native5,204 8.2% Asian221 5.1% Other race1,013 7.4% Two or more races1,461 2.5% White alone, not Hispanic / Latino1,412 11.1% Hispanic or LatinoMoved from abroad 330 0.5% White29 0.7% Black or African American4,436 7.0% Asian85 2.0% Other race497 3.6% Two or more races330 0.6% White alone, not Hispanic / Latino244 1.9% Hispanic or Latino
Children Nativity (place of birth) in Bellevue
Children under 6 years - Living with two parents Both parents native 1,404 100.0% NativeBoth parents foreign-born 2,962 76.3% Native921 23.7% Foreign-bornOne native, one foreign-born parent 1,219 100.0% NativeChildren under 6 years - Living with one parent Native parent 601 100.0% NativeForeign-born parent 292 100.0% NativeChildren 6 to 17 years - Living with two parents Both parents native 6,033 100.0% NativeBoth parents foreign-born 7,006 77.1% Native2,079 22.9% Foreign-bornOne native, one foreign-born parent 2,726 95.5% Native127 4.5% Foreign-bornChildren 6 to 17 years - Living with one parent Native parent 1,740 100.0% NativeForeign-born parent 1,605 56.0% Native1,260 44.0% Foreign-born
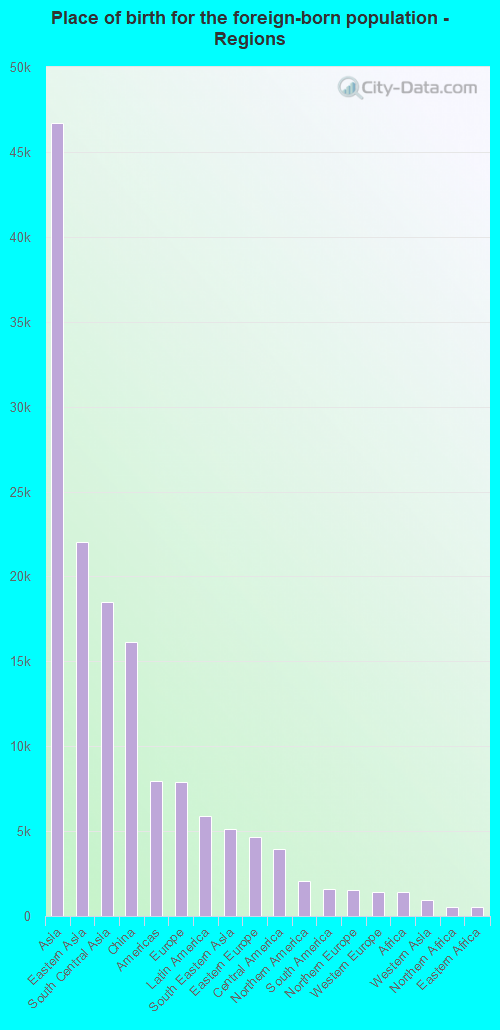
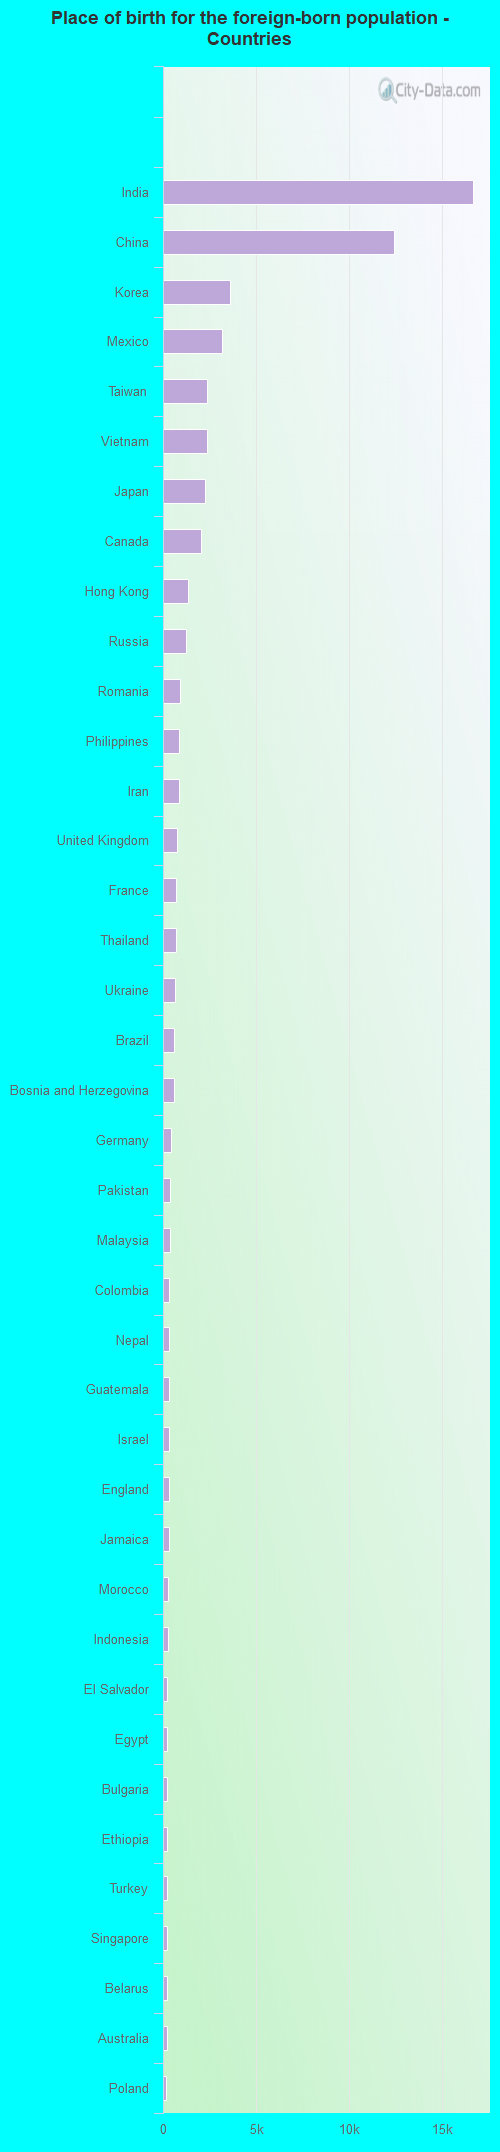
Place of birth for residents in Bellevue 46,705 Asia22,046 Eastern Asia18,493 South Central Asia16,131 China7,963 Americas7,921 Europe5,900 Latin America5,131 South Eastern Asia4,677 Eastern Europe3,929 Central America2,063 Northern America1,597 South America1,502 Northern Europe1,440 Western Europe1,400 Africa954 Western Asia526 Northern Africa503 Eastern Africa372 Caribbean304 Oceania300 Southern Europe242 Australia and New Zealand Subregion159 Western Africa134 Southern Africa65 Middle Africa16,678 India12,429 China3,603 Korea3,186 Mexico2,341 Taiwan2,338 Vietnam2,279 Japan2,063 Canada1,361 Hong Kong1,239 Russia898 Romania854 Philippines835 Iran768 United Kingdom707 France700 Thailand650 Ukraine577 Brazil567 Bosnia and Herzegovina422 Germany364 Pakistan356 Malaysia347 Colombia341 Nepal332 Guatemala321 Israel299 England296 Jamaica282 Morocco273 Indonesia234 El Salvador223 Egypt223 Bulgaria213 Ethiopia210 Turkey210 Singapore207 Belarus202 Australia156 Poland146 Cambodia145 Argentina144 Venezuela140 Belgium138 Ireland137 Czechoslovakia134 South Africa133 Moldova133 Honduras128 Ecuador122 Laos121 Portugal115 Chile113 Hungary112 Nigeria109 Italy105 Bangladesh98 Burma (Myanmar)97 Norway91 Azerbaijan90 Kenya90 Latvia80 United Arab Emirates74 Sweden69 Switzerland69 Uzbekistan65 Democratic Republic of Congo (Zaire)65 Cuba62 Netherlands59 Serbia55 Iraq55 Guyana52 Jordan47 Lebanon45 Afghanistan44 Uruguay39 Uganda39 Scotland39 New Zealand38 Spain38 Peru34 Croatia31 Greece30 Denmark30 Fiji26 Armenia22 Somalia19 Georgia17 Yemen15 Costa Rica15 Saudi Arabia15 Nicaragua14 Kuwait14 Ghana14 Austria13 Kazakhstan11 Panama10 Zimbabwe10 Sudan10 Haiti4 Liberia1 Algeria
Grandparents responsible for own grandchildren in Bellevue
Grandparents (30 to 59 years) White / Caucasian 5 15.9% Responsible for grandchildren28 84.1% Not responsible for grandchildrenAsian 58 100.0% Not responsible for grandchildrenTwo or more races 9 100.0% Responsible for grandchildrenWhite alone, not Hispanic / Latino 5 14.5% Responsible for grandchildren30 85.5% Not responsible for grandchildrenGrandparents (60 years and over) White / Caucasian 62 15.8% Responsible for grandchildren333 84.2% Not responsible for grandchildrenAsian 28 3.5% Responsible for grandchildren767 96.5% Not responsible for grandchildrenTwo or more races 18 100.0% Not responsible for grandchildrenWhite alone, not Hispanic / Latino 62 16.5% Responsible for grandchildren313 83.5% Not responsible for grandchildren