Races in Bellwood, Virginia (VA) Detailed Stats
Data:
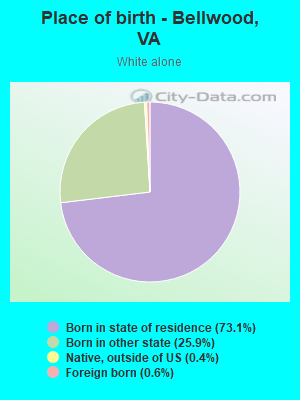
Races - White alone (%)
Races - White alone (% change since 2000)
Races - Black alone (%)
Races - Black alone (% change since 2000)
Races - American Indian alone (%)
Races - American Indian alone (% change since 2000)
Races - Asian alone (%)
Races - Asian alone (% change since 2000)
Races - Hispanic (%)
Races - Hispanic (% change since 2000)
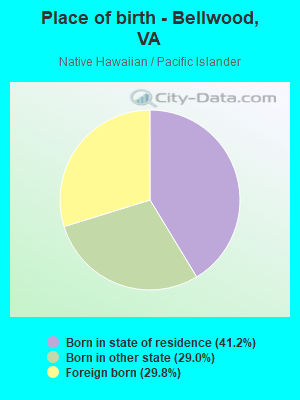
Races - Native Hawaiian and Other Pacific Islander alone (%)
Races - Native Hawaiian and Other Pacific Islander alone (% change since 2000)
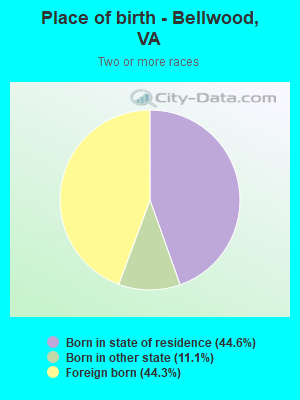
Races - Two or more races(%)
Races - Two or more races(% change since 2000)
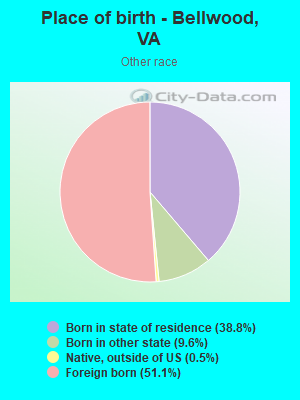
Races - Other race alone (%)
Races - Other race alone (% change since 2000)
Racial diversity
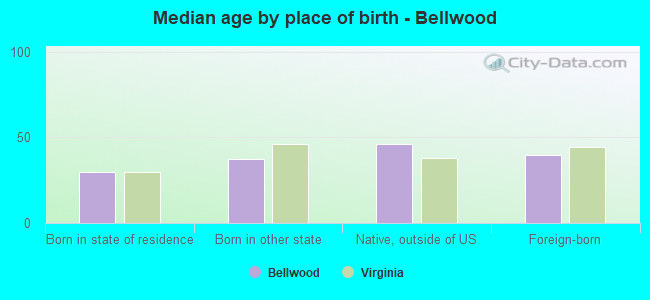
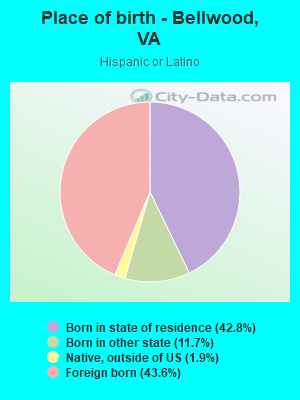
Place of birth - Born in state of residence (%)
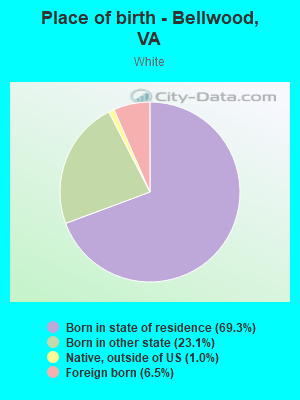
Place of birth - Born in state of residence (%) - White
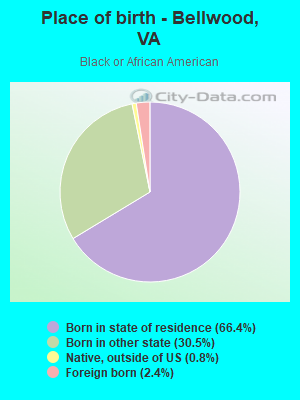
Place of birth - Born in state of residence (%) - Black or African American
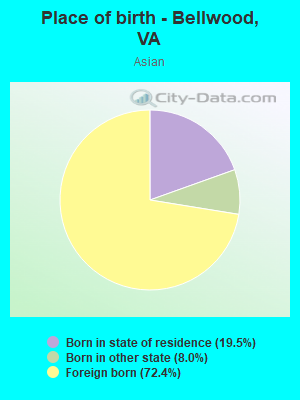
Place of birth - Born in state of residence (%) - Asian
Place of birth - Born in state of residence (%) - Hispanic or Latino
Place of birth - Born in state of residence (%) - American Indian and Alaska Native
Place of birth - Born in state of residence (%) - Multirace
Place of birth - Born in state of residence (%) - Other Race
Place of birth - Born in other state (%)
Place of birth - Born in other state (%) - White
Place of birth - Born in other state (%) - Black or African American
Place of birth - Born in other state (%) - Asian
Place of birth - Born in other state (%) - Hispanic or Latino
Place of birth - Born in other state (%) - American Indian and Alaska Native
Place of birth - Born in other state (%) - Multirace
Place of birth - Born in other state (%) - Other Race
Place of birth - Native, outside of US (%)
Place of birth - Native, outside of US (%) - White
Place of birth - Native, outside of US (%) - Black or African American
Place of birth - Native, outside of US (%) - Asian
Place of birth - Native, outside of US (%) - Hispanic or Latino
Place of birth - Native, outside of US (%) - American Indian and Alaska Native
Place of birth - Native, outside of US (%) - Multirace
Place of birth - Native, outside of US (%) - Other Race
Place of birth - Foreign born (%)
Place of birth - Foreign born (%) - White
Place of birth - Foreign born (%) - Black or African American
Place of birth - Foreign born (%) - Asian
Place of birth - Foreign born (%) - Hispanic or Latino
Place of birth - Foreign born (%) - American Indian and Alaska Native
Place of birth - Foreign born (%) - Multirace
Place of birth - Foreign born (%) - Other Race
Residents speaking English at home (%)
Residents speaking English at home - Born in the United States (%)
Residents speaking English at home - Native, born elsewhere (%)
Residents speaking English at home - Foreign born (%)
Residents speaking Spanish at home (%)
Residents speaking Spanish at home - Born in the United States (%)
Residents speaking Spanish at home - Native, born elsewhere (%)
Residents speaking Spanish at home - Foreign born (%)
Residents speaking other language at home (%)
Residents speaking other language at home - Born in the United States (%)
Residents speaking other language at home - Native, born elsewhere (%)
Residents speaking other language at home - Foreign born (%)
Marital status - Never married (%)
Marital status - Now married (%)
Marital status - Separated (%)
Marital status - Widowed (%)
Marital status - Divorced (%)
Ancestries Reported - Arab (%)
Ancestries Reported - Czech (%)
Ancestries Reported - Danish (%)
Ancestries Reported - Dutch (%)
Ancestries Reported - English (%)
Ancestries Reported - French (%)
Ancestries Reported - French Canadian (%)
Ancestries Reported - German (%)
Ancestries Reported - Greek (%)
Ancestries Reported - Hungarian (%)
Ancestries Reported - Irish (%)
Ancestries Reported - Italian (%)
Ancestries Reported - Lithuanian (%)
Ancestries Reported - Norwegian (%)
Ancestries Reported - Polish (%)
Ancestries Reported - Portuguese (%)
Ancestries Reported - Russian (%)
Ancestries Reported - Scotch-Irish (%)
Ancestries Reported - Scottish (%)
Ancestries Reported - Slovak (%)
Ancestries Reported - Subsaharan African (%)
Ancestries Reported - Swedish (%)
Ancestries Reported - Swiss (%)
Ancestries Reported - Ukrainian (%)
Ancestries Reported - United States (%)
Ancestries Reported - Welsh (%)
Ancestries Reported - West Indian (%)
Ancestries Reported - Other (%)
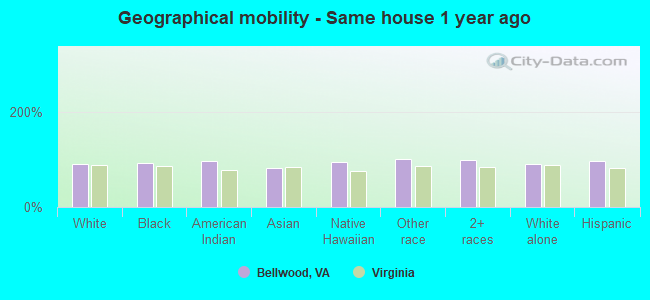
Geographical mobility - Same house 1 year ago (%)
Geographical mobility - Same house 1 year ago (%) - White
Geographical mobility - Same house 1 year ago (%) - Black or African American
Geographical mobility - Same house 1 year ago (%) - Asian
Geographical mobility - Same house 1 year ago (%) - Hispanic or Latino
Geographical mobility - Same house 1 year ago (%) - American Indian and Alaska Native
Geographical mobility - Same house 1 year ago (%) - Multirace
Geographical mobility - Same house 1 year ago (%) - Other Race
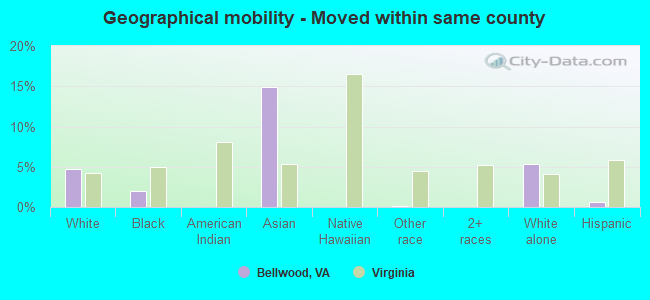
Geographical mobility - Moved within same county (%)
Geographical mobility - Moved within same county (%) - White
Geographical mobility - Moved within same county (%) - Black or African American
Geographical mobility - Moved within same county (%) - Asian
Geographical mobility - Moved within same county (%) - Hispanic or Latino
Geographical mobility - Moved within same county (%) - American Indian and Alaska Native
Geographical mobility - Moved within same county (%) - Multirace
Geographical mobility - Moved within same county (%) - Other Race
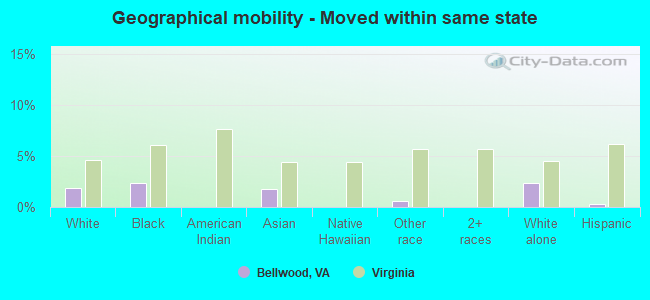
Geographical mobility - Moved from different county within same state (%)
Geographical mobility - Moved from different county within same state (%) - White
Geographical mobility - Moved from different county within same state (%) - Black or African American
Geographical mobility - Moved from different county within same state (%) - Asian
Geographical mobility - Moved from different county within same state (%) - Hispanic or Latino
Geographical mobility - Moved from different county within same state (%) - American Indian and Alaska Native
Geographical mobility - Moved from different county within same state (%) - Multirace
Geographical mobility - Moved from different county within same state (%) - Other Race
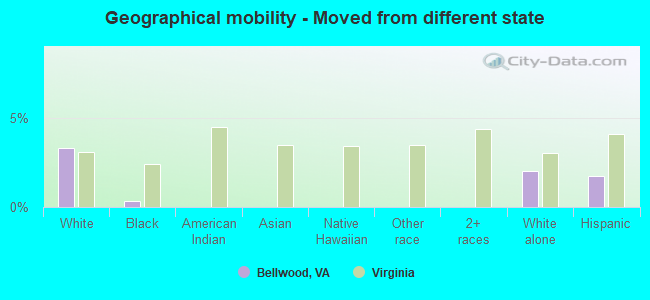
Geographical mobility - Moved from different state (%)
Geographical mobility - Moved from different state (%) - White
Geographical mobility - Moved from different state (%) - Black or African American
Geographical mobility - Moved from different state (%) - Asian
Geographical mobility - Moved from different state (%) - Hispanic or Latino
Geographical mobility - Moved from different state (%) - American Indian and Alaska Native
Geographical mobility - Moved from different state (%) - Multirace
Geographical mobility - Moved from different state (%) - Other Race
Geographical mobility - Moved from abroad (%)
Geographical mobility - Moved from abroad (%) - White
Geographical mobility - Moved from abroad (%) - Black or African American
Geographical mobility - Moved from abroad (%) - Asian
Geographical mobility - Moved from abroad (%) - Hispanic or Latino
Geographical mobility - Moved from abroad (%) - American Indian and Alaska Native
Geographical mobility - Moved from abroad (%) - Multirace
Geographical mobility - Moved from abroad (%) - Other Race
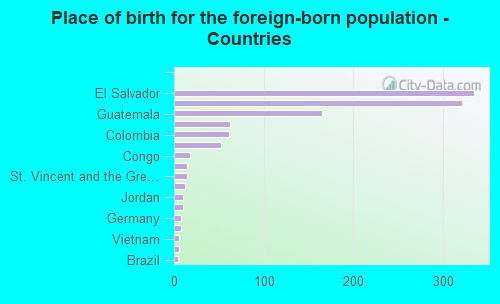
Place of birth for the foreign-born population - Ireland (%)
Place of birth for the foreign-born population - Denmark (%)
Place of birth for the foreign-born population - Norway (%)
Place of birth for the foreign-born population - Sweden (%)
Place of birth for the foreign-born population - United Kingdom (%)
Place of birth for the foreign-born population - England (%)
Place of birth for the foreign-born population - Scotland (%)
Place of birth for the foreign-born population - Other Northern Europe (%)
Place of birth for the foreign-born population - Austria (%)
Place of birth for the foreign-born population - Belgium (%)
Place of birth for the foreign-born population - France (%)
Place of birth for the foreign-born population - Germany (%)
Place of birth for the foreign-born population - Netherlands (%)
Place of birth for the foreign-born population - Switzerland (%)
Place of birth for the foreign-born population - Other Western Europe (%)
Place of birth for the foreign-born population - Greece (%)
Place of birth for the foreign-born population - Italy (%)
Place of birth for the foreign-born population - Portugal (%)
Place of birth for the foreign-born population - Spain (%)
Place of birth for the foreign-born population - Other Southern Europe (%)
Place of birth for the foreign-born population - Albania (%)
Place of birth for the foreign-born population - Belarus (%)
Place of birth for the foreign-born population - Bosnia and Herzegovina (%)
Place of birth for the foreign-born population - Bulgaria (%)
Place of birth for the foreign-born population - Croatia (%)
Place of birth for the foreign-born population - Czechoslovakia (%)
Place of birth for the foreign-born population - Hungary (%)
Place of birth for the foreign-born population - Latvia (%)
Place of birth for the foreign-born population - Lithuania (%)
Place of birth for the foreign-born population - North Macedonia (Macedonia) (%)
Place of birth for the foreign-born population - Moldova (%)
Place of birth for the foreign-born population - Poland (%)
Place of birth for the foreign-born population - Romania (%)
Place of birth for the foreign-born population - Russia (%)
Place of birth for the foreign-born population - Serbia (%)
Place of birth for the foreign-born population - Ukraine (%)
Place of birth for the foreign-born population - Other Eastern Europe (%)
Place of birth for the foreign-born population - China (%)
Place of birth for the foreign-born population - Hong Kong (%)
Place of birth for the foreign-born population - Taiwan (%)
Place of birth for the foreign-born population - Japan (%)
Place of birth for the foreign-born population - Korea (%)
Place of birth for the foreign-born population - Other Eastern Asia (%)
Place of birth for the foreign-born population - Afghanistan (%)
Place of birth for the foreign-born population - Bangladesh (%)
Place of birth for the foreign-born population - India (%)
Place of birth for the foreign-born population - Iran (%)
Place of birth for the foreign-born population - Kazakhstan (%)
Place of birth for the foreign-born population - Nepal (%)
Place of birth for the foreign-born population - Pakistan (%)
Place of birth for the foreign-born population - Sri Lanka (%)
Place of birth for the foreign-born population - Uzbekistan (%)
Place of birth for the foreign-born population - Other South Central Asia (%)
Place of birth for the foreign-born population - Burma (%)
Place of birth for the foreign-born population - Cambodia (%)
Place of birth for the foreign-born population - Indonesia (%)
Place of birth for the foreign-born population - Laos (%)
Place of birth for the foreign-born population - Malaysia (%)
Place of birth for the foreign-born population - Philippines (%)
Place of birth for the foreign-born population - Singapore (%)
Place of birth for the foreign-born population - Thailand (%)
Place of birth for the foreign-born population - Vietnam (%)
Place of birth for the foreign-born population - Other South Eastern Asia (%)
Place of birth for the foreign-born population - Armenia (%)
Place of birth for the foreign-born population - Iraq (%)
Place of birth for the foreign-born population - Israel (%)
Place of birth for the foreign-born population - Jordan (%)
Place of birth for the foreign-born population - Kuwait (%)
Place of birth for the foreign-born population - Lebanon (%)
Place of birth for the foreign-born population - Saudi Arabia (%)
Place of birth for the foreign-born population - Syria (%)
Place of birth for the foreign-born population - Turkey (%)
Place of birth for the foreign-born population - Yemen (%)
Place of birth for the foreign-born population - Other Western Asia (%)
Place of birth for the foreign-born population - Eritrea (%)
Place of birth for the foreign-born population - Ethiopia (%)
Place of birth for the foreign-born population - Kenya (%)
Place of birth for the foreign-born population - Somalia (%)
Place of birth for the foreign-born population - Uganda (%)
Place of birth for the foreign-born population - Zimbabwe (%)
Place of birth for the foreign-born population - Other Eastern Africa (%)
Place of birth for the foreign-born population - Cameroon (%)
Place of birth for the foreign-born population - Congo (%)
Place of birth for the foreign-born population - Democratic Republic of Congo (Zaire) (%)
Place of birth for the foreign-born population - Other Middle Africa (%)
Place of birth for the foreign-born population - Egypt (%)
Place of birth for the foreign-born population - Morocco (%)
Place of birth for the foreign-born population - Sudan (%)
Place of birth for the foreign-born population - Other Northern Africa (%)
Place of birth for the foreign-born population - South Africa (%)
Place of birth for the foreign-born population - Other Southern Africa (%)
Place of birth for the foreign-born population - Cabo Verde (%)
Place of birth for the foreign-born population - Ghana (%)
Place of birth for the foreign-born population - Liberia (%)
Place of birth for the foreign-born population - Nigeria (%)
Place of birth for the foreign-born population - Senegal (%)
Place of birth for the foreign-born population - Sierra Leone (%)
Place of birth for the foreign-born population - Other Western Africa (%)
Place of birth for the foreign-born population - Australia (%)
Place of birth for the foreign-born population - New Zealand (%)
Place of birth for the foreign-born population - Fiji (%)
Place of birth for the foreign-born population - Micronesia (%)
Place of birth for the foreign-born population - Bahamas (%)
Place of birth for the foreign-born population - Barbados (%)
Place of birth for the foreign-born population - Cuba (%)
Place of birth for the foreign-born population - Dominica (%)
Place of birth for the foreign-born population - Dominican Republic (%)
Place of birth for the foreign-born population - Grenada (%)
Place of birth for the foreign-born population - Haiti (%)
Place of birth for the foreign-born population - Jamaica (%)
Place of birth for the foreign-born population - St. Vincent and the Grenadines (%)
Place of birth for the foreign-born population - Trinidad and Tobago (%)
Place of birth for the foreign-born population - West Indies (%)
Place of birth for the foreign-born population - Other Caribbean (%)
Place of birth for the foreign-born population - Belize (%)
Place of birth for the foreign-born population - Costa Rica (%)
Place of birth for the foreign-born population - El Salvador (%)
Place of birth for the foreign-born population - Guatemala (%)
Place of birth for the foreign-born population - Honduras (%)
Place of birth for the foreign-born population - Mexico (%)
Place of birth for the foreign-born population - Nicaragua (%)
Place of birth for the foreign-born population - Panama (%)
Place of birth for the foreign-born population - Other Central America (%)
Place of birth for the foreign-born population - Argentina (%)
Place of birth for the foreign-born population - Bolivia (%)
Place of birth for the foreign-born population - Brazil (%)
Place of birth for the foreign-born population - Chile (%)
Place of birth for the foreign-born population - Colombia (%)
Place of birth for the foreign-born population - Ecuador (%)
Place of birth for the foreign-born population - Guyana (%)
Place of birth for the foreign-born population - Peru (%)
Place of birth for the foreign-born population - Uruguay (%)
Place of birth for the foreign-born population - Venezuela (%)
Place of birth for the foreign-born population - Other South America (%)
Place of birth for the foreign-born population - Canada (%)
Place of birth for the foreign-born population - Other Northern America (%)
Place of birth for the foreign-born population - Other (%)
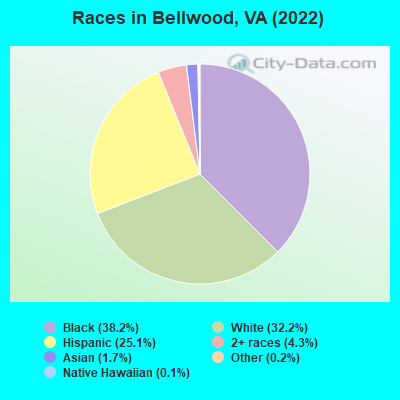
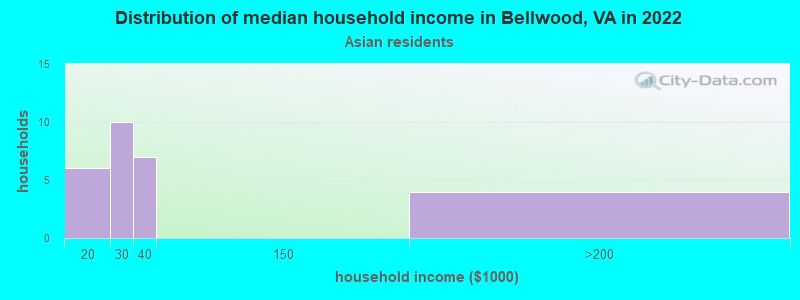
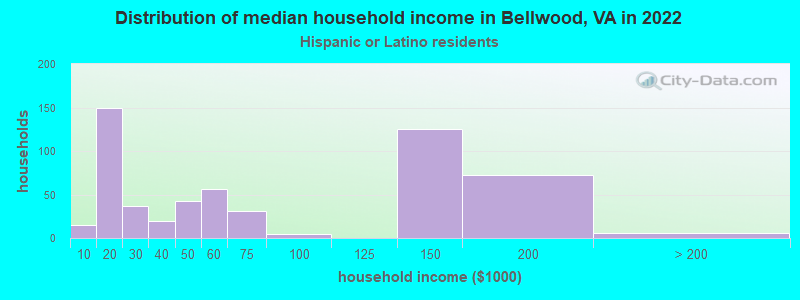
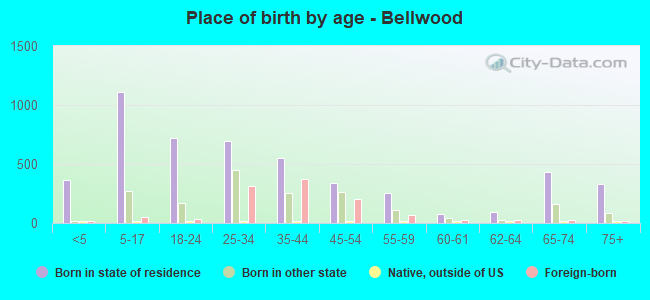
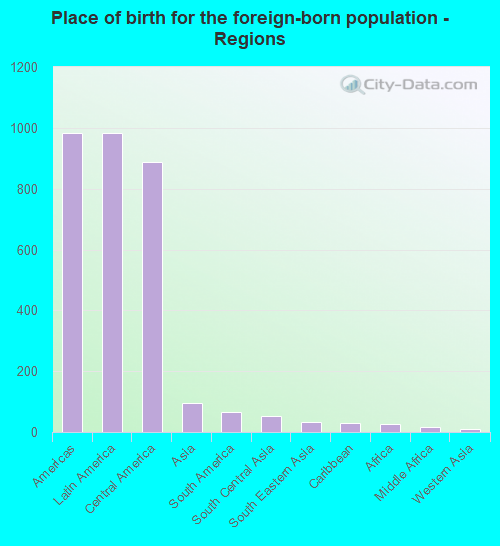
According to 2022 data, the most numerous races in Bellwood, VA are White alone (2,592 residents), Black alone (3,070 residents), and Hispanic (2,023 residents). 75.3% of Bellwood residents speak English at home. 13.9% of Bellwood, VA residents are foreign-born (12.5% born in Latin America), which is 13.4% greater than the foreign-born rate of 12.0% across the entire state of Virginia.
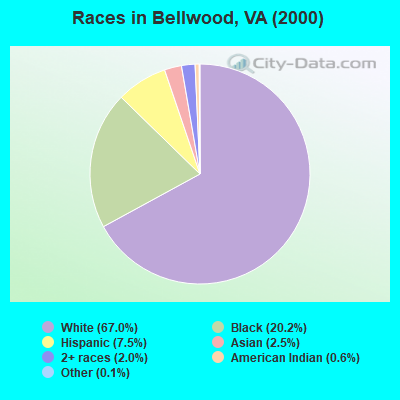
Race distribution in Bellwood
2000 2022
4,965,637 70.2% White alone 1,376,378 19.4% Black alone 329,540 4.7% Hispanic 259,277 3.7% Asian alone 114,022 1.6% Two or more races 18,596 0.3% American Indian alone 11,685 0.2% Other race alone 3,380 0.05% Native Hawaiian and Other
5,095,130 58.7% White alone 1,594,785 18.4% Black alone 905,750 10.4% Hispanic 602,881 6.9% Asian alone 406,047 4.7% Two or more races 60,419 0.7% Other race alone 11,738 0.1% American Indian alone 6,869 0.08% Native Hawaiian and Other
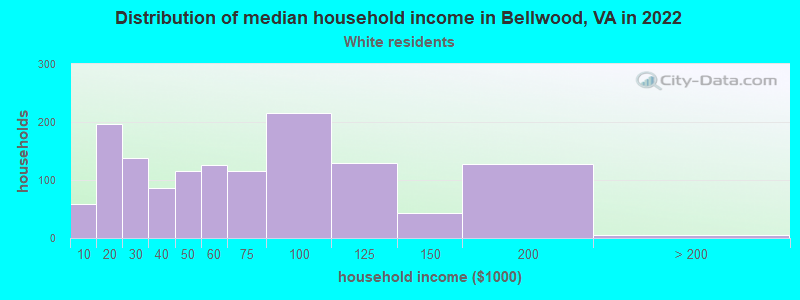
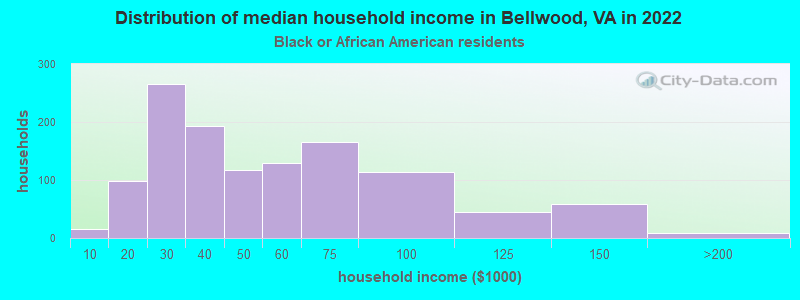
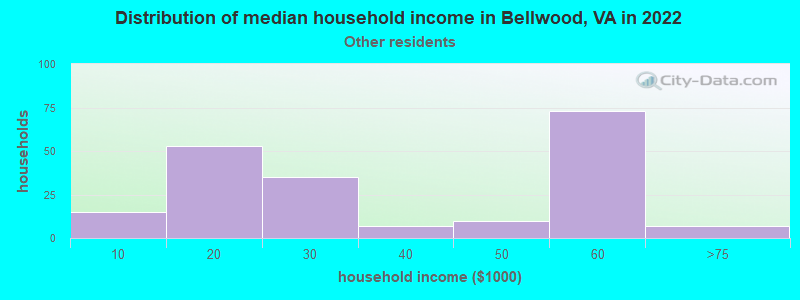
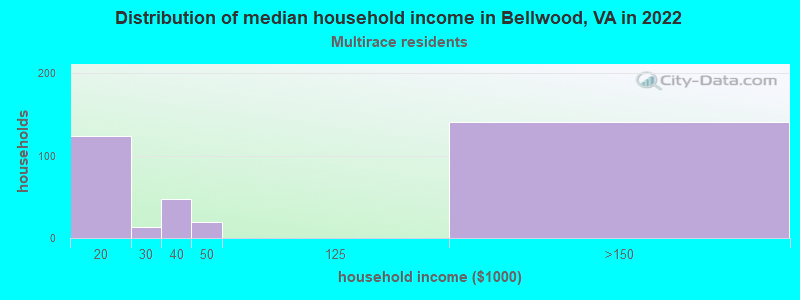
Income and house value in Bellwood Median household income in 2022 $56,814 White non-Hispanic householders$39,216 Black householders$28,297 Asian householders$60,936 Hispanic or Latino race householdersMedian 2022 house value $216,953 White Non-Hispanic householders$292,322 Black or African American householders$228,854 American Indian or Alaska Native householders $495,850 Asian householders$241,059 Some other race householders$287,745 Two or more races householders$241,059 Hispanic or Latino householders
Median age by race in Bellwood
39.0 Median age for White residents32.9 48.8 31.6 Median age for Black or African American residents33.3 30.9 -682,215,742.8 Median age for American Indian / Alaska Native residents-682,352,940.5 -687,861,271.0 24.5 Median age for Asian residents31.8 22.1 43.2 Median age for Native Hawaiian / Pacific Islander residents-541,531,822.5 50.9 23.5 Median age for Other race residents33.5 16.7 36.5 Median age for Two or more races residents39.0 22.4 45.4 Median age for White alone residents37.6 50.4 29.7 Median age for Hispanic or Latino residents29.8 29.3
Owner/renter occupied households by race in Bellwood
House owners and renters - White residents 769 54.7% Owner occupied637 45.3% Renter occupiedHouse owners and renters - Black or African American residents 533 45.3% Owner occupied643 54.7% Renter occupiedHouse owners and renters - American Indian / Alaska Native residents 3 100.0% Owner occupiedHouse owners and renters - Asian residents 23 83.5% Owner occupied5 16.5% Renter occupiedHouse owners and renters - Native Hawaiian / Pacific Islander residents 5 100.0% Owner occupiedHouse owners and renters - Other race residents 75 34.1% Owner occupied145 65.9% Renter occupiedHouse owners and renters - Two or more races residents 38 11.9% Owner occupied282 88.1% Renter occupiedHouse owners and renters - White alone residents 661 51.5% Owner occupied622 48.5% Renter occupiedHouse owners and renters - Hispanic or Latino residents 201 36.6% Owner occupied349 63.4% Renter occupied
Language usage in Bellwood
English speakers - Total 75.3% of residents of Bellwood speak English at home.
19.2% of residents speak Spanish at home 828 56.0% Speak English very well650 44.0% Speak English less than very well3.9% of residents speak other language at home 234 77.5% Speak English very well68 22.5% Speak English less than very well
English speakers - Born in the United States 87.7% of residents of Bellwood speak English at home.
11.9% of residents speak Spanish at home 216 100.0% Speak English very well0.6% of residents speak other language at home 10 100.0% Speak English very well
English speakers - Native, born elsewhere 33.8% of residents of Bellwood speak English at home.
49.3% of residents speak Spanish at home 32 91.4% Speak English very well3 8.6% Speak English less than very well14.1% of residents speak other language at home 10 100.0% Speak English very well
English speakers - Foreign-born 3.5% of residents of Bellwood speak English at home.
71.4% of residents speak Spanish at home 302 36.7% Speak English very well522 63.3% Speak English less than very well12.2% of residents speak other language at home 80 56.7% Speak English very well61 43.3% Speak English less than very well
White (Caucasian) - Speak another language Native:
5.9% (165)Foreign-born:
82.8% (170)
Black or African American - Speak only English Native:
93.1% (2,738)Foreign-born:
52.4% (39)
Black or African American - Speak another language Native:
9.0% (265)Foreign-born:
38.9% (29)
Asian - Speak another language Native:
100.0% (25)Foreign-born:
100.0% (100)
Native Hawaiian / Pacific Islander - Speak another language Native:
38.6% (8)Foreign-born:
49.7% (5)
Other race - Speak another language Native:
75.8% (207)Foreign-born:
92.4% (337)
Two or more races - Speak another language Native:
45.6% (286)Foreign-born:
98.5% (500)
White alone - Speak another language Native:
2.5% (63)Foreign-born:
89.9% (14)
Hispanic or Latino - Speak another language Native:
51.4% (507)Foreign-born:
97.9% (845)
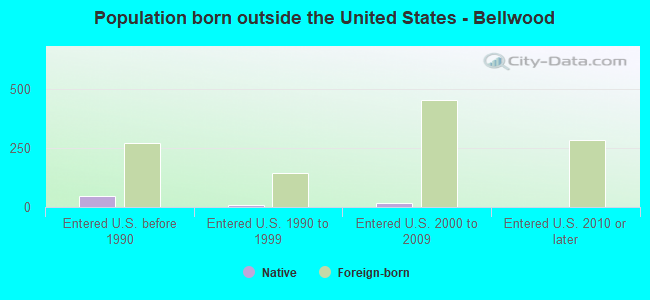
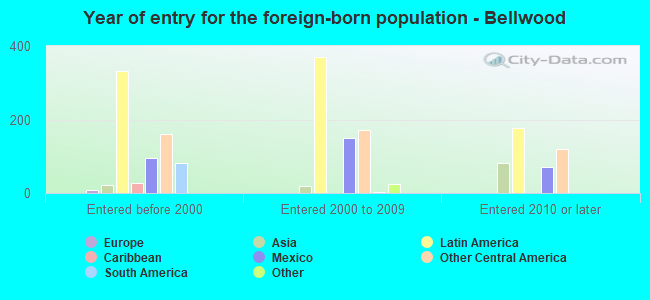
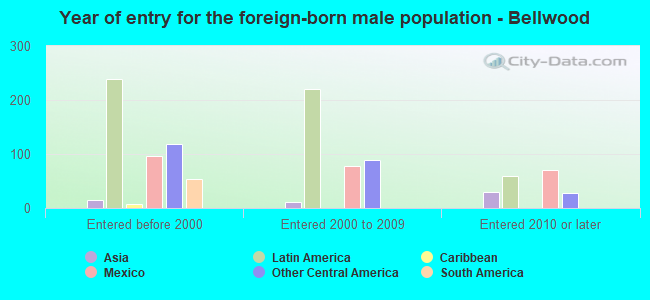
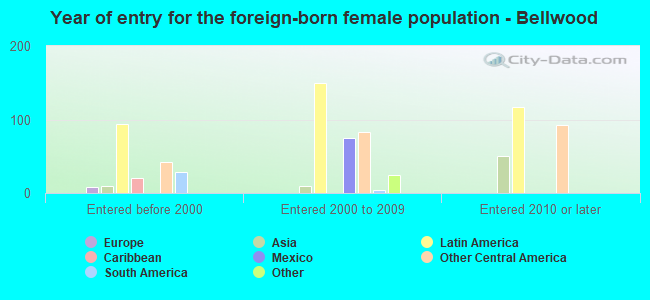
Foreign-born residents in Bellwood 1,115 residents are foreign born (12.5% Latin America ).
This city:
13.9%Virginia:
12.6%
Marital status for residents in Bellwood Marital status - White (Caucasian) population 15 years and over
Males 38.9% Never married43.0% Now married1.9% Separated2.9% Widowed13.3% DivorcedFemales 24.8% Never married39.6% Now married2.5% Separated11.3% Widowed21.8% DivorcedWomen who gave birth in the past 12 months Now married:
40.0% (17)Unmarried:
60.0% (26)
Women who did not give birth in the past 12 months Now married:
41.9% (259)Unmarried:
58.1% (360)
Marital status - Black or African American population 15 years and over
Males 68.8% Never married23.1% Now married2.9% Separated0.7% Widowed4.6% DivorcedFemales 64.1% Never married16.2% Now married0.8% Separated6.6% Widowed12.3% DivorcedWomen who gave birth in the past 12 months Now married:
82.2% (39)Unmarried:
17.8% (8)
Women who did not give birth in the past 12 months Now married:
12.5% (126)Unmarried:
87.5% (878)
Marital status - Asian population 15 years and over
Males 25.8% Never married74.2% Now married0.0% Separated0.0% Widowed0.0% DivorcedFemales 26.1% Never married60.9% Now married0.0% Separated13.0% Widowed0.0% DivorcedWomen who did not give birth in the past 12 months Now married:
58.6% (17)Unmarried:
41.4% (12)
Marital status - Native Hawaiian / Pacific Islander population 15 years and over
Males 100.0% Never married0.0% Now married0.0% Separated0.0% Widowed0.0% DivorcedFemales 27.8% Never married72.2% Now married0.0% Separated0.0% Widowed0.0% DivorcedWomen who did not give birth in the past 12 months Now married:
61.5% (8)Unmarried:
38.5% (5)
Marital status - Other race population 15 years and over
Males 4.5% Never married89.9% Now married0.0% Separated0.0% Widowed5.6% DivorcedFemales 24.1% Never married70.6% Now married2.6% Separated2.6% Widowed0.0% DivorcedWomen who gave birth in the past 12 months Now married:
100.0% (30)Unmarried:
0.0% (0)
Women who did not give birth in the past 12 months Now married:
71.6% (148)Unmarried:
28.4% (59)
Marital status - Two or more races population 15 years and over
Males 65.3% Never married32.5% Now married2.1% Separated0.0% Widowed0.0% DivorcedFemales 47.8% Never married37.8% Now married0.0% Separated0.0% Widowed14.3% DivorcedWomen who gave birth in the past 12 months Now married:
62.3% (72)Unmarried:
37.7% (44)
Women who did not give birth in the past 12 months Now married:
21.4% (47)Unmarried:
78.6% (171)
Marital status - White alone, not Hispanic / Latino population 15 years and over
Males 32.5% Never married46.7% Now married2.5% Separated1.9% Widowed16.4% DivorcedFemales 25.4% Never married37.5% Now married1.9% Separated12.2% Widowed22.9% DivorcedWomen who gave birth in the past 12 months Now married:
0.0% (0)Unmarried:
100.0% (27)
Women who did not give birth in the past 12 months Now married:
42.3% (239)Unmarried:
57.7% (326)
Marital status - Hispanic or Latino population 15 years and over
Males 47.8% Never married47.9% Now married0.0% Separated2.7% Widowed1.6% DivorcedFemales 30.9% Never married58.6% Now married3.4% Separated2.6% Widowed4.4% DivorcedWomen who gave birth in the past 12 months Now married:
75.4% (54)Unmarried:
24.6% (18)
Women who did not give birth in the past 12 months Now married:
56.3% (229)Unmarried:
43.7% (178)
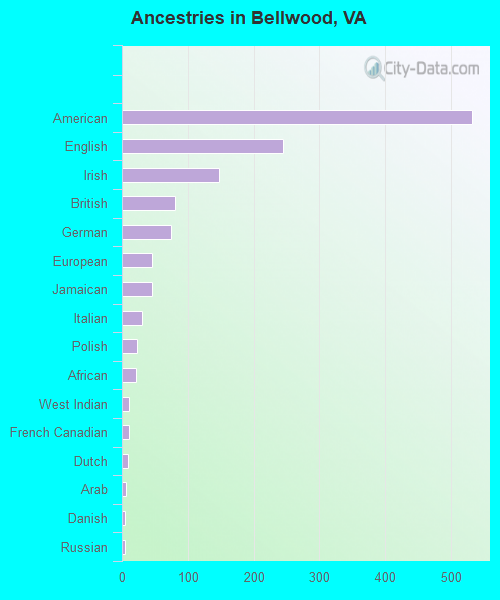
Ancestries in Bellwood
531 11.9% American244 5.5% English147 3.3% Irish81 1.8% British74 1.7% German45 1.0% European45 1.0% Jamaican30 0.7% Italian23 0.5% Polish21 0.5% African11 0.2% West Indian10 0.2% French Canadian9 0.2% Dutch6 0.1% Arab5 0.1% Danish5 0.1% Russian4 0.09% Brazilian
Children Nativity (place of birth) in Bellwood
Children under 6 years - Living with two parents Both parents native 154 100.0% NativeBoth parents foreign-born 124 100.0% NativeChildren under 6 years - Living with one parent Native parent 118 100.0% NativeForeign-born parent 27 89.9% Native3 10.1% Foreign-bornChildren 6 to 17 years - Living with two parents Both parents native 422 100.0% NativeBoth parents foreign-born 304 88.2% Native41 11.8% Foreign-bornChildren 6 to 17 years - Living with one parent Native parent 564 100.0% NativeForeign-born parent 79 52.3% Native72 47.7% Foreign-born
Grandparents responsible for own grandchildren in Bellwood
Grandparents (30 to 59 years) Black or African American 8 100.0% Not responsible for grandchildrenGrandparents (60 years and over) Black or African American 32 76.2% Responsible for grandchildren10 23.8% Not responsible for grandchildren