Races in Bemidji, Minnesota (MN) Detailed Stats
Data:
Races - White alone (%)
Races - White alone (% change since 2000)
Races - Black alone (%)
Races - Black alone (% change since 2000)
Races - American Indian alone (%)
Races - American Indian alone (% change since 2000)
Races - Asian alone (%)
Races - Asian alone (% change since 2000)
Races - Hispanic (%)
Races - Hispanic (% change since 2000)
Races - Native Hawaiian and Other Pacific Islander alone (%)
Races - Native Hawaiian and Other Pacific Islander alone (% change since 2000)
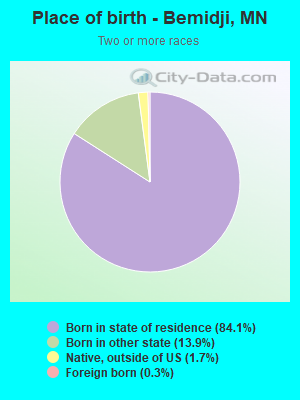
Races - Two or more races(%)
Races - Two or more races(% change since 2000)
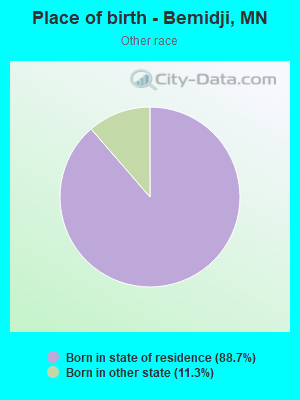
Races - Other race alone (%)
Races - Other race alone (% change since 2000)
Racial diversity
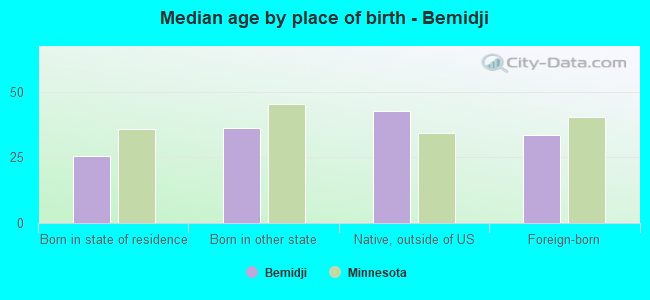
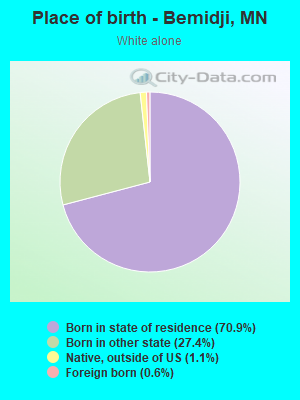
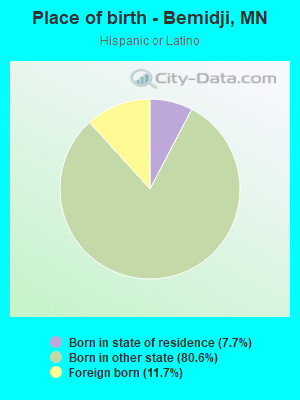
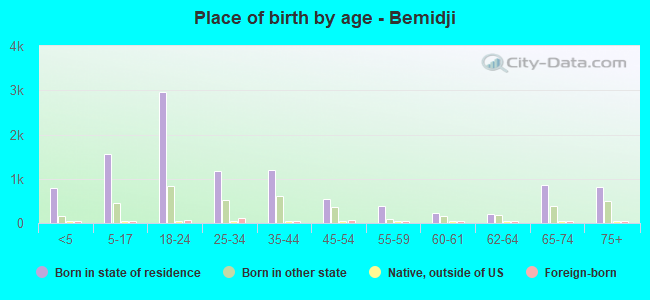
Place of birth - Born in state of residence (%)
Place of birth - Born in state of residence (%) - White
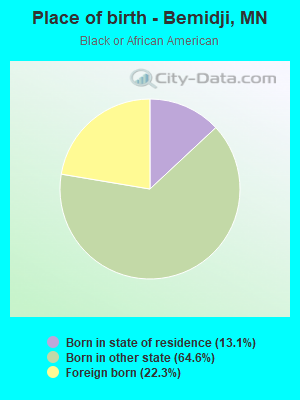
Place of birth - Born in state of residence (%) - Black or African American
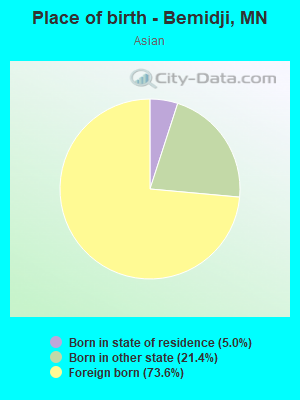
Place of birth - Born in state of residence (%) - Asian
Place of birth - Born in state of residence (%) - Hispanic or Latino
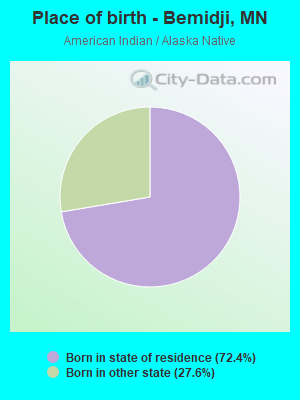
Place of birth - Born in state of residence (%) - American Indian and Alaska Native
Place of birth - Born in state of residence (%) - Multirace
Place of birth - Born in state of residence (%) - Other Race
Place of birth - Born in other state (%)
Place of birth - Born in other state (%) - White
Place of birth - Born in other state (%) - Black or African American
Place of birth - Born in other state (%) - Asian
Place of birth - Born in other state (%) - Hispanic or Latino
Place of birth - Born in other state (%) - American Indian and Alaska Native
Place of birth - Born in other state (%) - Multirace
Place of birth - Born in other state (%) - Other Race
Place of birth - Native, outside of US (%)
Place of birth - Native, outside of US (%) - White
Place of birth - Native, outside of US (%) - Black or African American
Place of birth - Native, outside of US (%) - Asian
Place of birth - Native, outside of US (%) - Hispanic or Latino
Place of birth - Native, outside of US (%) - American Indian and Alaska Native
Place of birth - Native, outside of US (%) - Multirace
Place of birth - Native, outside of US (%) - Other Race
Place of birth - Foreign born (%)
Place of birth - Foreign born (%) - White
Place of birth - Foreign born (%) - Black or African American
Place of birth - Foreign born (%) - Asian
Place of birth - Foreign born (%) - Hispanic or Latino
Place of birth - Foreign born (%) - American Indian and Alaska Native
Place of birth - Foreign born (%) - Multirace
Place of birth - Foreign born (%) - Other Race
Residents speaking English at home (%)
Residents speaking English at home - Born in the United States (%)
Residents speaking English at home - Native, born elsewhere (%)
Residents speaking English at home - Foreign born (%)
Residents speaking Spanish at home (%)
Residents speaking Spanish at home - Born in the United States (%)
Residents speaking Spanish at home - Native, born elsewhere (%)
Residents speaking Spanish at home - Foreign born (%)
Residents speaking other language at home (%)
Residents speaking other language at home - Born in the United States (%)
Residents speaking other language at home - Native, born elsewhere (%)
Residents speaking other language at home - Foreign born (%)
Marital status - Never married (%)
Marital status - Now married (%)
Marital status - Separated (%)
Marital status - Widowed (%)
Marital status - Divorced (%)
Ancestries Reported - Arab (%)
Ancestries Reported - Czech (%)
Ancestries Reported - Danish (%)
Ancestries Reported - Dutch (%)
Ancestries Reported - English (%)
Ancestries Reported - French (%)
Ancestries Reported - French Canadian (%)
Ancestries Reported - German (%)
Ancestries Reported - Greek (%)
Ancestries Reported - Hungarian (%)
Ancestries Reported - Irish (%)
Ancestries Reported - Italian (%)
Ancestries Reported - Lithuanian (%)
Ancestries Reported - Norwegian (%)
Ancestries Reported - Polish (%)
Ancestries Reported - Portuguese (%)
Ancestries Reported - Russian (%)
Ancestries Reported - Scotch-Irish (%)
Ancestries Reported - Scottish (%)
Ancestries Reported - Slovak (%)
Ancestries Reported - Subsaharan African (%)
Ancestries Reported - Swedish (%)
Ancestries Reported - Swiss (%)
Ancestries Reported - Ukrainian (%)
Ancestries Reported - United States (%)
Ancestries Reported - Welsh (%)
Ancestries Reported - West Indian (%)
Ancestries Reported - Other (%)
Geographical mobility - Same house 1 year ago (%)
Geographical mobility - Same house 1 year ago (%) - White
Geographical mobility - Same house 1 year ago (%) - Black or African American
Geographical mobility - Same house 1 year ago (%) - Asian
Geographical mobility - Same house 1 year ago (%) - Hispanic or Latino
Geographical mobility - Same house 1 year ago (%) - American Indian and Alaska Native
Geographical mobility - Same house 1 year ago (%) - Multirace
Geographical mobility - Same house 1 year ago (%) - Other Race
Geographical mobility - Moved within same county (%)
Geographical mobility - Moved within same county (%) - White
Geographical mobility - Moved within same county (%) - Black or African American
Geographical mobility - Moved within same county (%) - Asian
Geographical mobility - Moved within same county (%) - Hispanic or Latino
Geographical mobility - Moved within same county (%) - American Indian and Alaska Native
Geographical mobility - Moved within same county (%) - Multirace
Geographical mobility - Moved within same county (%) - Other Race
Geographical mobility - Moved from different county within same state (%)
Geographical mobility - Moved from different county within same state (%) - White
Geographical mobility - Moved from different county within same state (%) - Black or African American
Geographical mobility - Moved from different county within same state (%) - Asian
Geographical mobility - Moved from different county within same state (%) - Hispanic or Latino
Geographical mobility - Moved from different county within same state (%) - American Indian and Alaska Native
Geographical mobility - Moved from different county within same state (%) - Multirace
Geographical mobility - Moved from different county within same state (%) - Other Race
Geographical mobility - Moved from different state (%)
Geographical mobility - Moved from different state (%) - White
Geographical mobility - Moved from different state (%) - Black or African American
Geographical mobility - Moved from different state (%) - Asian
Geographical mobility - Moved from different state (%) - Hispanic or Latino
Geographical mobility - Moved from different state (%) - American Indian and Alaska Native
Geographical mobility - Moved from different state (%) - Multirace
Geographical mobility - Moved from different state (%) - Other Race
Geographical mobility - Moved from abroad (%)
Geographical mobility - Moved from abroad (%) - White
Geographical mobility - Moved from abroad (%) - Black or African American
Geographical mobility - Moved from abroad (%) - Asian
Geographical mobility - Moved from abroad (%) - Hispanic or Latino
Geographical mobility - Moved from abroad (%) - American Indian and Alaska Native
Geographical mobility - Moved from abroad (%) - Multirace
Geographical mobility - Moved from abroad (%) - Other Race
Place of birth for the foreign-born population - Ireland (%)
Place of birth for the foreign-born population - Denmark (%)
Place of birth for the foreign-born population - Norway (%)
Place of birth for the foreign-born population - Sweden (%)
Place of birth for the foreign-born population - United Kingdom (%)
Place of birth for the foreign-born population - England (%)
Place of birth for the foreign-born population - Scotland (%)
Place of birth for the foreign-born population - Other Northern Europe (%)
Place of birth for the foreign-born population - Austria (%)
Place of birth for the foreign-born population - Belgium (%)
Place of birth for the foreign-born population - France (%)
Place of birth for the foreign-born population - Germany (%)
Place of birth for the foreign-born population - Netherlands (%)
Place of birth for the foreign-born population - Switzerland (%)
Place of birth for the foreign-born population - Other Western Europe (%)
Place of birth for the foreign-born population - Greece (%)
Place of birth for the foreign-born population - Italy (%)
Place of birth for the foreign-born population - Portugal (%)
Place of birth for the foreign-born population - Spain (%)
Place of birth for the foreign-born population - Other Southern Europe (%)
Place of birth for the foreign-born population - Albania (%)
Place of birth for the foreign-born population - Belarus (%)
Place of birth for the foreign-born population - Bosnia and Herzegovina (%)
Place of birth for the foreign-born population - Bulgaria (%)
Place of birth for the foreign-born population - Croatia (%)
Place of birth for the foreign-born population - Czechoslovakia (%)
Place of birth for the foreign-born population - Hungary (%)
Place of birth for the foreign-born population - Latvia (%)
Place of birth for the foreign-born population - Lithuania (%)
Place of birth for the foreign-born population - North Macedonia (Macedonia) (%)
Place of birth for the foreign-born population - Moldova (%)
Place of birth for the foreign-born population - Poland (%)
Place of birth for the foreign-born population - Romania (%)
Place of birth for the foreign-born population - Russia (%)
Place of birth for the foreign-born population - Serbia (%)
Place of birth for the foreign-born population - Ukraine (%)
Place of birth for the foreign-born population - Other Eastern Europe (%)
Place of birth for the foreign-born population - China (%)
Place of birth for the foreign-born population - Hong Kong (%)
Place of birth for the foreign-born population - Taiwan (%)
Place of birth for the foreign-born population - Japan (%)
Place of birth for the foreign-born population - Korea (%)
Place of birth for the foreign-born population - Other Eastern Asia (%)
Place of birth for the foreign-born population - Afghanistan (%)
Place of birth for the foreign-born population - Bangladesh (%)
Place of birth for the foreign-born population - India (%)
Place of birth for the foreign-born population - Iran (%)
Place of birth for the foreign-born population - Kazakhstan (%)
Place of birth for the foreign-born population - Nepal (%)
Place of birth for the foreign-born population - Pakistan (%)
Place of birth for the foreign-born population - Sri Lanka (%)
Place of birth for the foreign-born population - Uzbekistan (%)
Place of birth for the foreign-born population - Other South Central Asia (%)
Place of birth for the foreign-born population - Burma (%)
Place of birth for the foreign-born population - Cambodia (%)
Place of birth for the foreign-born population - Indonesia (%)
Place of birth for the foreign-born population - Laos (%)
Place of birth for the foreign-born population - Malaysia (%)
Place of birth for the foreign-born population - Philippines (%)
Place of birth for the foreign-born population - Singapore (%)
Place of birth for the foreign-born population - Thailand (%)
Place of birth for the foreign-born population - Vietnam (%)
Place of birth for the foreign-born population - Other South Eastern Asia (%)
Place of birth for the foreign-born population - Armenia (%)
Place of birth for the foreign-born population - Iraq (%)
Place of birth for the foreign-born population - Israel (%)
Place of birth for the foreign-born population - Jordan (%)
Place of birth for the foreign-born population - Kuwait (%)
Place of birth for the foreign-born population - Lebanon (%)
Place of birth for the foreign-born population - Saudi Arabia (%)
Place of birth for the foreign-born population - Syria (%)
Place of birth for the foreign-born population - Turkey (%)
Place of birth for the foreign-born population - Yemen (%)
Place of birth for the foreign-born population - Other Western Asia (%)
Place of birth for the foreign-born population - Eritrea (%)
Place of birth for the foreign-born population - Ethiopia (%)
Place of birth for the foreign-born population - Kenya (%)
Place of birth for the foreign-born population - Somalia (%)
Place of birth for the foreign-born population - Uganda (%)
Place of birth for the foreign-born population - Zimbabwe (%)
Place of birth for the foreign-born population - Other Eastern Africa (%)
Place of birth for the foreign-born population - Cameroon (%)
Place of birth for the foreign-born population - Congo (%)
Place of birth for the foreign-born population - Democratic Republic of Congo (Zaire) (%)
Place of birth for the foreign-born population - Other Middle Africa (%)
Place of birth for the foreign-born population - Egypt (%)
Place of birth for the foreign-born population - Morocco (%)
Place of birth for the foreign-born population - Sudan (%)
Place of birth for the foreign-born population - Other Northern Africa (%)
Place of birth for the foreign-born population - South Africa (%)
Place of birth for the foreign-born population - Other Southern Africa (%)
Place of birth for the foreign-born population - Cabo Verde (%)
Place of birth for the foreign-born population - Ghana (%)
Place of birth for the foreign-born population - Liberia (%)
Place of birth for the foreign-born population - Nigeria (%)
Place of birth for the foreign-born population - Senegal (%)
Place of birth for the foreign-born population - Sierra Leone (%)
Place of birth for the foreign-born population - Other Western Africa (%)
Place of birth for the foreign-born population - Australia (%)
Place of birth for the foreign-born population - New Zealand (%)
Place of birth for the foreign-born population - Fiji (%)
Place of birth for the foreign-born population - Micronesia (%)
Place of birth for the foreign-born population - Bahamas (%)
Place of birth for the foreign-born population - Barbados (%)
Place of birth for the foreign-born population - Cuba (%)
Place of birth for the foreign-born population - Dominica (%)
Place of birth for the foreign-born population - Dominican Republic (%)
Place of birth for the foreign-born population - Grenada (%)
Place of birth for the foreign-born population - Haiti (%)
Place of birth for the foreign-born population - Jamaica (%)
Place of birth for the foreign-born population - St. Vincent and the Grenadines (%)
Place of birth for the foreign-born population - Trinidad and Tobago (%)
Place of birth for the foreign-born population - West Indies (%)
Place of birth for the foreign-born population - Other Caribbean (%)
Place of birth for the foreign-born population - Belize (%)
Place of birth for the foreign-born population - Costa Rica (%)
Place of birth for the foreign-born population - El Salvador (%)
Place of birth for the foreign-born population - Guatemala (%)
Place of birth for the foreign-born population - Honduras (%)
Place of birth for the foreign-born population - Mexico (%)
Place of birth for the foreign-born population - Nicaragua (%)
Place of birth for the foreign-born population - Panama (%)
Place of birth for the foreign-born population - Other Central America (%)
Place of birth for the foreign-born population - Argentina (%)
Place of birth for the foreign-born population - Bolivia (%)
Place of birth for the foreign-born population - Brazil (%)
Place of birth for the foreign-born population - Chile (%)
Place of birth for the foreign-born population - Colombia (%)
Place of birth for the foreign-born population - Ecuador (%)
Place of birth for the foreign-born population - Guyana (%)
Place of birth for the foreign-born population - Peru (%)
Place of birth for the foreign-born population - Uruguay (%)
Place of birth for the foreign-born population - Venezuela (%)
Place of birth for the foreign-born population - Other South America (%)
Place of birth for the foreign-born population - Canada (%)
Place of birth for the foreign-born population - Other Northern America (%)
Place of birth for the foreign-born population - Other (%)
Latest news about races in Bemidji, MN collected exclusively by city-data.com from local newspapers, TV, and radio stations
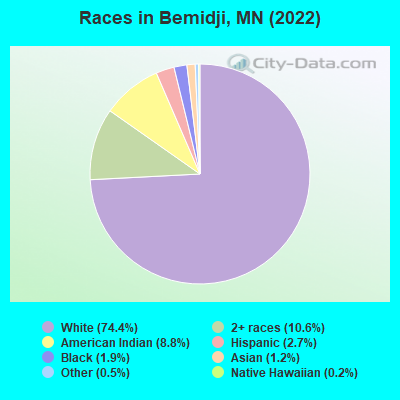
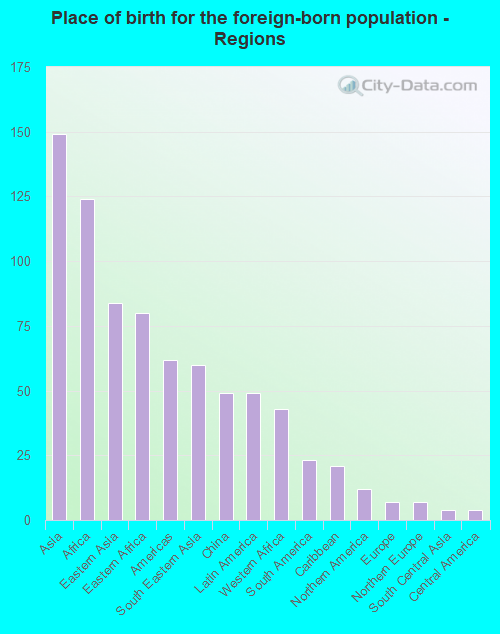
According to 2022 data, the most numerous races in Bemidji, MN are White alone (11,531 residents), Black alone (288 residents), and Hispanic (425 residents). 95.5% of Bemidji residents speak English at home. 2.2% of Bemidji, MN residents are foreign-born (0.9% born in Asia, 0.8% born in Africa, 0.3% born in Latin America), which is 262.6% less than the foreign-born rate of 8.0% across the entire state of Minnesota.
Race distribution in Bemidji
2000 2022
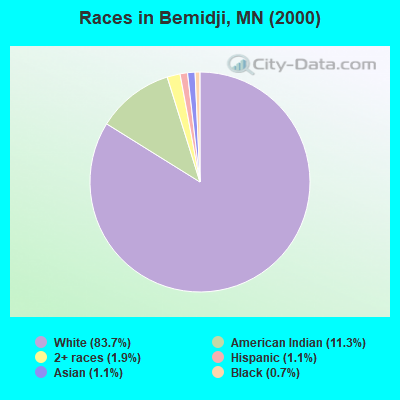
4,337,143 88.2% White alone 168,813 3.4% Black alone 143,382 2.9% Hispanic 141,083 2.9% Asian alone 70,304 1.4% Two or more races 52,009 1.1% American Indian alone 5,031 0.1% Other race alone 1,714 0.03% Native Hawaiian and Other
4,356,347 76.2% White alone 395,179 6.9% Black alone 333,830 5.8% Hispanic 294,800 5.2% Asian alone 259,649 4.5% Two or more races 42,125 0.7% American Indian alone 32,976 0.6% Other race alone 2,278 0.04% Native Hawaiian and Other
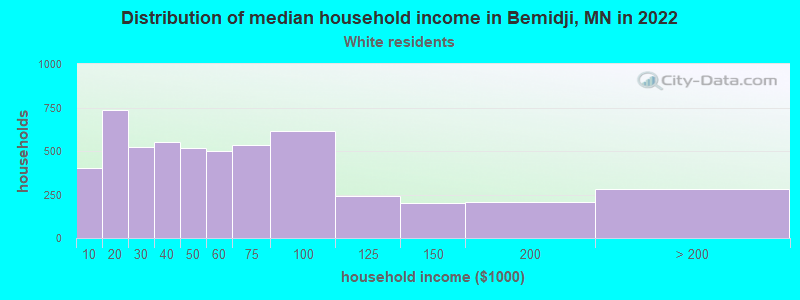
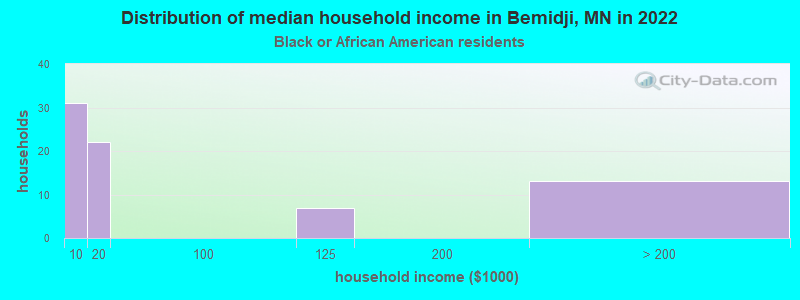
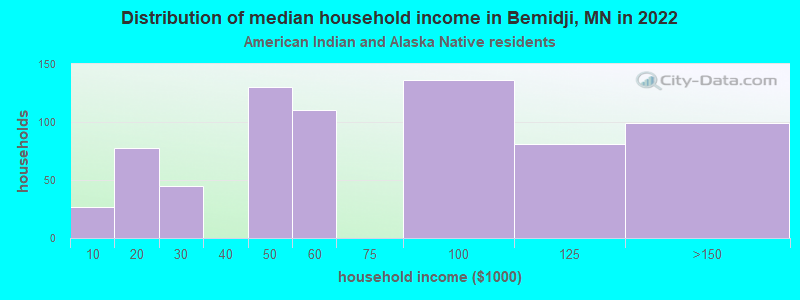
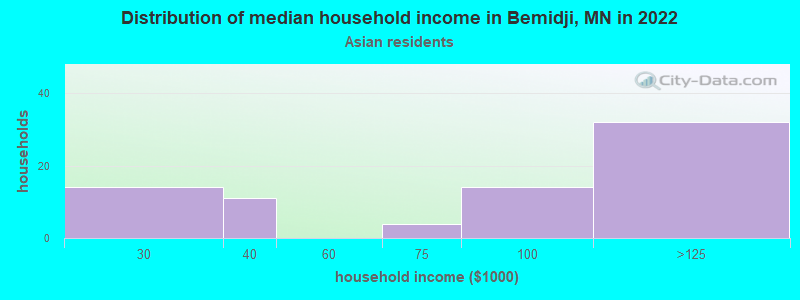
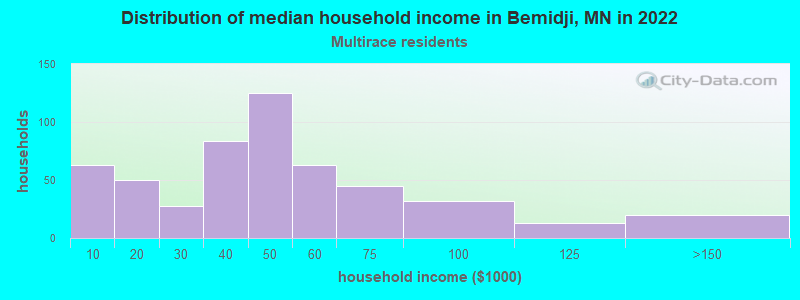
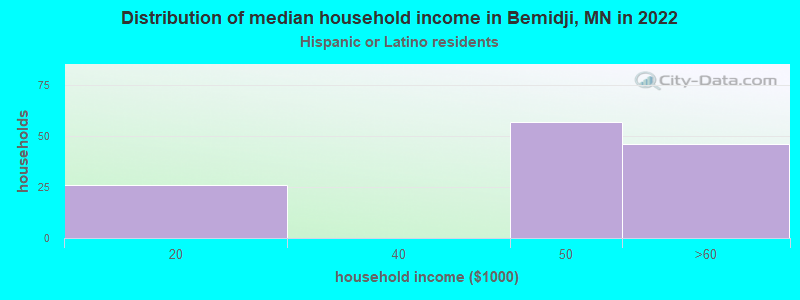
Income and house value in Bemidji Median household income in 2022 $47,769 White non-Hispanic householders$58,997 American Indian and Alaska Native householders$88,096 Asian householders$43,382 Two or more races householders$39,355 Hispanic or Latino race householdersMedian 2022 house value $219,339 White Non-Hispanic householders$431,461 Black or African American householders$173,525 American Indian or Alaska Native householders $44,244 Asian householders$259,504 Two or more races householders
Median age by race in Bemidji
31.3 Median age for White residents30.1 34.2 22.7 Median age for Black or African American residents18.1 23.9 27.7 Median age for American Indian / Alaska Native residents33.3 25.1 34.5 Median age for Asian residents53.9 30.2 -744,336,568.8 Median age for Native Hawaiian / Pacific Islander residents-856,799,036.4 -534,959,349.1 42.9 Median age for Other race residents43.9 -669,099,756.0 20.9 Median age for Two or more races residents22.1 21.5 31.2 Median age for White alone residents29.7 34.2 18.3 Median age for Hispanic or Latino residents23.6 12.2
Owner/renter occupied households by race in Bemidji
House owners and renters - White residents 2,293 43.6% Owner occupied2,967 56.4% Renter occupiedHouse owners and renters - Black or African American residents 8 12.0% Owner occupied58 88.0% Renter occupiedHouse owners and renters - American Indian / Alaska Native residents 150 21.2% Owner occupied558 78.8% Renter occupiedHouse owners and renters - Asian residents 48 66.3% Owner occupied25 33.7% Renter occupiedHouse owners and renters - Other race residents 16 66.7% Owner occupied8 33.3% Renter occupiedHouse owners and renters - Two or more races residents 175 31.9% Owner occupied374 68.1% Renter occupiedHouse owners and renters - White alone residents 2,284 43.2% Owner occupied2,999 56.8% Renter occupiedHouse owners and renters - Hispanic or Latino residents 23 18.6% Owner occupied101 81.4% Renter occupied
Language usage in Bemidji
English speakers - Total 95.5% of residents of Bemidji speak English at home.
0.5% of residents speak Spanish at home 70 94.6% Speak English very well4 5.4% Speak English less than very well3.8% of residents speak other language at home 357 64.3% Speak English very well198 35.7% Speak English less than very well
English speakers - Born in the United States 95.0% of residents of Bemidji speak English at home.
0.6% of residents speak Spanish at home 25 100.0% Speak English very well4.3% of residents speak other language at home 157 90.2% Speak English very well17 9.8% Speak English less than very well
English speakers - Native, born elsewhere 80.4% of residents of Bemidji speak English at home.
15.5% of residents speak other language at home 23 100.0% Speak English very well
English speakers - Foreign-born 38.6% of residents of Bemidji speak English at home.
6.4% of residents speak Spanish at home 18 81.8% Speak English very well4 18.2% Speak English less than very well54.1% of residents speak other language at home 40 21.6% Speak English very well145 78.4% Speak English less than very well
White (Caucasian) - Speak only English Native:
99.4% (10,866)Foreign-born:
100.0% (74)
White (Caucasian) - Speak another language Native:
0.9% (99)Foreign-born:
6.2% (5)
Black or African American - Speak only English Native:
92.3% (281)Foreign-born:
22.8% (22)
Black or African American - Speak another language Native:
5.9% (18)Foreign-born:
76.8% (74)
Asian - Speak only English Native:
47.1% (23)Foreign-born:
10.3% (15)
Asian - Speak another language Native:
53.4% (26)Foreign-born:
89.9% (128)
Two or more races - Speak another language Native:
3.0% (40)Foreign-born:
100.0% (6)
White alone - Speak only English Native:
99.0% (10,859)Foreign-born:
96.1% (69)
White alone - Speak another language Native:
1.0% (114)Foreign-born:
8.9% (6)
Hispanic or Latino - Speak only English Native:
96.5% (290)Foreign-born:
60.6% (30)
Hispanic or Latino - Speak another language Native:
6.8% (20)Foreign-born:
50.5% (25)
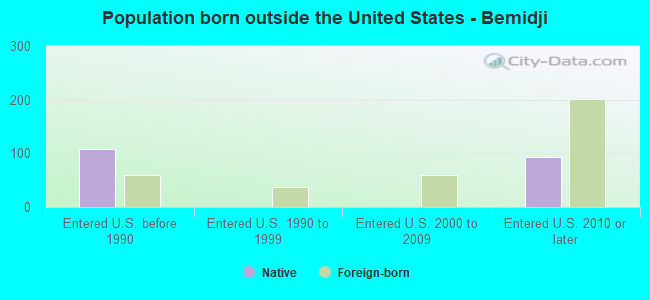
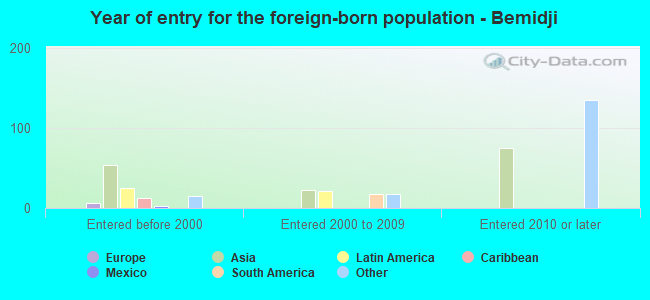
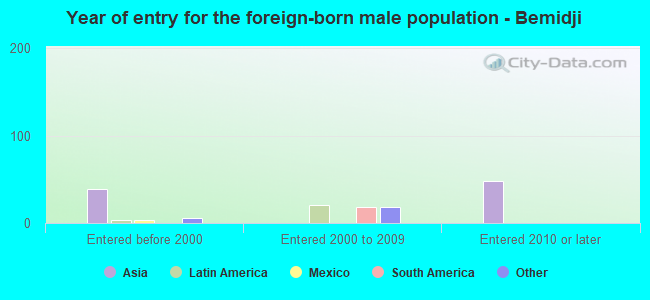
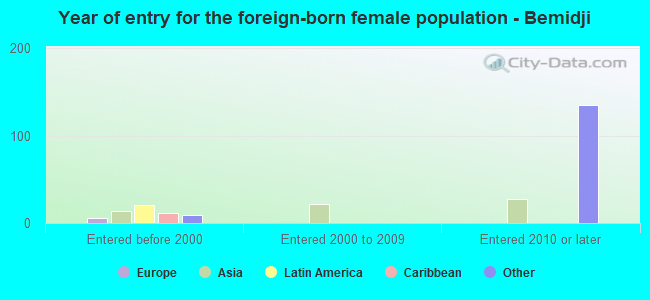
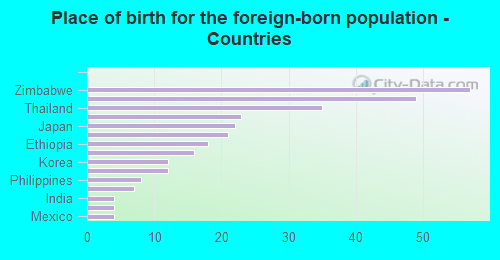
Foreign-born residents in Bemidji 342 residents are foreign born (0.9% Asia , 0.8% Africa , 0.3% Latin America ).
This city:
2.2%Minnesota:
8.5%
Marital status for residents in Bemidji Marital status - White (Caucasian) population 15 years and over
Males 52.2% Never married35.3% Now married1.9% Separated2.0% Widowed8.6% DivorcedFemales 42.7% Never married32.1% Now married0.5% Separated10.0% Widowed14.7% DivorcedWomen who gave birth in the past 12 months Now married:
66.0% (94)Unmarried:
34.0% (48)
Women who did not give birth in the past 12 months Now married:
26.7% (775)Unmarried:
73.3% (2,129)
Marital status - Black or African American population 15 years and over
Males 79.2% Never married20.8% Now married0.0% Separated0.0% Widowed0.0% DivorcedFemales 66.9% Never married6.5% Now married0.0% Separated0.0% Widowed26.6% DivorcedWomen who did not give birth in the past 12 months Now married:
5.3% (6)Unmarried:
94.7% (111)
Marital status - American Indian / Alaska Native population 15 years and over
Males 69.2% Never married14.8% Now married0.0% Separated0.8% Widowed15.2% DivorcedFemales 71.4% Never married6.9% Now married0.0% Separated19.6% Widowed2.1% DivorcedWomen who gave birth in the past 12 months Now married:
0.0% (0)Unmarried:
100.0% (6)
Women who did not give birth in the past 12 months Now married:
10.8% (44)Unmarried:
89.2% (360)
Marital status - Asian population 15 years and over
Males 39.0% Never married61.0% Now married0.0% Separated0.0% Widowed0.0% DivorcedFemales 55.6% Never married44.4% Now married0.0% Separated0.0% Widowed0.0% DivorcedWomen who did not give birth in the past 12 months Now married:
41.6% (33)Unmarried:
58.4% (46)
Marital status - Other race population 15 years and over
Males 0.0% Never married71.4% Now married0.0% Separated0.0% Widowed28.6% DivorcedFemales 0.0% Never married100.0% Now married0.0% Separated0.0% Widowed0.0% DivorcedWomen who did not give birth in the past 12 months Now married:
100.0% (16)Unmarried:
0.0% (0)
Marital status - Two or more races population 15 years and over
Males 78.0% Never married13.4% Now married1.8% Separated0.0% Widowed6.8% DivorcedFemales 59.2% Never married8.2% Now married0.0% Separated0.0% Widowed32.6% DivorcedWomen who gave birth in the past 12 months Now married:
0.0% (0)Unmarried:
100.0% (88)
Women who did not give birth in the past 12 months Now married:
12.1% (46)Unmarried:
87.9% (332)
Marital status - White alone, not Hispanic / Latino population 15 years and over
Males 52.2% Never married35.6% Now married1.9% Separated2.0% Widowed8.2% DivorcedFemales 42.4% Never married32.3% Now married0.5% Separated10.1% Widowed14.7% DivorcedWomen who gave birth in the past 12 months Now married:
66.0% (95)Unmarried:
34.0% (49)
Women who did not give birth in the past 12 months Now married:
26.9% (786)Unmarried:
73.1% (2,135)
Marital status - Hispanic or Latino population 15 years and over
Males 58.1% Never married26.4% Now married0.0% Separated0.0% Widowed15.5% DivorcedFemales 56.0% Never married19.0% Now married0.0% Separated0.0% Widowed25.0% DivorcedWomen who did not give birth in the past 12 months Now married:
19.0% (17)Unmarried:
81.0% (72)
Ancestries in Bemidji
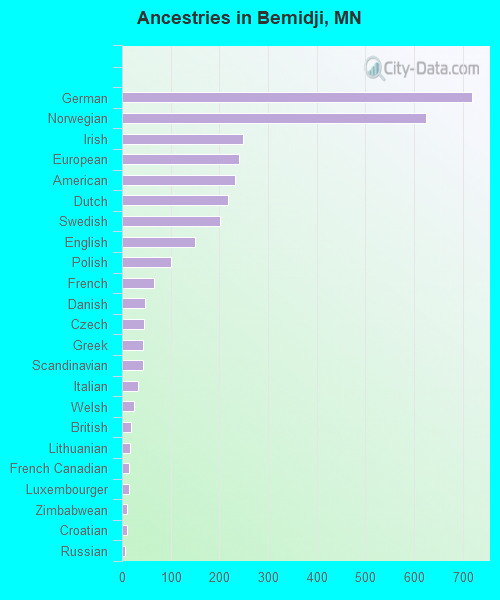
718 14.5% German624 12.6% Norwegian248 5.0% Irish240 4.9% European233 4.7% American217 4.4% Dutch201 4.1% Swedish150 3.0% English101 2.0% Polish65 1.3% French48 1.0% Danish45 0.9% Czech44 0.9% Greek44 0.9% Scandinavian33 0.7% Italian25 0.5% Welsh19 0.4% British16 0.3% Lithuanian14 0.3% French Canadian14 0.3% Luxembourger11 0.2% Zimbabwean10 0.2% Croatian7 0.1% Russian4 0.08% Canadian4 0.08% Yugoslavian
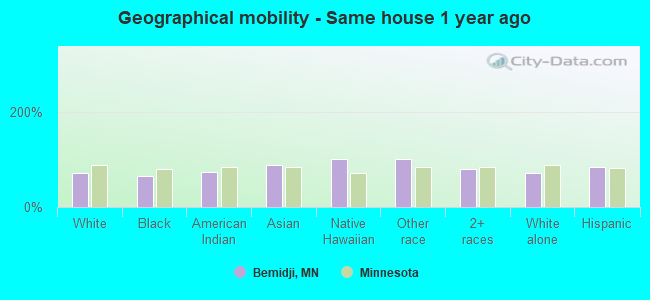
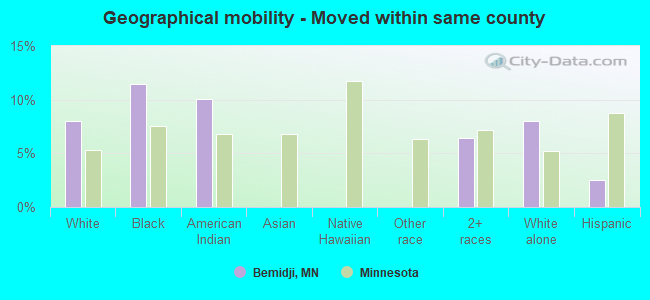
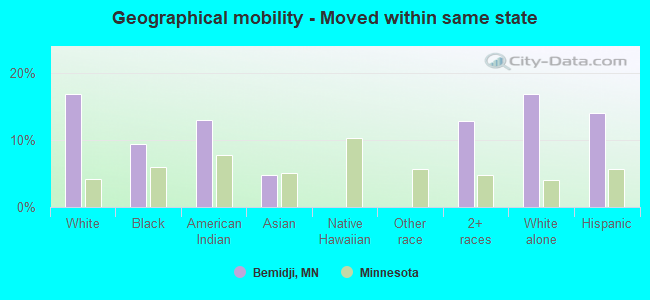
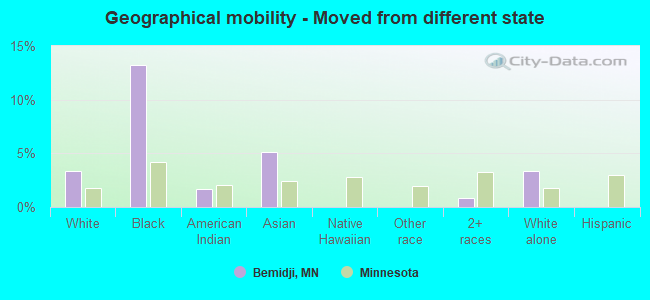
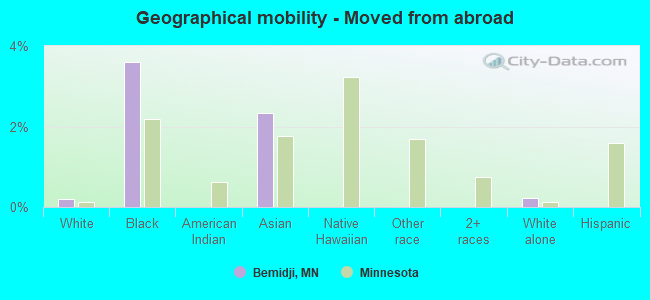
Geographical mobility in Bemidji Same house 1 year ago 8,079 71.1% White (Caucasian)280 64.1% Black or African American1,222 74.3% American Indian / Alaska Native171 89.1% Asian25 100.0% Native Hawaiian / Pacific Islander67 100.0% Other race1,279 78.6% Two or more races8,112 71.0% White alone, not Hispanic / Latino355 83.3% Hispanic or LatinoMoved within same county 914 8.0% White / Caucasian50 11.4% Black or African American165 10.0% American Indian / Alaska Native104 6.4% Two or more races920 8.1% White alone, not Hispanic / Latino11 2.5% Hispanic or LatinoMoved within same state 1,906 16.8% White / Caucasian41 9.4% Black or African American214 13.0% American Indian / Alaska Native9 4.7% Asian210 12.9% Two or more races1,919 16.8% White alone, not Hispanic / Latino60 14.1% Hispanic or LatinoMoved from different state 379 3.3% White / Caucasian58 13.2% Black or African American27 1.6% American Indian / Alaska Native10 5.1% Asian13 0.8% Two or more races386 3.4% White alone, not Hispanic / LatinoMoved from abroad 23 0.2% White16 3.6% Black or African American4 2.3% Asian25 0.2% White alone, not Hispanic / Latino
Children Nativity (place of birth) in Bemidji
Children under 6 years - Living with two parents Both parents native 480 100.0% NativeOne native, one foreign-born parent 110 100.0% NativeChildren under 6 years - Living with one parent Native parent 442 100.0% NativeChildren 6 to 17 years - Living with two parents Both parents native 756 100.0% NativeBoth parents foreign-born 22 100.0% NativeOne native, one foreign-born parent 78 100.0% NativeChildren 6 to 17 years - Living with one parent Native parent 795 100.0% NativeForeign-born parent 67 50.4% Native66 49.6% Foreign-born
Grandparents responsible for own grandchildren in Bemidji
Grandparents (30 to 59 years) White / Caucasian 25 100.0% Not responsible for grandchildrenTwo or more races 3 100.0% Responsible for grandchildrenWhite alone, not Hispanic / Latino 26 100.0% Not responsible for grandchildren
Grandparents (60 years and over) White / Caucasian 13 100.0% Responsible for grandchildrenWhite alone, not Hispanic / Latino 13 100.0% Responsible for grandchildren