Races in Bendersville Station-Aspers, Pennsylvania (PA) Detailed Stats
Ancestries, Foreign-born residents, place of birth

Discuss Bendersville Station-Aspers, Pennsylvania races on our local forum with over 2,400,000 registered users
14.8% of Bendersville Station-Aspers, PA residents are foreign-born (14.8% born in Latin America), which is 52.8% greater than the foreign-born rate of 7.0% across the entire state of Pennsylvania.
Race distribution in Bendersville Station-Aspers

- 23071.0%White alone
- 7723.8%Hispanic
- 144.3%Black alone
- 30.9%Other race alone
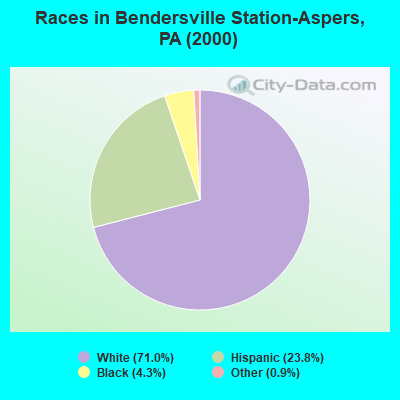
2000
2022
-
- 10,322,45584.1%White alone
- 1,202,4379.8%Black alone
- 394,0883.2%Hispanic
- 218,2961.8%Asian alone
- 113,0970.9%Two or more races
- 13,0860.1%Other race alone
- 14,9040.1%American Indian alone
- 2,6910.02%Native Hawaiian and Other
Pacific Islander alone

-
- 9,487,22873.1%White alone
- 1,311,58110.1%Black alone
- 1,115,9978.6%Hispanic
- 493,9423.8%Two or more races
- 487,1243.8%Asian alone
- 63,5820.5%Other race alone
- 10,1300.08%American Indian alone
- 2,4240.02%Native Hawaiian and Other
Pacific Islander alone

Income and house value in Bendersville Station-Aspers
- Median household income in 2022
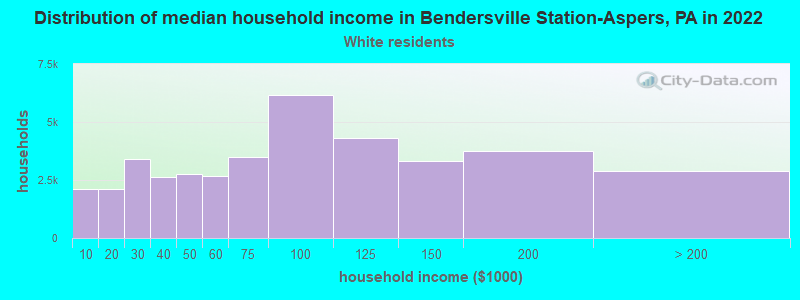
- $80,577White non-Hispanic householders
- $115,108Some other race householders
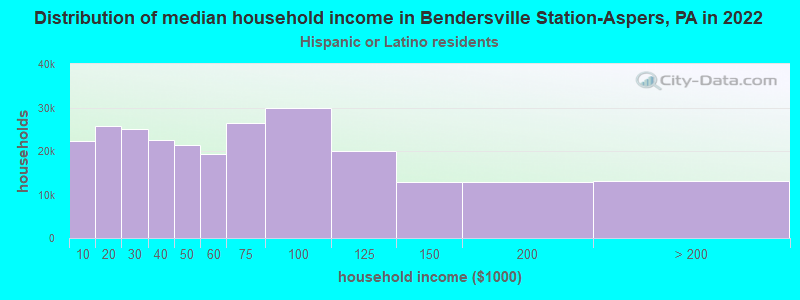
- $91,168Hispanic or Latino race householders
- Median 2022 house value
- $195,138White Non-Hispanic householders
- $222,013Some other race householders
Household income for White non-Hispanic householders
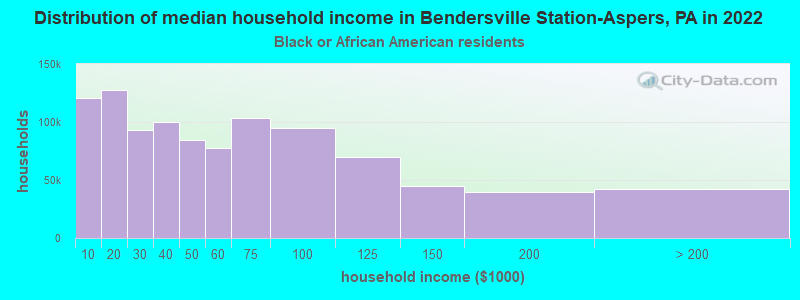
Household income for Black householders
Household income for Hispanic or Latino race householders
Foreign-born residents in Bendersville Station-Aspers
48 residents are foreign born (14.8% Latin America).
| This city: | 14.8% |
| Pennsylvania: | 4.1% |
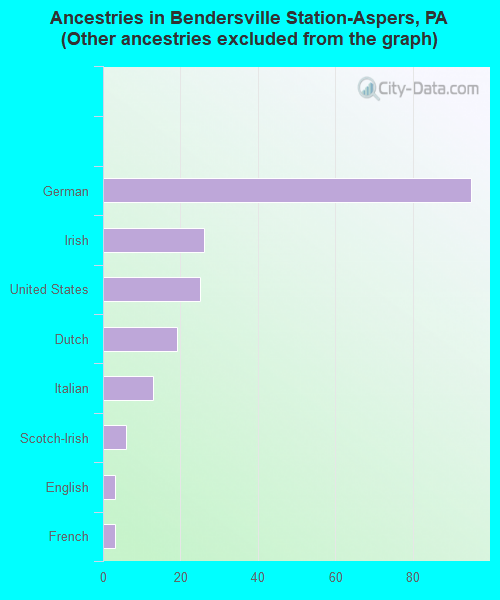
Ancestries in Bendersville Station-Aspers

- 10335.2%Other
- 9532.4%German
- 268.9%Irish
- 258.5%United States
- 196.5%Dutch
- 134.4%Italian
- 62.0%Scotch-Irish
- 31.0%English
- 31.0%French
Zip codes: 17304.