Races in Berkley, Michigan (MI) Detailed Stats
Data:
Races - White alone (%)
Races - White alone (% change since 2000)
Races - Black alone (%)
Races - Black alone (% change since 2000)
Races - American Indian alone (%)
Races - American Indian alone (% change since 2000)
Races - Asian alone (%)
Races - Asian alone (% change since 2000)
Races - Hispanic (%)
Races - Hispanic (% change since 2000)
Races - Native Hawaiian and Other Pacific Islander alone (%)
Races - Native Hawaiian and Other Pacific Islander alone (% change since 2000)
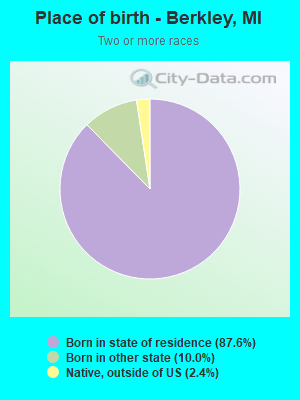
Races - Two or more races(%)
Races - Two or more races(% change since 2000)
Races - Other race alone (%)
Races - Other race alone (% change since 2000)
Racial diversity
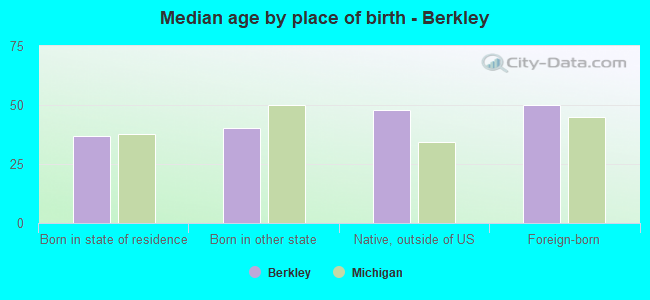
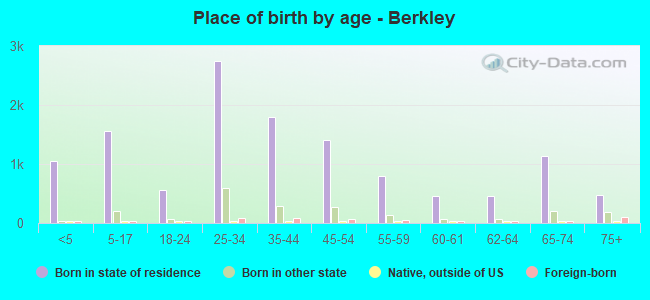
Place of birth - Born in state of residence (%)
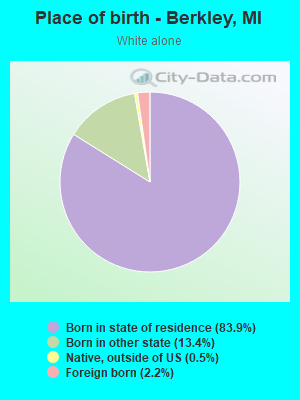
Place of birth - Born in state of residence (%) - White
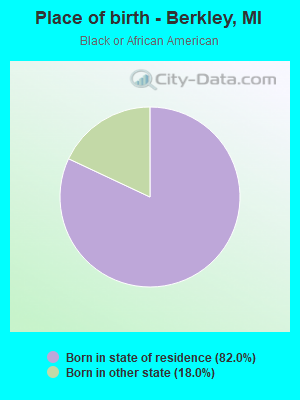
Place of birth - Born in state of residence (%) - Black or African American
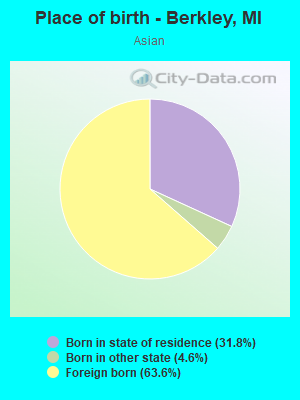
Place of birth - Born in state of residence (%) - Asian
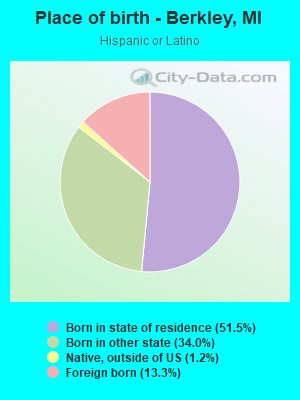
Place of birth - Born in state of residence (%) - Hispanic or Latino
Place of birth - Born in state of residence (%) - American Indian and Alaska Native
Place of birth - Born in state of residence (%) - Multirace
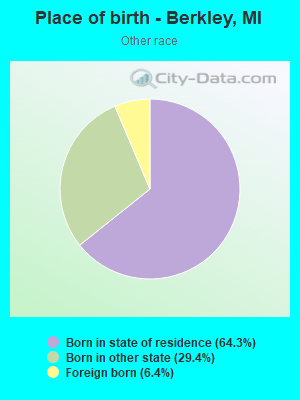
Place of birth - Born in state of residence (%) - Other Race
Place of birth - Born in other state (%)
Place of birth - Born in other state (%) - White
Place of birth - Born in other state (%) - Black or African American
Place of birth - Born in other state (%) - Asian
Place of birth - Born in other state (%) - Hispanic or Latino
Place of birth - Born in other state (%) - American Indian and Alaska Native
Place of birth - Born in other state (%) - Multirace
Place of birth - Born in other state (%) - Other Race
Place of birth - Native, outside of US (%)
Place of birth - Native, outside of US (%) - White
Place of birth - Native, outside of US (%) - Black or African American
Place of birth - Native, outside of US (%) - Asian
Place of birth - Native, outside of US (%) - Hispanic or Latino
Place of birth - Native, outside of US (%) - American Indian and Alaska Native
Place of birth - Native, outside of US (%) - Multirace
Place of birth - Native, outside of US (%) - Other Race
Place of birth - Foreign born (%)
Place of birth - Foreign born (%) - White
Place of birth - Foreign born (%) - Black or African American
Place of birth - Foreign born (%) - Asian
Place of birth - Foreign born (%) - Hispanic or Latino
Place of birth - Foreign born (%) - American Indian and Alaska Native
Place of birth - Foreign born (%) - Multirace
Place of birth - Foreign born (%) - Other Race
Residents speaking English at home (%)
Residents speaking English at home - Born in the United States (%)
Residents speaking English at home - Native, born elsewhere (%)
Residents speaking English at home - Foreign born (%)
Residents speaking Spanish at home (%)
Residents speaking Spanish at home - Born in the United States (%)
Residents speaking Spanish at home - Native, born elsewhere (%)
Residents speaking Spanish at home - Foreign born (%)
Residents speaking other language at home (%)
Residents speaking other language at home - Born in the United States (%)
Residents speaking other language at home - Native, born elsewhere (%)
Residents speaking other language at home - Foreign born (%)
Marital status - Never married (%)
Marital status - Now married (%)
Marital status - Separated (%)
Marital status - Widowed (%)
Marital status - Divorced (%)
Ancestries Reported - Arab (%)
Ancestries Reported - Czech (%)
Ancestries Reported - Danish (%)
Ancestries Reported - Dutch (%)
Ancestries Reported - English (%)
Ancestries Reported - French (%)
Ancestries Reported - French Canadian (%)
Ancestries Reported - German (%)
Ancestries Reported - Greek (%)
Ancestries Reported - Hungarian (%)
Ancestries Reported - Irish (%)
Ancestries Reported - Italian (%)
Ancestries Reported - Lithuanian (%)
Ancestries Reported - Norwegian (%)
Ancestries Reported - Polish (%)
Ancestries Reported - Portuguese (%)
Ancestries Reported - Russian (%)
Ancestries Reported - Scotch-Irish (%)
Ancestries Reported - Scottish (%)
Ancestries Reported - Slovak (%)
Ancestries Reported - Subsaharan African (%)
Ancestries Reported - Swedish (%)
Ancestries Reported - Swiss (%)
Ancestries Reported - Ukrainian (%)
Ancestries Reported - United States (%)
Ancestries Reported - Welsh (%)
Ancestries Reported - West Indian (%)
Ancestries Reported - Other (%)
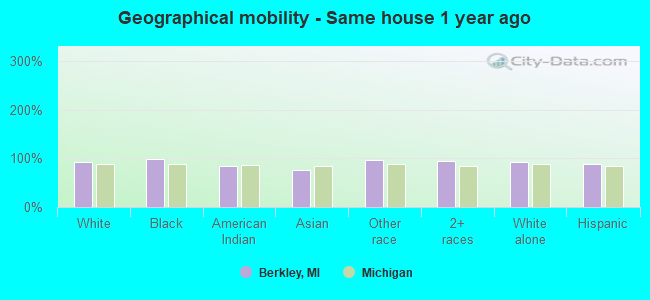
Geographical mobility - Same house 1 year ago (%)
Geographical mobility - Same house 1 year ago (%) - White
Geographical mobility - Same house 1 year ago (%) - Black or African American
Geographical mobility - Same house 1 year ago (%) - Asian
Geographical mobility - Same house 1 year ago (%) - Hispanic or Latino
Geographical mobility - Same house 1 year ago (%) - American Indian and Alaska Native
Geographical mobility - Same house 1 year ago (%) - Multirace
Geographical mobility - Same house 1 year ago (%) - Other Race
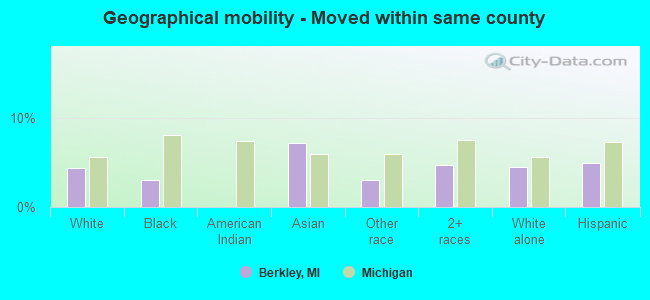
Geographical mobility - Moved within same county (%)
Geographical mobility - Moved within same county (%) - White
Geographical mobility - Moved within same county (%) - Black or African American
Geographical mobility - Moved within same county (%) - Asian
Geographical mobility - Moved within same county (%) - Hispanic or Latino
Geographical mobility - Moved within same county (%) - American Indian and Alaska Native
Geographical mobility - Moved within same county (%) - Multirace
Geographical mobility - Moved within same county (%) - Other Race
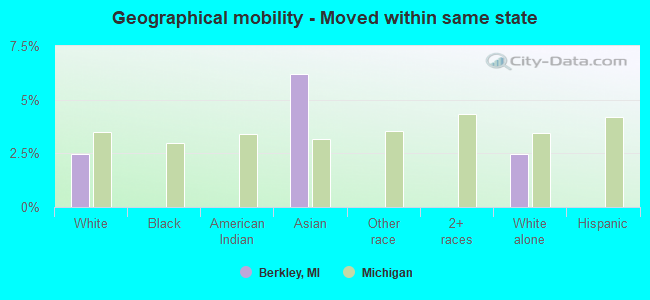
Geographical mobility - Moved from different county within same state (%)
Geographical mobility - Moved from different county within same state (%) - White
Geographical mobility - Moved from different county within same state (%) - Black or African American
Geographical mobility - Moved from different county within same state (%) - Asian
Geographical mobility - Moved from different county within same state (%) - Hispanic or Latino
Geographical mobility - Moved from different county within same state (%) - American Indian and Alaska Native
Geographical mobility - Moved from different county within same state (%) - Multirace
Geographical mobility - Moved from different county within same state (%) - Other Race
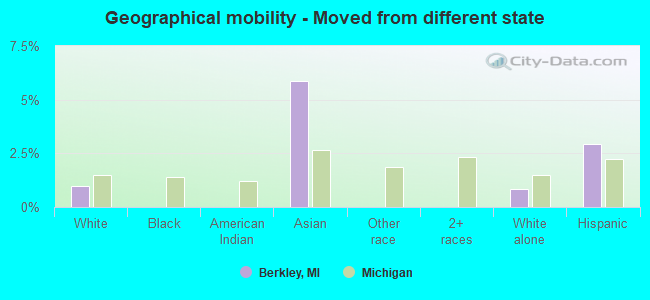
Geographical mobility - Moved from different state (%)
Geographical mobility - Moved from different state (%) - White
Geographical mobility - Moved from different state (%) - Black or African American
Geographical mobility - Moved from different state (%) - Asian
Geographical mobility - Moved from different state (%) - Hispanic or Latino
Geographical mobility - Moved from different state (%) - American Indian and Alaska Native
Geographical mobility - Moved from different state (%) - Multirace
Geographical mobility - Moved from different state (%) - Other Race
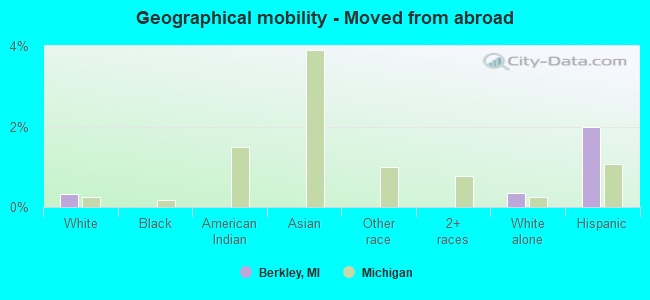
Geographical mobility - Moved from abroad (%)
Geographical mobility - Moved from abroad (%) - White
Geographical mobility - Moved from abroad (%) - Black or African American
Geographical mobility - Moved from abroad (%) - Asian
Geographical mobility - Moved from abroad (%) - Hispanic or Latino
Geographical mobility - Moved from abroad (%) - American Indian and Alaska Native
Geographical mobility - Moved from abroad (%) - Multirace
Geographical mobility - Moved from abroad (%) - Other Race
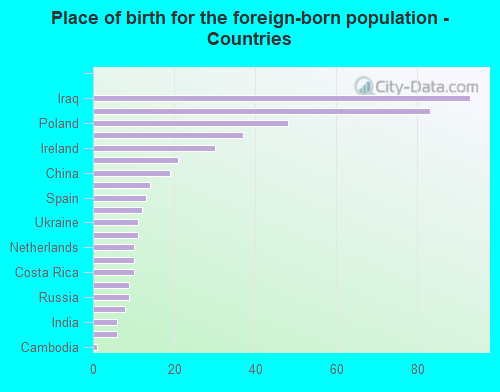
Place of birth for the foreign-born population - Ireland (%)
Place of birth for the foreign-born population - Denmark (%)
Place of birth for the foreign-born population - Norway (%)
Place of birth for the foreign-born population - Sweden (%)
Place of birth for the foreign-born population - United Kingdom (%)
Place of birth for the foreign-born population - England (%)
Place of birth for the foreign-born population - Scotland (%)
Place of birth for the foreign-born population - Other Northern Europe (%)
Place of birth for the foreign-born population - Austria (%)
Place of birth for the foreign-born population - Belgium (%)
Place of birth for the foreign-born population - France (%)
Place of birth for the foreign-born population - Germany (%)
Place of birth for the foreign-born population - Netherlands (%)
Place of birth for the foreign-born population - Switzerland (%)
Place of birth for the foreign-born population - Other Western Europe (%)
Place of birth for the foreign-born population - Greece (%)
Place of birth for the foreign-born population - Italy (%)
Place of birth for the foreign-born population - Portugal (%)
Place of birth for the foreign-born population - Spain (%)
Place of birth for the foreign-born population - Other Southern Europe (%)
Place of birth for the foreign-born population - Albania (%)
Place of birth for the foreign-born population - Belarus (%)
Place of birth for the foreign-born population - Bosnia and Herzegovina (%)
Place of birth for the foreign-born population - Bulgaria (%)
Place of birth for the foreign-born population - Croatia (%)
Place of birth for the foreign-born population - Czechoslovakia (%)
Place of birth for the foreign-born population - Hungary (%)
Place of birth for the foreign-born population - Latvia (%)
Place of birth for the foreign-born population - Lithuania (%)
Place of birth for the foreign-born population - North Macedonia (Macedonia) (%)
Place of birth for the foreign-born population - Moldova (%)
Place of birth for the foreign-born population - Poland (%)
Place of birth for the foreign-born population - Romania (%)
Place of birth for the foreign-born population - Russia (%)
Place of birth for the foreign-born population - Serbia (%)
Place of birth for the foreign-born population - Ukraine (%)
Place of birth for the foreign-born population - Other Eastern Europe (%)
Place of birth for the foreign-born population - China (%)
Place of birth for the foreign-born population - Hong Kong (%)
Place of birth for the foreign-born population - Taiwan (%)
Place of birth for the foreign-born population - Japan (%)
Place of birth for the foreign-born population - Korea (%)
Place of birth for the foreign-born population - Other Eastern Asia (%)
Place of birth for the foreign-born population - Afghanistan (%)
Place of birth for the foreign-born population - Bangladesh (%)
Place of birth for the foreign-born population - India (%)
Place of birth for the foreign-born population - Iran (%)
Place of birth for the foreign-born population - Kazakhstan (%)
Place of birth for the foreign-born population - Nepal (%)
Place of birth for the foreign-born population - Pakistan (%)
Place of birth for the foreign-born population - Sri Lanka (%)
Place of birth for the foreign-born population - Uzbekistan (%)
Place of birth for the foreign-born population - Other South Central Asia (%)
Place of birth for the foreign-born population - Burma (%)
Place of birth for the foreign-born population - Cambodia (%)
Place of birth for the foreign-born population - Indonesia (%)
Place of birth for the foreign-born population - Laos (%)
Place of birth for the foreign-born population - Malaysia (%)
Place of birth for the foreign-born population - Philippines (%)
Place of birth for the foreign-born population - Singapore (%)
Place of birth for the foreign-born population - Thailand (%)
Place of birth for the foreign-born population - Vietnam (%)
Place of birth for the foreign-born population - Other South Eastern Asia (%)
Place of birth for the foreign-born population - Armenia (%)
Place of birth for the foreign-born population - Iraq (%)
Place of birth for the foreign-born population - Israel (%)
Place of birth for the foreign-born population - Jordan (%)
Place of birth for the foreign-born population - Kuwait (%)
Place of birth for the foreign-born population - Lebanon (%)
Place of birth for the foreign-born population - Saudi Arabia (%)
Place of birth for the foreign-born population - Syria (%)
Place of birth for the foreign-born population - Turkey (%)
Place of birth for the foreign-born population - Yemen (%)
Place of birth for the foreign-born population - Other Western Asia (%)
Place of birth for the foreign-born population - Eritrea (%)
Place of birth for the foreign-born population - Ethiopia (%)
Place of birth for the foreign-born population - Kenya (%)
Place of birth for the foreign-born population - Somalia (%)
Place of birth for the foreign-born population - Uganda (%)
Place of birth for the foreign-born population - Zimbabwe (%)
Place of birth for the foreign-born population - Other Eastern Africa (%)
Place of birth for the foreign-born population - Cameroon (%)
Place of birth for the foreign-born population - Congo (%)
Place of birth for the foreign-born population - Democratic Republic of Congo (Zaire) (%)
Place of birth for the foreign-born population - Other Middle Africa (%)
Place of birth for the foreign-born population - Egypt (%)
Place of birth for the foreign-born population - Morocco (%)
Place of birth for the foreign-born population - Sudan (%)
Place of birth for the foreign-born population - Other Northern Africa (%)
Place of birth for the foreign-born population - South Africa (%)
Place of birth for the foreign-born population - Other Southern Africa (%)
Place of birth for the foreign-born population - Cabo Verde (%)
Place of birth for the foreign-born population - Ghana (%)
Place of birth for the foreign-born population - Liberia (%)
Place of birth for the foreign-born population - Nigeria (%)
Place of birth for the foreign-born population - Senegal (%)
Place of birth for the foreign-born population - Sierra Leone (%)
Place of birth for the foreign-born population - Other Western Africa (%)
Place of birth for the foreign-born population - Australia (%)
Place of birth for the foreign-born population - New Zealand (%)
Place of birth for the foreign-born population - Fiji (%)
Place of birth for the foreign-born population - Micronesia (%)
Place of birth for the foreign-born population - Bahamas (%)
Place of birth for the foreign-born population - Barbados (%)
Place of birth for the foreign-born population - Cuba (%)
Place of birth for the foreign-born population - Dominica (%)
Place of birth for the foreign-born population - Dominican Republic (%)
Place of birth for the foreign-born population - Grenada (%)
Place of birth for the foreign-born population - Haiti (%)
Place of birth for the foreign-born population - Jamaica (%)
Place of birth for the foreign-born population - St. Vincent and the Grenadines (%)
Place of birth for the foreign-born population - Trinidad and Tobago (%)
Place of birth for the foreign-born population - West Indies (%)
Place of birth for the foreign-born population - Other Caribbean (%)
Place of birth for the foreign-born population - Belize (%)
Place of birth for the foreign-born population - Costa Rica (%)
Place of birth for the foreign-born population - El Salvador (%)
Place of birth for the foreign-born population - Guatemala (%)
Place of birth for the foreign-born population - Honduras (%)
Place of birth for the foreign-born population - Mexico (%)
Place of birth for the foreign-born population - Nicaragua (%)
Place of birth for the foreign-born population - Panama (%)
Place of birth for the foreign-born population - Other Central America (%)
Place of birth for the foreign-born population - Argentina (%)
Place of birth for the foreign-born population - Bolivia (%)
Place of birth for the foreign-born population - Brazil (%)
Place of birth for the foreign-born population - Chile (%)
Place of birth for the foreign-born population - Colombia (%)
Place of birth for the foreign-born population - Ecuador (%)
Place of birth for the foreign-born population - Guyana (%)
Place of birth for the foreign-born population - Peru (%)
Place of birth for the foreign-born population - Uruguay (%)
Place of birth for the foreign-born population - Venezuela (%)
Place of birth for the foreign-born population - Other South America (%)
Place of birth for the foreign-born population - Canada (%)
Place of birth for the foreign-born population - Other Northern America (%)
Place of birth for the foreign-born population - Other (%)
Latest news about races in Berkley, MI collected exclusively by city-data.com from local newspapers, TV, and radio stations
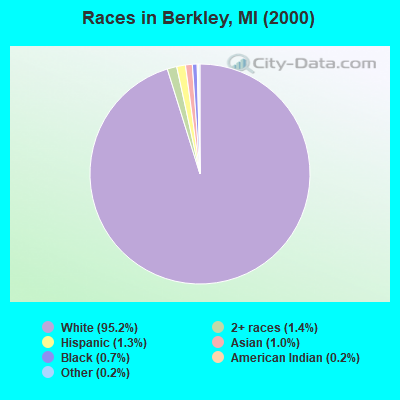
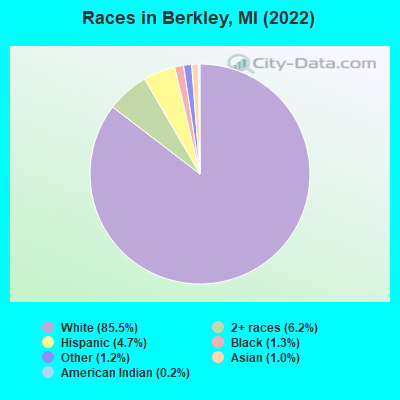
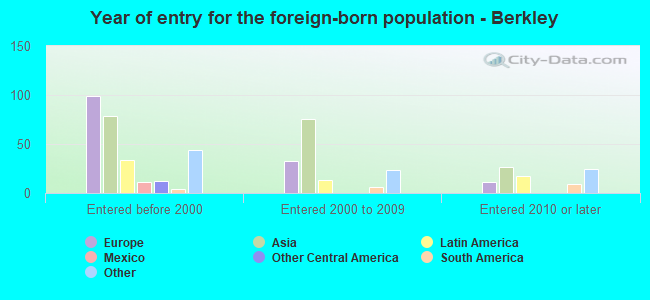
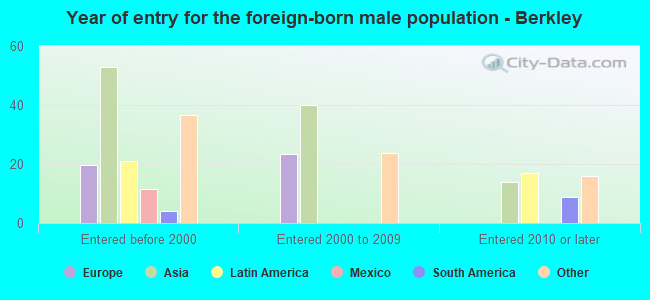
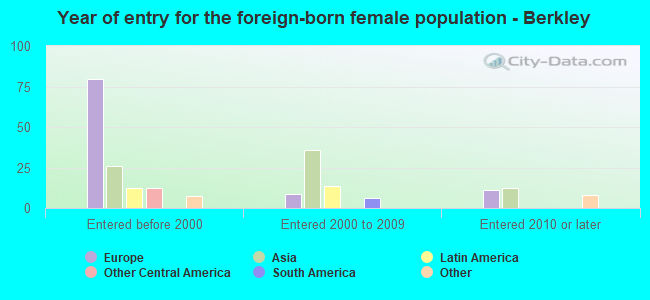
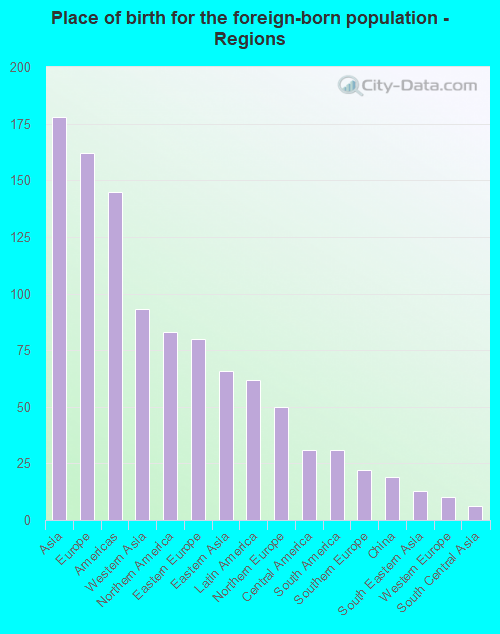
According to 2022 data, the most numerous races in Berkley, MI are White alone (12,919 residents), Black alone (199 residents), and Hispanic (707 residents). 95.2% of Berkley residents speak English at home. 3.2% of Berkley, MI residents are foreign-born (1.2% born in Asia, 1.1% born in Europe, 0.5% born in North America, 0.4% born in Latin America), which is 87.0% less than the foreign-born rate of 6.0% across the entire state of Michigan.
Race distribution in Berkley
2000 2022
7,806,691 78.6% White alone 1,402,047 14.1% Black alone 323,877 3.3% Hispanic 175,311 1.8% Asian alone 163,487 1.6% Two or more races 53,421 0.5% American Indian alone 11,465 0.1% Other race alone 2,145 0.02% Native Hawaiian and Other
7,289,051 72.6% White alone 1,310,464 13.1% Black alone 572,405 5.7% Hispanic 450,031 4.5% Two or more races 335,732 3.3% Asian alone 45,217 0.5% Other race alone 29,011 0.3% American Indian alone 2,207 0.02% Native Hawaiian and Other
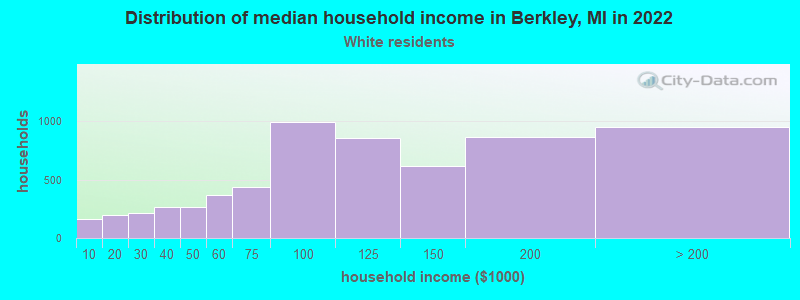
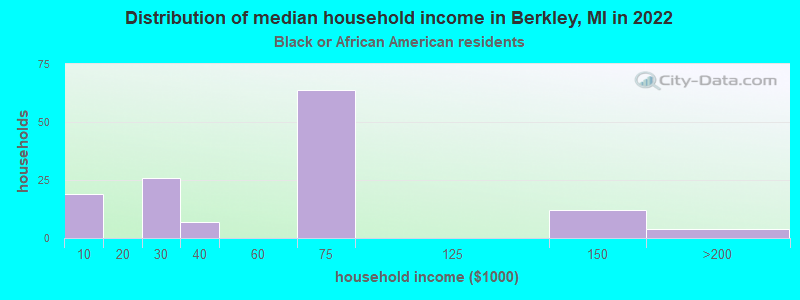
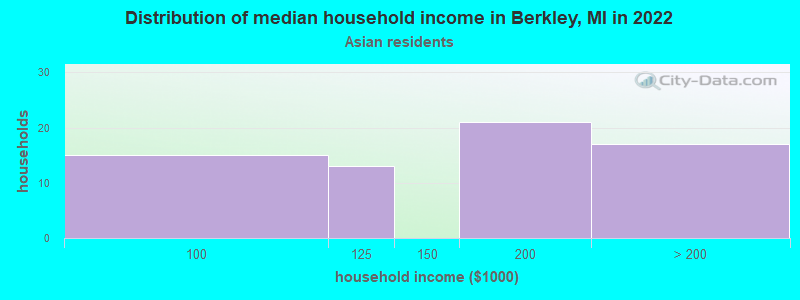
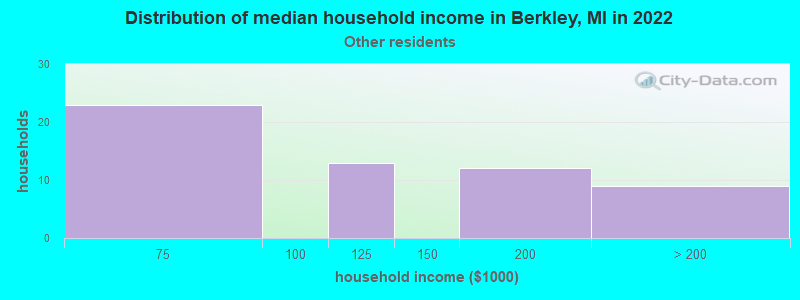
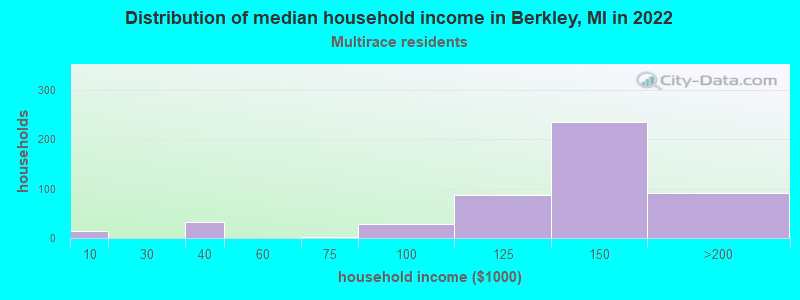
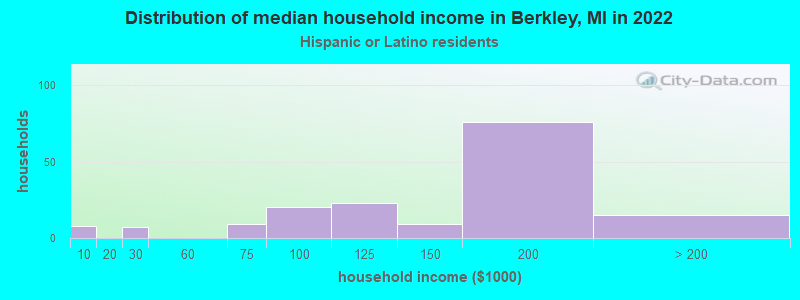
Income and house value in Berkley Median household income in 2022 $102,103 White non-Hispanic householders$64,180 Black householders$192,157 Asian householdersover $200,000 Some other race householders$122,340 Two or more races householders$161,283 Hispanic or Latino race householdersMedian 2022 house value $300,752 White Non-Hispanic householders$293,912 Black or African American householders$347,350 American Indian or Alaska Native householders $238,122 Asian householders$238,977 Some other race householders$343,289 Two or more races householders$319,348 Hispanic or Latino householders
Median age by race in Berkley
39.9 Median age for White residents38.5 42.0 50.4 Median age for Black or African American residents52.6 46.5 30.6 Median age for American Indian / Alaska Native residents-505,050,504.5 -728,395,061.0 43.2 Median age for Asian residents38.4 44.6 -670,531,400.3 Median age for Native Hawaiian / Pacific Islander residents-674,772,035.8 -699,588,476.7 24.3 Median age for Other race residents33.8 11.7 26.7 Median age for Two or more races residents23.0 29.6 39.9 Median age for White alone residents38.4 41.6 26.5 Median age for Hispanic or Latino residents12.3 27.2
Owner/renter occupied households by race in Berkley
House owners and renters - White residents 5,404 86.6% Owner occupied837 13.4% Renter occupiedHouse owners and renters - Black or African American residents 11 9.2% Owner occupied107 90.8% Renter occupiedHouse owners and renters - American Indian / Alaska Native residents 12 100.0% Renter occupiedHouse owners and renters - Asian residents 67 92.8% Owner occupied5 7.2% Renter occupiedHouse owners and renters - Other race residents 48 78.7% Owner occupied13 21.3% Renter occupiedHouse owners and renters - Two or more races residents 488 94.3% Owner occupied29 5.7% Renter occupiedHouse owners and renters - White alone residents 5,365 86.5% Owner occupied837 13.5% Renter occupiedHouse owners and renters - Hispanic or Latino residents 114 75.1% Owner occupied38 24.9% Renter occupied
Language usage in Berkley
English speakers - Total 95.2% of residents of Berkley speak English at home.
1.3% of residents speak Spanish at home 180 100.0% Speak English very well3.3% of residents speak other language at home 329 70.8% Speak English very well136 29.2% Speak English less than very well
English speakers - Born in the United States 96.6% of residents of Berkley speak English at home.
1.5% of residents speak Spanish at home 30 100.0% Speak English very well1.8% of residents speak other language at home 36 100.0% Speak English very well
All residents speak only English at home
English speakers - Foreign-born 38.7% of residents of Berkley speak English at home.
11.9% of residents speak Spanish at home 58 100.0% Speak English very well49.3% of residents speak other language at home 113 46.9% Speak English very well128 53.1% Speak English less than very well
White (Caucasian) - Speak only English Native:
98.0% (11,662)Foreign-born:
37.0% (120)
White (Caucasian) - Speak another language Native:
2.1% (252)Foreign-born:
63.7% (206)
Asian - Speak only English Native:
81.0% (40)Foreign-born:
65.2% (64)
Asian - Speak another language Native:
20.6% (10)Foreign-born:
37.0% (36)
Other race - Speak only English Native:
84.9% (299)Foreign-born:
14.7% (3)
Other race - Speak another language Native:
9.2% (32)Foreign-born:
71.3% (17)
White alone - Speak only English Native:
97.7% (11,622)Foreign-born:
42.4% (121)
White alone - Speak another language Native:
2.2% (261)Foreign-born:
58.3% (167)
Hispanic or Latino - Speak only English Native:
84.3% (375)Foreign-born:
5.9% (6)
Hispanic or Latino - Speak another language Native:
13.1% (58)Foreign-born:
94.2% (90)
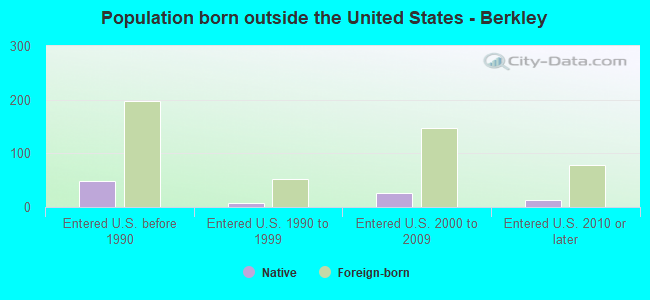
Foreign-born residents in Berkley 485 residents are foreign born (1.2% Asia , 1.1% Europe , 0.5% North America , 0.4% Latin America ).
This city:
3.2%Michigan:
6.9%
Marital status for residents in Berkley Marital status - White (Caucasian) population 15 years and over
Males 33.0% Never married55.5% Now married0.7% Separated1.0% Widowed9.7% DivorcedFemales 29.9% Never married49.4% Now married0.0% Separated6.9% Widowed13.8% DivorcedWomen who gave birth in the past 12 months Now married:
89.0% (154)Unmarried:
11.0% (19)
Women who did not give birth in the past 12 months Now married:
49.9% (1,529)Unmarried:
50.1% (1,533)
Marital status - Black or African American population 15 years and over
Males 32.4% Never married14.4% Now married0.0% Separated0.0% Widowed53.2% DivorcedFemales 64.9% Never married0.0% Now married0.0% Separated17.5% Widowed17.5% DivorcedWomen who did not give birth in the past 12 months Now married:
0.0% (0)Unmarried:
100.0% (33)
Marital status - American Indian / Alaska Native population 15 years and over
Males 100.0% Never married0.0% Now married0.0% Separated0.0% Widowed0.0% DivorcedFemales 0.0% Never married100.0% Now married0.0% Separated0.0% Widowed0.0% DivorcedMarital status - Asian population 15 years and over
Males 20.9% Never married61.2% Now married0.0% Separated17.9% Widowed0.0% DivorcedFemales 41.8% Never married58.2% Now married0.0% Separated0.0% Widowed0.0% DivorcedWomen who gave birth in the past 12 months Now married:
100.0% (5)Unmarried:
0.0% (0)
Women who did not give birth in the past 12 months Now married:
46.2% (24)Unmarried:
53.8% (28)
Marital status - Other race population 15 years and over
Males 27.1% Never married72.9% Now married0.0% Separated0.0% Widowed0.0% DivorcedFemales 17.0% Never married10.6% Now married0.0% Separated0.0% Widowed72.3% DivorcedWomen who gave birth in the past 12 months Now married:
0.0% (0)Unmarried:
100.0% (83)
Women who did not give birth in the past 12 months Now married:
27.0% (15)Unmarried:
73.0% (40)
Marital status - Two or more races population 15 years and over
Males 48.9% Never married26.2% Now married3.3% Separated3.6% Widowed18.0% DivorcedFemales 70.8% Never married29.2% Now married0.0% Separated0.0% Widowed0.0% DivorcedWomen who gave birth in the past 12 months Now married:
100.0% (8)Unmarried:
0.0% (0)
Women who did not give birth in the past 12 months Now married:
23.0% (99)Unmarried:
77.0% (332)
Marital status - White alone, not Hispanic / Latino population 15 years and over
Males 33.1% Never married55.3% Now married0.7% Separated1.0% Widowed9.8% DivorcedFemales 30.2% Never married49.5% Now married0.0% Separated6.7% Widowed13.6% DivorcedWomen who gave birth in the past 12 months Now married:
89.0% (157)Unmarried:
11.0% (19)
Women who did not give birth in the past 12 months Now married:
49.8% (1,504)Unmarried:
50.2% (1,517)
Marital status - Hispanic or Latino population 15 years and over
Males 31.0% Never married56.8% Now married0.0% Separated0.0% Widowed12.3% DivorcedFemales 16.3% Never married34.7% Now married0.0% Separated9.2% Widowed39.7% DivorcedWomen who gave birth in the past 12 months Now married:
0.0% (0)Unmarried:
100.0% (62)
Women who did not give birth in the past 12 months Now married:
47.3% (75)Unmarried:
52.7% (84)
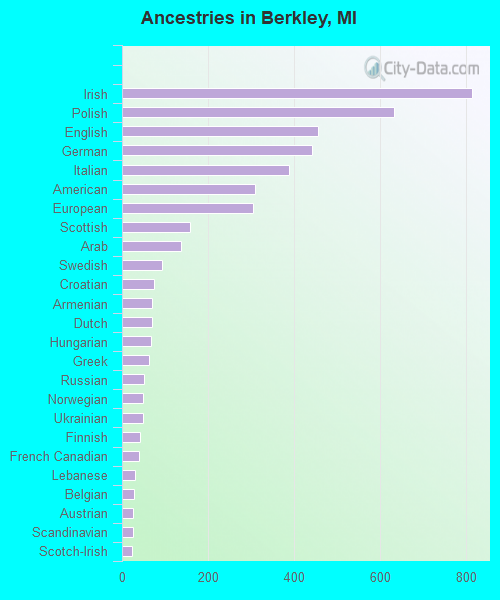
Ancestries in Berkley
814 14.3% Irish633 11.1% Polish457 8.0% English442 7.8% German388 6.8% Italian310 5.4% American306 5.4% European159 2.8% Scottish137 2.4% Arab93 1.6% Swedish74 1.3% Croatian71 1.2% Armenian71 1.2% Dutch68 1.2% Hungarian63 1.1% Greek51 0.9% Russian48 0.8% Norwegian48 0.8% Ukrainian42 0.7% Finnish40 0.7% French Canadian31 0.5% Lebanese28 0.5% Belgian26 0.5% Austrian25 0.4% Scandinavian24 0.4% Scotch-Irish22 0.4% Eastern European20 0.4% British20 0.4% Canadian18 0.3% Czechoslovakian15 0.3% African11 0.2% Egyptian11 0.2% Israeli11 0.2% Slovak9 0.2% French8 0.1% Lithuanian7 0.1% Maltese5 0.09% Romanian4 0.07% Northern European
Children Nativity (place of birth) in Berkley
Children under 6 years - Living with two parents Both parents native 1,003 100.0% NativeOne native, one foreign-born parent 69 100.0% NativeChildren under 6 years - Living with one parent Native parent 161 100.0% NativeChildren 6 to 17 years - Living with two parents Both parents native 1,037 100.0% NativeBoth parents foreign-born 30 100.0% Foreign-bornOne native, one foreign-born parent 63 100.0% NativeChildren 6 to 17 years - Living with one parent Native parent 379 100.0% NativeForeign-born parent 17 61.1% Native11 38.9% Foreign-born
Grandparents responsible for own grandchildren in Berkley
Grandparents (30 to 59 years) White / Caucasian 54 100.0% Not responsible for grandchildrenWhite alone, not Hispanic / Latino 55 100.0% Not responsible for grandchildrenGrandparents (60 years and over) White / Caucasian 21 31.5% Responsible for grandchildren45 68.5% Not responsible for grandchildrenWhite alone, not Hispanic / Latino 22 32.1% Responsible for grandchildren46 67.9% Not responsible for grandchildren