Races in Bernalillo, New Mexico (NM) Detailed Stats
Data:
Races - White alone (%)
Races - White alone (% change since 2000)
Races - Black alone (%)
Races - Black alone (% change since 2000)
Races - American Indian alone (%)
Races - American Indian alone (% change since 2000)
Races - Asian alone (%)
Races - Asian alone (% change since 2000)
Races - Hispanic (%)
Races - Hispanic (% change since 2000)
Races - Native Hawaiian and Other Pacific Islander alone (%)
Races - Native Hawaiian and Other Pacific Islander alone (% change since 2000)
Races - Two or more races(%)
Races - Two or more races(% change since 2000)
Races - Other race alone (%)
Races - Other race alone (% change since 2000)
Racial diversity
Place of birth - Born in state of residence (%)
Place of birth - Born in state of residence (%) - White
Place of birth - Born in state of residence (%) - Black or African American
Place of birth - Born in state of residence (%) - Asian
Place of birth - Born in state of residence (%) - Hispanic or Latino
Place of birth - Born in state of residence (%) - American Indian and Alaska Native
Place of birth - Born in state of residence (%) - Multirace
Place of birth - Born in state of residence (%) - Other Race
Place of birth - Born in other state (%)
Place of birth - Born in other state (%) - White
Place of birth - Born in other state (%) - Black or African American
Place of birth - Born in other state (%) - Asian
Place of birth - Born in other state (%) - Hispanic or Latino
Place of birth - Born in other state (%) - American Indian and Alaska Native
Place of birth - Born in other state (%) - Multirace
Place of birth - Born in other state (%) - Other Race
Place of birth - Native, outside of US (%)
Place of birth - Native, outside of US (%) - White
Place of birth - Native, outside of US (%) - Black or African American
Place of birth - Native, outside of US (%) - Asian
Place of birth - Native, outside of US (%) - Hispanic or Latino
Place of birth - Native, outside of US (%) - American Indian and Alaska Native
Place of birth - Native, outside of US (%) - Multirace
Place of birth - Native, outside of US (%) - Other Race
Place of birth - Foreign born (%)
Place of birth - Foreign born (%) - White
Place of birth - Foreign born (%) - Black or African American
Place of birth - Foreign born (%) - Asian
Place of birth - Foreign born (%) - Hispanic or Latino
Place of birth - Foreign born (%) - American Indian and Alaska Native
Place of birth - Foreign born (%) - Multirace
Place of birth - Foreign born (%) - Other Race
Residents speaking English at home (%)
Residents speaking English at home - Born in the United States (%)
Residents speaking English at home - Native, born elsewhere (%)
Residents speaking English at home - Foreign born (%)
Residents speaking Spanish at home (%)
Residents speaking Spanish at home - Born in the United States (%)
Residents speaking Spanish at home - Native, born elsewhere (%)
Residents speaking Spanish at home - Foreign born (%)
Residents speaking other language at home (%)
Residents speaking other language at home - Born in the United States (%)
Residents speaking other language at home - Native, born elsewhere (%)
Residents speaking other language at home - Foreign born (%)
Marital status - Never married (%)
Marital status - Now married (%)
Marital status - Separated (%)
Marital status - Widowed (%)
Marital status - Divorced (%)
Ancestries Reported - Arab (%)
Ancestries Reported - Czech (%)
Ancestries Reported - Danish (%)
Ancestries Reported - Dutch (%)
Ancestries Reported - English (%)
Ancestries Reported - French (%)
Ancestries Reported - French Canadian (%)
Ancestries Reported - German (%)
Ancestries Reported - Greek (%)
Ancestries Reported - Hungarian (%)
Ancestries Reported - Irish (%)
Ancestries Reported - Italian (%)
Ancestries Reported - Lithuanian (%)
Ancestries Reported - Norwegian (%)
Ancestries Reported - Polish (%)
Ancestries Reported - Portuguese (%)
Ancestries Reported - Russian (%)
Ancestries Reported - Scotch-Irish (%)
Ancestries Reported - Scottish (%)
Ancestries Reported - Slovak (%)
Ancestries Reported - Subsaharan African (%)
Ancestries Reported - Swedish (%)
Ancestries Reported - Swiss (%)
Ancestries Reported - Ukrainian (%)
Ancestries Reported - United States (%)
Ancestries Reported - Welsh (%)
Ancestries Reported - West Indian (%)
Ancestries Reported - Other (%)
Geographical mobility - Same house 1 year ago (%)
Geographical mobility - Same house 1 year ago (%) - White
Geographical mobility - Same house 1 year ago (%) - Black or African American
Geographical mobility - Same house 1 year ago (%) - Asian
Geographical mobility - Same house 1 year ago (%) - Hispanic or Latino
Geographical mobility - Same house 1 year ago (%) - American Indian and Alaska Native
Geographical mobility - Same house 1 year ago (%) - Multirace
Geographical mobility - Same house 1 year ago (%) - Other Race
Geographical mobility - Moved within same county (%)
Geographical mobility - Moved within same county (%) - White
Geographical mobility - Moved within same county (%) - Black or African American
Geographical mobility - Moved within same county (%) - Asian
Geographical mobility - Moved within same county (%) - Hispanic or Latino
Geographical mobility - Moved within same county (%) - American Indian and Alaska Native
Geographical mobility - Moved within same county (%) - Multirace
Geographical mobility - Moved within same county (%) - Other Race
Geographical mobility - Moved from different county within same state (%)
Geographical mobility - Moved from different county within same state (%) - White
Geographical mobility - Moved from different county within same state (%) - Black or African American
Geographical mobility - Moved from different county within same state (%) - Asian
Geographical mobility - Moved from different county within same state (%) - Hispanic or Latino
Geographical mobility - Moved from different county within same state (%) - American Indian and Alaska Native
Geographical mobility - Moved from different county within same state (%) - Multirace
Geographical mobility - Moved from different county within same state (%) - Other Race
Geographical mobility - Moved from different state (%)
Geographical mobility - Moved from different state (%) - White
Geographical mobility - Moved from different state (%) - Black or African American
Geographical mobility - Moved from different state (%) - Asian
Geographical mobility - Moved from different state (%) - Hispanic or Latino
Geographical mobility - Moved from different state (%) - American Indian and Alaska Native
Geographical mobility - Moved from different state (%) - Multirace
Geographical mobility - Moved from different state (%) - Other Race
Geographical mobility - Moved from abroad (%)
Geographical mobility - Moved from abroad (%) - White
Geographical mobility - Moved from abroad (%) - Black or African American
Geographical mobility - Moved from abroad (%) - Asian
Geographical mobility - Moved from abroad (%) - Hispanic or Latino
Geographical mobility - Moved from abroad (%) - American Indian and Alaska Native
Geographical mobility - Moved from abroad (%) - Multirace
Geographical mobility - Moved from abroad (%) - Other Race
Place of birth for the foreign-born population - Ireland (%)
Place of birth for the foreign-born population - Denmark (%)
Place of birth for the foreign-born population - Norway (%)
Place of birth for the foreign-born population - Sweden (%)
Place of birth for the foreign-born population - United Kingdom (%)
Place of birth for the foreign-born population - England (%)
Place of birth for the foreign-born population - Scotland (%)
Place of birth for the foreign-born population - Other Northern Europe (%)
Place of birth for the foreign-born population - Austria (%)
Place of birth for the foreign-born population - Belgium (%)
Place of birth for the foreign-born population - France (%)
Place of birth for the foreign-born population - Germany (%)
Place of birth for the foreign-born population - Netherlands (%)
Place of birth for the foreign-born population - Switzerland (%)
Place of birth for the foreign-born population - Other Western Europe (%)
Place of birth for the foreign-born population - Greece (%)
Place of birth for the foreign-born population - Italy (%)
Place of birth for the foreign-born population - Portugal (%)
Place of birth for the foreign-born population - Spain (%)
Place of birth for the foreign-born population - Other Southern Europe (%)
Place of birth for the foreign-born population - Albania (%)
Place of birth for the foreign-born population - Belarus (%)
Place of birth for the foreign-born population - Bosnia and Herzegovina (%)
Place of birth for the foreign-born population - Bulgaria (%)
Place of birth for the foreign-born population - Croatia (%)
Place of birth for the foreign-born population - Czechoslovakia (%)
Place of birth for the foreign-born population - Hungary (%)
Place of birth for the foreign-born population - Latvia (%)
Place of birth for the foreign-born population - Lithuania (%)
Place of birth for the foreign-born population - North Macedonia (Macedonia) (%)
Place of birth for the foreign-born population - Moldova (%)
Place of birth for the foreign-born population - Poland (%)
Place of birth for the foreign-born population - Romania (%)
Place of birth for the foreign-born population - Russia (%)
Place of birth for the foreign-born population - Serbia (%)
Place of birth for the foreign-born population - Ukraine (%)
Place of birth for the foreign-born population - Other Eastern Europe (%)
Place of birth for the foreign-born population - China (%)
Place of birth for the foreign-born population - Hong Kong (%)
Place of birth for the foreign-born population - Taiwan (%)
Place of birth for the foreign-born population - Japan (%)
Place of birth for the foreign-born population - Korea (%)
Place of birth for the foreign-born population - Other Eastern Asia (%)
Place of birth for the foreign-born population - Afghanistan (%)
Place of birth for the foreign-born population - Bangladesh (%)
Place of birth for the foreign-born population - India (%)
Place of birth for the foreign-born population - Iran (%)
Place of birth for the foreign-born population - Kazakhstan (%)
Place of birth for the foreign-born population - Nepal (%)
Place of birth for the foreign-born population - Pakistan (%)
Place of birth for the foreign-born population - Sri Lanka (%)
Place of birth for the foreign-born population - Uzbekistan (%)
Place of birth for the foreign-born population - Other South Central Asia (%)
Place of birth for the foreign-born population - Burma (%)
Place of birth for the foreign-born population - Cambodia (%)
Place of birth for the foreign-born population - Indonesia (%)
Place of birth for the foreign-born population - Laos (%)
Place of birth for the foreign-born population - Malaysia (%)
Place of birth for the foreign-born population - Philippines (%)
Place of birth for the foreign-born population - Singapore (%)
Place of birth for the foreign-born population - Thailand (%)
Place of birth for the foreign-born population - Vietnam (%)
Place of birth for the foreign-born population - Other South Eastern Asia (%)
Place of birth for the foreign-born population - Armenia (%)
Place of birth for the foreign-born population - Iraq (%)
Place of birth for the foreign-born population - Israel (%)
Place of birth for the foreign-born population - Jordan (%)
Place of birth for the foreign-born population - Kuwait (%)
Place of birth for the foreign-born population - Lebanon (%)
Place of birth for the foreign-born population - Saudi Arabia (%)
Place of birth for the foreign-born population - Syria (%)
Place of birth for the foreign-born population - Turkey (%)
Place of birth for the foreign-born population - Yemen (%)
Place of birth for the foreign-born population - Other Western Asia (%)
Place of birth for the foreign-born population - Eritrea (%)
Place of birth for the foreign-born population - Ethiopia (%)
Place of birth for the foreign-born population - Kenya (%)
Place of birth for the foreign-born population - Somalia (%)
Place of birth for the foreign-born population - Uganda (%)
Place of birth for the foreign-born population - Zimbabwe (%)
Place of birth for the foreign-born population - Other Eastern Africa (%)
Place of birth for the foreign-born population - Cameroon (%)
Place of birth for the foreign-born population - Congo (%)
Place of birth for the foreign-born population - Democratic Republic of Congo (Zaire) (%)
Place of birth for the foreign-born population - Other Middle Africa (%)
Place of birth for the foreign-born population - Egypt (%)
Place of birth for the foreign-born population - Morocco (%)
Place of birth for the foreign-born population - Sudan (%)
Place of birth for the foreign-born population - Other Northern Africa (%)
Place of birth for the foreign-born population - South Africa (%)
Place of birth for the foreign-born population - Other Southern Africa (%)
Place of birth for the foreign-born population - Cabo Verde (%)
Place of birth for the foreign-born population - Ghana (%)
Place of birth for the foreign-born population - Liberia (%)
Place of birth for the foreign-born population - Nigeria (%)
Place of birth for the foreign-born population - Senegal (%)
Place of birth for the foreign-born population - Sierra Leone (%)
Place of birth for the foreign-born population - Other Western Africa (%)
Place of birth for the foreign-born population - Australia (%)
Place of birth for the foreign-born population - New Zealand (%)
Place of birth for the foreign-born population - Fiji (%)
Place of birth for the foreign-born population - Micronesia (%)
Place of birth for the foreign-born population - Bahamas (%)
Place of birth for the foreign-born population - Barbados (%)
Place of birth for the foreign-born population - Cuba (%)
Place of birth for the foreign-born population - Dominica (%)
Place of birth for the foreign-born population - Dominican Republic (%)
Place of birth for the foreign-born population - Grenada (%)
Place of birth for the foreign-born population - Haiti (%)
Place of birth for the foreign-born population - Jamaica (%)
Place of birth for the foreign-born population - St. Vincent and the Grenadines (%)
Place of birth for the foreign-born population - Trinidad and Tobago (%)
Place of birth for the foreign-born population - West Indies (%)
Place of birth for the foreign-born population - Other Caribbean (%)
Place of birth for the foreign-born population - Belize (%)
Place of birth for the foreign-born population - Costa Rica (%)
Place of birth for the foreign-born population - El Salvador (%)
Place of birth for the foreign-born population - Guatemala (%)
Place of birth for the foreign-born population - Honduras (%)
Place of birth for the foreign-born population - Mexico (%)
Place of birth for the foreign-born population - Nicaragua (%)
Place of birth for the foreign-born population - Panama (%)
Place of birth for the foreign-born population - Other Central America (%)
Place of birth for the foreign-born population - Argentina (%)
Place of birth for the foreign-born population - Bolivia (%)
Place of birth for the foreign-born population - Brazil (%)
Place of birth for the foreign-born population - Chile (%)
Place of birth for the foreign-born population - Colombia (%)
Place of birth for the foreign-born population - Ecuador (%)
Place of birth for the foreign-born population - Guyana (%)
Place of birth for the foreign-born population - Peru (%)
Place of birth for the foreign-born population - Uruguay (%)
Place of birth for the foreign-born population - Venezuela (%)
Place of birth for the foreign-born population - Other South America (%)
Place of birth for the foreign-born population - Canada (%)
Place of birth for the foreign-born population - Other Northern America (%)
Place of birth for the foreign-born population - Other (%)
Latest news about races in Bernalillo, NM collected exclusively by city-data.com from local newspapers, TV, and radio stations
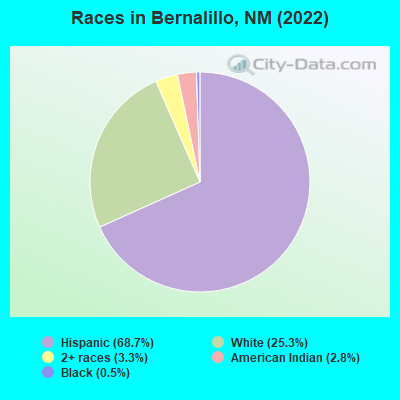
According to 2022 data, the most numerous races in Bernalillo, NM are Hispanic (6,553 residents), White alone (2,415 residents), and American Indian alone (267 residents). 61.8% of Bernalillo residents speak English at home. 14.4% of Bernalillo, NM residents are foreign-born (13.6% born in Latin America), which is 37.5% greater than the foreign-born rate of 9.0% across the entire state of New Mexico.
Race distribution in Bernalillo
2000 2022
813,495 44.7% White alone 765,386 42.1% Hispanic 161,460 8.9% American Indian alone 30,654 1.7% Black alone 25,793 1.4% Two or more races 18,257 1.0% Asian alone 3,009 0.2% Other race alone 992 0.05% Native Hawaiian and Other
1,059,867 50.2% Hispanic 735,478 34.8% White alone 171,808 8.1% American Indian alone 65,084 3.1% Two or more races 36,870 1.7% Black alone 35,870 1.7% Asian alone 7,582 0.4% Other race alone 785 0.04% Native Hawaiian and Other
Income and house value in Bernalillo Median household income in 2022 $76,910 White non-Hispanic householders$77,443 Black householders$83,210 American Indian and Alaska Native householders$32,474 Some other race householders$49,686 Two or more races householders$48,812 Hispanic or Latino race householdersMedian 2022 house value $310,753 White Non-Hispanic householders$315,487 Black or African American householders$253,607 American Indian or Alaska Native householders$265,104 Some other race householders$304,328 Two or more races householders$280,996 Hispanic or Latino householders
Median age by race in Bernalillo
47.5 Median age for White residents44.6 51.2 34.7 Median age for Black or African American residents31.1 40.9 32.6 Median age for American Indian / Alaska Native residents36.1 33.8 -538,170,823.3 Median age for Asian residents-598,765,431.5 -612,724,757.3 -679,089,026.2 Median age for Native Hawaiian / Pacific Islander residents-685,897,435.2 -659,380,691.5 45.6 Median age for Other race residents42.2 58.5 49.9 Median age for Two or more races residents44.5 47.6 60.4 Median age for White alone residents57.3 63.1 42.0 Median age for Hispanic or Latino residents41.1 42.5
Owner/renter occupied households by race in Bernalillo
House owners and renters - White residents 1,807 84.9% Owner occupied320 15.1% Renter occupiedHouse owners and renters - Black or African American residents 38 92.3% Owner occupied3 7.7% Renter occupiedHouse owners and renters - American Indian / Alaska Native residents 84 67.5% Owner occupied41 32.5% Renter occupiedHouse owners and renters - Native Hawaiian / Pacific Islander residents 3 100.0% Owner occupiedHouse owners and renters - Other race residents 597 81.2% Owner occupied138 18.8% Renter occupiedHouse owners and renters - Two or more races residents 970 75.4% Owner occupied317 24.6% Renter occupiedHouse owners and renters - White alone residents 1,060 90.4% Owner occupied112 9.6% Renter occupiedHouse owners and renters - Hispanic or Latino residents 2,023 79.2% Owner occupied533 20.8% Renter occupied
Language usage in Bernalillo
English speakers - Total 61.8% of residents of Bernalillo speak English at home.
32.4% of residents speak Spanish at home 1,689 56.5% Speak English very well1,303 43.5% Speak English less than very well2.9% of residents speak other language at home 175 65.3% Speak English very well93 34.7% Speak English less than very well
English speakers - Born in the United States 86.3% of residents of Bernalillo speak English at home.
11.1% of residents speak Spanish at home 205 76.8% Speak English very well62 23.2% Speak English less than very well1.1% of residents speak other language at home 27 100.0% Speak English very well
English speakers - Native, born elsewhere 28.2% of residents of Bernalillo speak English at home.
53.8% of residents speak Spanish at home 6 28.6% Speak English very well15 71.4% Speak English less than very well7.7% of residents speak other language at home 3 100.0% Speak English very well
English speakers - Foreign-born 8.2% of residents of Bernalillo speak English at home.
89.9% of residents speak Spanish at home 343 22.6% Speak English very well1,172 77.4% Speak English less than very well6.3% of residents speak other language at home 105 99.1% Speak English very well1 0.9% Speak English less than very well
White (Caucasian) - Speak only English Native:
78.4% (3,333)Foreign-born:
19.3% (70)
White (Caucasian) - Speak another language Native:
16.0% (680)Foreign-born:
55.8% (201)
Black or African American - Speak another language Native:
8.4% (5)Foreign-born:
76.6% (2)
American Indian / Alaska Native - Speak another language Native:
39.8% (143)Foreign-born:
100.0% (385)
Other race - Speak only English Native:
52.4% (657)Foreign-born:
4.8% (24)
Other race - Speak another language Native:
37.3% (468)Foreign-born:
87.2% (444)
Two or more races - Speak only English Native:
66.5% (1,348)Foreign-born:
3.3% (19)
Two or more races - Speak another language Native:
30.1% (610)Foreign-born:
76.6% (447)
White alone - Speak only English Native:
95.2% (2,183)Foreign-born:
22.2% (22)
White alone - Speak another language Native:
5.3% (122)Foreign-born:
73.2% (73)
Hispanic or Latino - Speak only English Native:
59.5% (2,885)Foreign-born:
9.3% (157)
Hispanic or Latino - Speak another language Native:
34.0% (1,650)Foreign-born:
80.3% (1,352)
Foreign-born residents in Bernalillo 1,373 residents are foreign born (13.6% Latin America ).
This city:
14.4%New Mexico:
9.2%
Marital status for residents in Bernalillo Marital status - White (Caucasian) population 15 years and over
Males 32.2% Never married46.4% Now married2.1% Separated1.7% Widowed17.5% DivorcedFemales 21.7% Never married43.6% Now married2.5% Separated11.1% Widowed21.0% DivorcedWomen who gave birth in the past 12 months Now married:
73.3% (9)Unmarried:
26.7% (3)
Women who did not give birth in the past 12 months Now married:
36.5% (329)Unmarried:
63.5% (572)
Marital status - Black or African American population 15 years and over
Males 78.6% Never married21.4% Now married0.0% Separated0.0% Widowed0.0% DivorcedFemales 16.7% Never married26.7% Now married6.7% Separated50.0% Widowed0.0% DivorcedWomen who did not give birth in the past 12 months Now married:
66.7% (10)Unmarried:
33.3% (5)
Marital status - American Indian / Alaska Native population 15 years and over
Males 46.0% Never married45.0% Now married0.0% Separated4.0% Widowed5.0% DivorcedFemales 47.0% Never married30.0% Now married0.0% Separated6.3% Widowed16.7% DivorcedWomen who did not give birth in the past 12 months Now married:
26.4% (74)Unmarried:
73.6% (205)
Marital status - Native Hawaiian / Pacific Islander population 15 years and over
Males 100.0% Never married0.0% Now married0.0% Separated0.0% Widowed0.0% DivorcedFemales 0.0% Never married0.0% Now married0.0% Separated100.0% Widowed0.0% DivorcedMarital status - Other race population 15 years and over
Males 36.4% Never married45.6% Now married1.9% Separated2.9% Widowed13.2% DivorcedFemales 26.3% Never married41.4% Now married1.0% Separated16.6% Widowed14.7% DivorcedWomen who gave birth in the past 12 months Now married:
50.0% (9)Unmarried:
50.0% (9)
Women who did not give birth in the past 12 months Now married:
37.2% (126)Unmarried:
62.8% (213)
Marital status - Two or more races population 15 years and over
Males 32.8% Never married45.2% Now married3.6% Separated3.0% Widowed15.5% DivorcedFemales 35.7% Never married40.1% Now married0.4% Separated13.9% Widowed9.9% DivorcedWomen who gave birth in the past 12 months Now married:
21.4% (4)Unmarried:
78.6% (15)
Women who did not give birth in the past 12 months Now married:
33.4% (191)Unmarried:
66.6% (381)
Marital status - White alone, not Hispanic / Latino population 15 years and over
Males 17.4% Never married58.7% Now married4.9% Separated2.1% Widowed16.9% DivorcedFemales 22.0% Never married43.2% Now married2.6% Separated17.3% Widowed14.8% DivorcedWomen who gave birth in the past 12 months Now married:
100.0% (3)Unmarried:
0.0% (0)
Women who did not give birth in the past 12 months Now married:
40.2% (167)Unmarried:
59.8% (248)
Marital status - Hispanic or Latino population 15 years and over
Males 39.9% Never married41.5% Now married0.6% Separated2.5% Widowed15.5% DivorcedFemales 27.2% Never married41.9% Now married1.4% Separated10.5% Widowed19.0% DivorcedWomen who gave birth in the past 12 months Now married:
51.5% (18)Unmarried:
48.5% (17)
Women who did not give birth in the past 12 months Now married:
34.7% (486)Unmarried:
65.3% (914)
Ancestries in Bernalillo
358 5.5% German216 3.3% English130 2.0% American120 1.8% Irish64 1.0% European61 0.9% French Canadian40 0.6% Dutch40 0.6% Hungarian40 0.6% Italian39 0.6% Lebanese25 0.4% Scotch-Irish24 0.4% Greek22 0.3% Scottish19 0.3% Danish17 0.3% French15 0.2% Eastern European14 0.2% Northern European13 0.2% Canadian13 0.2% Welsh5 0.08% Russian3 0.05% Haitian2 0.03% British1 0.02% Somali1 0.02% African
Geographical mobility in Bernalillo Same house 1 year ago 4,264 89.1% White (Caucasian)40 72.7% Black or African American470 90.7% American Indian / Alaska Native9 100.0% Asian6 100.0% Native Hawaiian / Pacific Islander1,795 93.7% Other race2,286 91.4% Two or more races2,258 93.5% White alone, not Hispanic / Latino5,885 89.9% Hispanic or LatinoMoved within same county 125 2.6% White / Caucasian2 3.3% Black or African American16 3.0% American Indian / Alaska Native55 2.9% Other race57 2.3% Two or more races53 2.2% White alone, not Hispanic / Latino214 3.3% Hispanic or LatinoMoved within same state 297 6.2% White / Caucasian10 17.7% Black or African American9 1.8% American Indian / Alaska Native36 1.9% Other race28 1.1% Two or more races102 4.2% White alone, not Hispanic / Latino378 5.8% Hispanic or LatinoMoved from different state 51 1.1% White / Caucasian24 4.6% American Indian / Alaska Native11 0.6% Other race93 3.7% Two or more races14 0.6% White alone, not Hispanic / Latino72 1.1% Hispanic or LatinoMoved from abroad 2 0.1% White4 7.3% Black or African American2 0.1% Other race34 1.3% Two or more races1 0.0% White alone, not Hispanic / Latino5 0.1% Hispanic or Latino
Children Nativity (place of birth) in Bernalillo
Children under 6 years - Living with two parents Both parents native 60 100.0% NativeBoth parents foreign-born 52 100.0% NativeOne native, one foreign-born parent 66 100.0% NativeChildren under 6 years - Living with one parent Native parent 189 100.0% NativeForeign-born parent 8 100.0% NativeChildren 6 to 17 years - Living with two parents Both parents native 164 99.7% Native0 0.3% Foreign-bornBoth parents foreign-born 90 96.5% Native3 3.5% Foreign-bornOne native, one foreign-born parent 15 89.7% Native2 10.3% Foreign-bornChildren 6 to 17 years - Living with one parent Native parent 464 100.0% NativeForeign-born parent 36 50.9% Native34 49.1% Foreign-born
Grandparents responsible for own grandchildren in Bernalillo
Grandparents (30 to 59 years) White / Caucasian 1 10.7% Responsible for grandchildren12 89.3% Not responsible for grandchildrenOther race 20 63.9% Responsible for grandchildren11 36.1% Not responsible for grandchildrenTwo or more races 5 31.6% Responsible for grandchildren11 68.4% Not responsible for grandchildrenWhite alone, not Hispanic / Latino 5 100.0% Not responsible for grandchildrenHispanic or Latino 27 33.0% Responsible for grandchildren54 67.0% Not responsible for grandchildrenGrandparents (60 years and over) White / Caucasian 33 23.4% Responsible for grandchildren108 76.6% Not responsible for grandchildrenOther race 13 8.9% Responsible for grandchildren129 91.1% Not responsible for grandchildrenTwo or more races 15 14.1% Responsible for grandchildren91 85.9% Not responsible for grandchildrenWhite alone, not Hispanic / Latino 20 12.9% Responsible for grandchildren133 87.1% Not responsible for grandchildrenHispanic or Latino 59 18.6% Responsible for grandchildren260 81.4% Not responsible for grandchildren