Races in Bethlehem, Pennsylvania (PA) Detailed Stats
Data:
Races - White alone (%)
Races - White alone (% change since 2000)
Races - Black alone (%)
Races - Black alone (% change since 2000)
Races - American Indian alone (%)
Races - American Indian alone (% change since 2000)
Races - Asian alone (%)
Races - Asian alone (% change since 2000)
Races - Hispanic (%)
Races - Hispanic (% change since 2000)
Races - Native Hawaiian and Other Pacific Islander alone (%)
Races - Native Hawaiian and Other Pacific Islander alone (% change since 2000)
Races - Two or more races(%)
Races - Two or more races(% change since 2000)
Races - Other race alone (%)
Races - Other race alone (% change since 2000)
Racial diversity
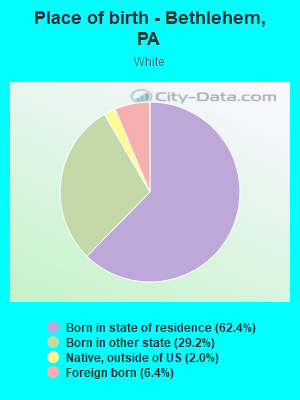
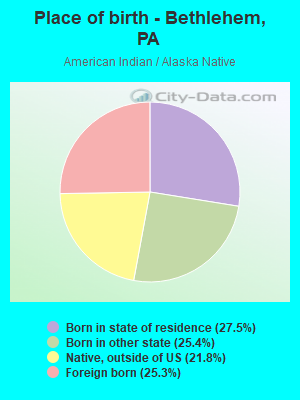
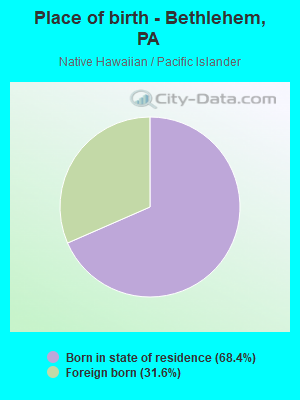
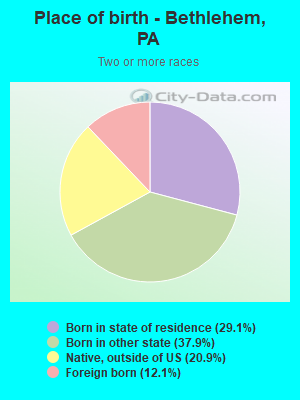
Place of birth - Born in state of residence (%)
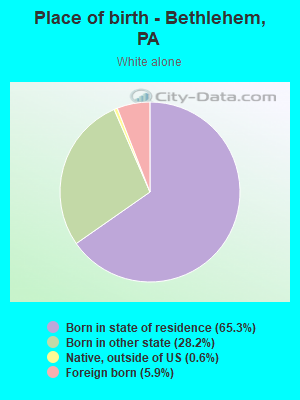
Place of birth - Born in state of residence (%) - White
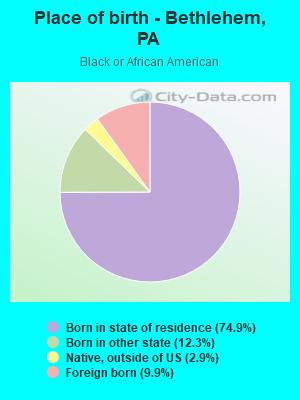
Place of birth - Born in state of residence (%) - Black or African American
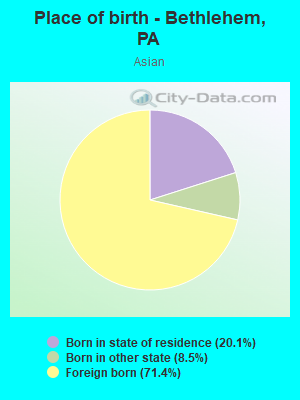
Place of birth - Born in state of residence (%) - Asian
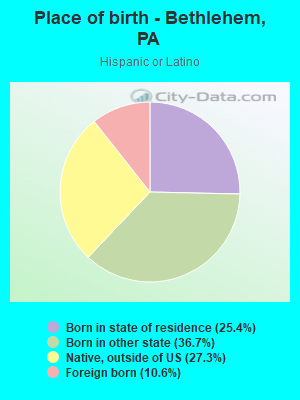
Place of birth - Born in state of residence (%) - Hispanic or Latino
Place of birth - Born in state of residence (%) - American Indian and Alaska Native
Place of birth - Born in state of residence (%) - Multirace
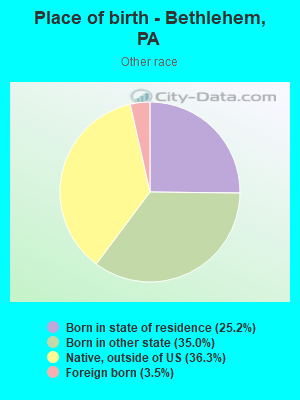
Place of birth - Born in state of residence (%) - Other Race
Place of birth - Born in other state (%)
Place of birth - Born in other state (%) - White
Place of birth - Born in other state (%) - Black or African American
Place of birth - Born in other state (%) - Asian
Place of birth - Born in other state (%) - Hispanic or Latino
Place of birth - Born in other state (%) - American Indian and Alaska Native
Place of birth - Born in other state (%) - Multirace
Place of birth - Born in other state (%) - Other Race
Place of birth - Native, outside of US (%)
Place of birth - Native, outside of US (%) - White
Place of birth - Native, outside of US (%) - Black or African American
Place of birth - Native, outside of US (%) - Asian
Place of birth - Native, outside of US (%) - Hispanic or Latino
Place of birth - Native, outside of US (%) - American Indian and Alaska Native
Place of birth - Native, outside of US (%) - Multirace
Place of birth - Native, outside of US (%) - Other Race
Place of birth - Foreign born (%)
Place of birth - Foreign born (%) - White
Place of birth - Foreign born (%) - Black or African American
Place of birth - Foreign born (%) - Asian
Place of birth - Foreign born (%) - Hispanic or Latino
Place of birth - Foreign born (%) - American Indian and Alaska Native
Place of birth - Foreign born (%) - Multirace
Place of birth - Foreign born (%) - Other Race
Residents speaking English at home (%)
Residents speaking English at home - Born in the United States (%)
Residents speaking English at home - Native, born elsewhere (%)
Residents speaking English at home - Foreign born (%)
Residents speaking Spanish at home (%)
Residents speaking Spanish at home - Born in the United States (%)
Residents speaking Spanish at home - Native, born elsewhere (%)
Residents speaking Spanish at home - Foreign born (%)
Residents speaking other language at home (%)
Residents speaking other language at home - Born in the United States (%)
Residents speaking other language at home - Native, born elsewhere (%)
Residents speaking other language at home - Foreign born (%)
Marital status - Never married (%)
Marital status - Now married (%)
Marital status - Separated (%)
Marital status - Widowed (%)
Marital status - Divorced (%)
Ancestries Reported - Arab (%)
Ancestries Reported - Czech (%)
Ancestries Reported - Danish (%)
Ancestries Reported - Dutch (%)
Ancestries Reported - English (%)
Ancestries Reported - French (%)
Ancestries Reported - French Canadian (%)
Ancestries Reported - German (%)
Ancestries Reported - Greek (%)
Ancestries Reported - Hungarian (%)
Ancestries Reported - Irish (%)
Ancestries Reported - Italian (%)
Ancestries Reported - Lithuanian (%)
Ancestries Reported - Norwegian (%)
Ancestries Reported - Polish (%)
Ancestries Reported - Portuguese (%)
Ancestries Reported - Russian (%)
Ancestries Reported - Scotch-Irish (%)
Ancestries Reported - Scottish (%)
Ancestries Reported - Slovak (%)
Ancestries Reported - Subsaharan African (%)
Ancestries Reported - Swedish (%)
Ancestries Reported - Swiss (%)
Ancestries Reported - Ukrainian (%)
Ancestries Reported - United States (%)
Ancestries Reported - Welsh (%)
Ancestries Reported - West Indian (%)
Ancestries Reported - Other (%)
Geographical mobility - Same house 1 year ago (%)
Geographical mobility - Same house 1 year ago (%) - White
Geographical mobility - Same house 1 year ago (%) - Black or African American
Geographical mobility - Same house 1 year ago (%) - Asian
Geographical mobility - Same house 1 year ago (%) - Hispanic or Latino
Geographical mobility - Same house 1 year ago (%) - American Indian and Alaska Native
Geographical mobility - Same house 1 year ago (%) - Multirace
Geographical mobility - Same house 1 year ago (%) - Other Race
Geographical mobility - Moved within same county (%)
Geographical mobility - Moved within same county (%) - White
Geographical mobility - Moved within same county (%) - Black or African American
Geographical mobility - Moved within same county (%) - Asian
Geographical mobility - Moved within same county (%) - Hispanic or Latino
Geographical mobility - Moved within same county (%) - American Indian and Alaska Native
Geographical mobility - Moved within same county (%) - Multirace
Geographical mobility - Moved within same county (%) - Other Race
Geographical mobility - Moved from different county within same state (%)
Geographical mobility - Moved from different county within same state (%) - White
Geographical mobility - Moved from different county within same state (%) - Black or African American
Geographical mobility - Moved from different county within same state (%) - Asian
Geographical mobility - Moved from different county within same state (%) - Hispanic or Latino
Geographical mobility - Moved from different county within same state (%) - American Indian and Alaska Native
Geographical mobility - Moved from different county within same state (%) - Multirace
Geographical mobility - Moved from different county within same state (%) - Other Race
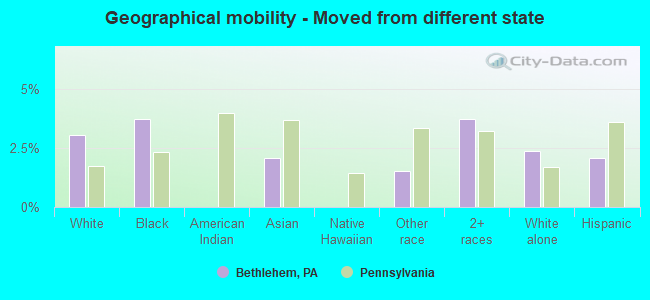
Geographical mobility - Moved from different state (%)
Geographical mobility - Moved from different state (%) - White
Geographical mobility - Moved from different state (%) - Black or African American
Geographical mobility - Moved from different state (%) - Asian
Geographical mobility - Moved from different state (%) - Hispanic or Latino
Geographical mobility - Moved from different state (%) - American Indian and Alaska Native
Geographical mobility - Moved from different state (%) - Multirace
Geographical mobility - Moved from different state (%) - Other Race
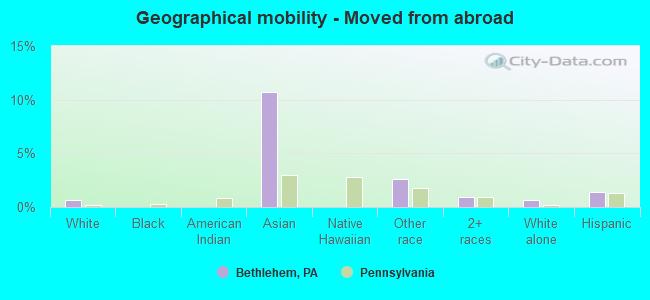
Geographical mobility - Moved from abroad (%)
Geographical mobility - Moved from abroad (%) - White
Geographical mobility - Moved from abroad (%) - Black or African American
Geographical mobility - Moved from abroad (%) - Asian
Geographical mobility - Moved from abroad (%) - Hispanic or Latino
Geographical mobility - Moved from abroad (%) - American Indian and Alaska Native
Geographical mobility - Moved from abroad (%) - Multirace
Geographical mobility - Moved from abroad (%) - Other Race
Place of birth for the foreign-born population - Ireland (%)
Place of birth for the foreign-born population - Denmark (%)
Place of birth for the foreign-born population - Norway (%)
Place of birth for the foreign-born population - Sweden (%)
Place of birth for the foreign-born population - United Kingdom (%)
Place of birth for the foreign-born population - England (%)
Place of birth for the foreign-born population - Scotland (%)
Place of birth for the foreign-born population - Other Northern Europe (%)
Place of birth for the foreign-born population - Austria (%)
Place of birth for the foreign-born population - Belgium (%)
Place of birth for the foreign-born population - France (%)
Place of birth for the foreign-born population - Germany (%)
Place of birth for the foreign-born population - Netherlands (%)
Place of birth for the foreign-born population - Switzerland (%)
Place of birth for the foreign-born population - Other Western Europe (%)
Place of birth for the foreign-born population - Greece (%)
Place of birth for the foreign-born population - Italy (%)
Place of birth for the foreign-born population - Portugal (%)
Place of birth for the foreign-born population - Spain (%)
Place of birth for the foreign-born population - Other Southern Europe (%)
Place of birth for the foreign-born population - Albania (%)
Place of birth for the foreign-born population - Belarus (%)
Place of birth for the foreign-born population - Bosnia and Herzegovina (%)
Place of birth for the foreign-born population - Bulgaria (%)
Place of birth for the foreign-born population - Croatia (%)
Place of birth for the foreign-born population - Czechoslovakia (%)
Place of birth for the foreign-born population - Hungary (%)
Place of birth for the foreign-born population - Latvia (%)
Place of birth for the foreign-born population - Lithuania (%)
Place of birth for the foreign-born population - North Macedonia (Macedonia) (%)
Place of birth for the foreign-born population - Moldova (%)
Place of birth for the foreign-born population - Poland (%)
Place of birth for the foreign-born population - Romania (%)
Place of birth for the foreign-born population - Russia (%)
Place of birth for the foreign-born population - Serbia (%)
Place of birth for the foreign-born population - Ukraine (%)
Place of birth for the foreign-born population - Other Eastern Europe (%)
Place of birth for the foreign-born population - China (%)
Place of birth for the foreign-born population - Hong Kong (%)
Place of birth for the foreign-born population - Taiwan (%)
Place of birth for the foreign-born population - Japan (%)
Place of birth for the foreign-born population - Korea (%)
Place of birth for the foreign-born population - Other Eastern Asia (%)
Place of birth for the foreign-born population - Afghanistan (%)
Place of birth for the foreign-born population - Bangladesh (%)
Place of birth for the foreign-born population - India (%)
Place of birth for the foreign-born population - Iran (%)
Place of birth for the foreign-born population - Kazakhstan (%)
Place of birth for the foreign-born population - Nepal (%)
Place of birth for the foreign-born population - Pakistan (%)
Place of birth for the foreign-born population - Sri Lanka (%)
Place of birth for the foreign-born population - Uzbekistan (%)
Place of birth for the foreign-born population - Other South Central Asia (%)
Place of birth for the foreign-born population - Burma (%)
Place of birth for the foreign-born population - Cambodia (%)
Place of birth for the foreign-born population - Indonesia (%)
Place of birth for the foreign-born population - Laos (%)
Place of birth for the foreign-born population - Malaysia (%)
Place of birth for the foreign-born population - Philippines (%)
Place of birth for the foreign-born population - Singapore (%)
Place of birth for the foreign-born population - Thailand (%)
Place of birth for the foreign-born population - Vietnam (%)
Place of birth for the foreign-born population - Other South Eastern Asia (%)
Place of birth for the foreign-born population - Armenia (%)
Place of birth for the foreign-born population - Iraq (%)
Place of birth for the foreign-born population - Israel (%)
Place of birth for the foreign-born population - Jordan (%)
Place of birth for the foreign-born population - Kuwait (%)
Place of birth for the foreign-born population - Lebanon (%)
Place of birth for the foreign-born population - Saudi Arabia (%)
Place of birth for the foreign-born population - Syria (%)
Place of birth for the foreign-born population - Turkey (%)
Place of birth for the foreign-born population - Yemen (%)
Place of birth for the foreign-born population - Other Western Asia (%)
Place of birth for the foreign-born population - Eritrea (%)
Place of birth for the foreign-born population - Ethiopia (%)
Place of birth for the foreign-born population - Kenya (%)
Place of birth for the foreign-born population - Somalia (%)
Place of birth for the foreign-born population - Uganda (%)
Place of birth for the foreign-born population - Zimbabwe (%)
Place of birth for the foreign-born population - Other Eastern Africa (%)
Place of birth for the foreign-born population - Cameroon (%)
Place of birth for the foreign-born population - Congo (%)
Place of birth for the foreign-born population - Democratic Republic of Congo (Zaire) (%)
Place of birth for the foreign-born population - Other Middle Africa (%)
Place of birth for the foreign-born population - Egypt (%)
Place of birth for the foreign-born population - Morocco (%)
Place of birth for the foreign-born population - Sudan (%)
Place of birth for the foreign-born population - Other Northern Africa (%)
Place of birth for the foreign-born population - South Africa (%)
Place of birth for the foreign-born population - Other Southern Africa (%)
Place of birth for the foreign-born population - Cabo Verde (%)
Place of birth for the foreign-born population - Ghana (%)
Place of birth for the foreign-born population - Liberia (%)
Place of birth for the foreign-born population - Nigeria (%)
Place of birth for the foreign-born population - Senegal (%)
Place of birth for the foreign-born population - Sierra Leone (%)
Place of birth for the foreign-born population - Other Western Africa (%)
Place of birth for the foreign-born population - Australia (%)
Place of birth for the foreign-born population - New Zealand (%)
Place of birth for the foreign-born population - Fiji (%)
Place of birth for the foreign-born population - Micronesia (%)
Place of birth for the foreign-born population - Bahamas (%)
Place of birth for the foreign-born population - Barbados (%)
Place of birth for the foreign-born population - Cuba (%)
Place of birth for the foreign-born population - Dominica (%)
Place of birth for the foreign-born population - Dominican Republic (%)
Place of birth for the foreign-born population - Grenada (%)
Place of birth for the foreign-born population - Haiti (%)
Place of birth for the foreign-born population - Jamaica (%)
Place of birth for the foreign-born population - St. Vincent and the Grenadines (%)
Place of birth for the foreign-born population - Trinidad and Tobago (%)
Place of birth for the foreign-born population - West Indies (%)
Place of birth for the foreign-born population - Other Caribbean (%)
Place of birth for the foreign-born population - Belize (%)
Place of birth for the foreign-born population - Costa Rica (%)
Place of birth for the foreign-born population - El Salvador (%)
Place of birth for the foreign-born population - Guatemala (%)
Place of birth for the foreign-born population - Honduras (%)
Place of birth for the foreign-born population - Mexico (%)
Place of birth for the foreign-born population - Nicaragua (%)
Place of birth for the foreign-born population - Panama (%)
Place of birth for the foreign-born population - Other Central America (%)
Place of birth for the foreign-born population - Argentina (%)
Place of birth for the foreign-born population - Bolivia (%)
Place of birth for the foreign-born population - Brazil (%)
Place of birth for the foreign-born population - Chile (%)
Place of birth for the foreign-born population - Colombia (%)
Place of birth for the foreign-born population - Ecuador (%)
Place of birth for the foreign-born population - Guyana (%)
Place of birth for the foreign-born population - Peru (%)
Place of birth for the foreign-born population - Uruguay (%)
Place of birth for the foreign-born population - Venezuela (%)
Place of birth for the foreign-born population - Other South America (%)
Place of birth for the foreign-born population - Canada (%)
Place of birth for the foreign-born population - Other Northern America (%)
Place of birth for the foreign-born population - Other (%)
Latest news about races in Bethlehem, PA collected exclusively by city-data.com from local newspapers, TV, and radio stations
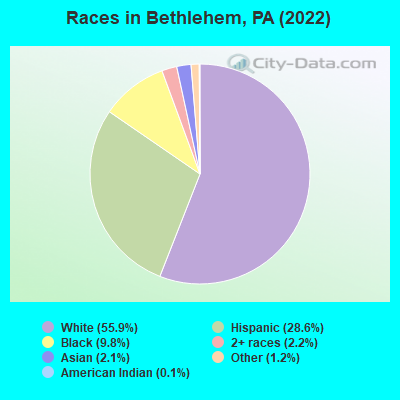
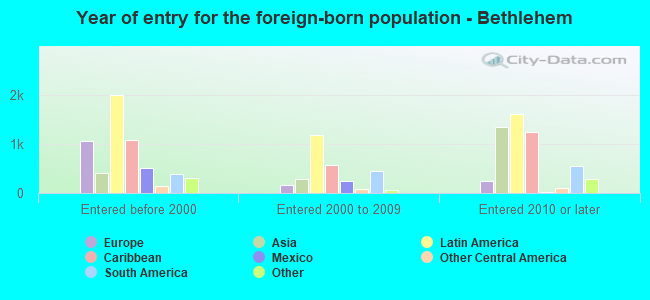
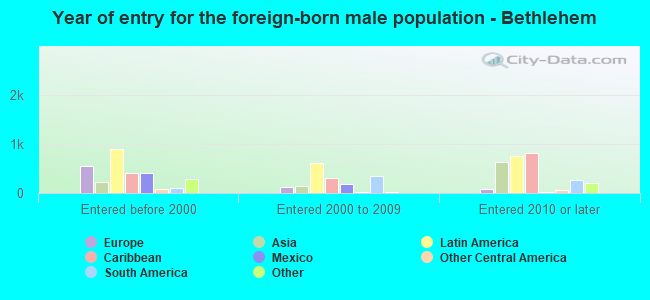
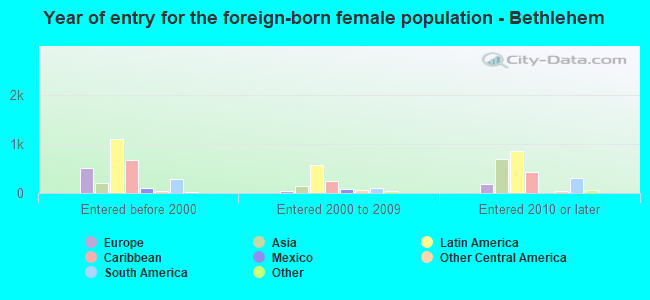
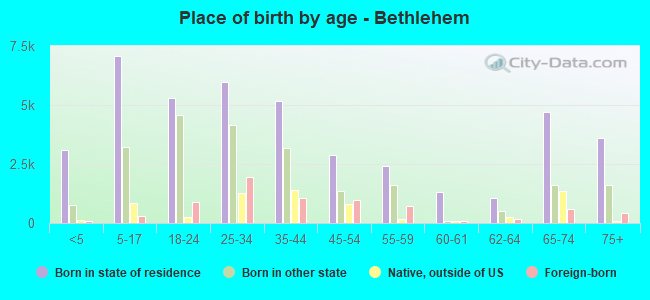
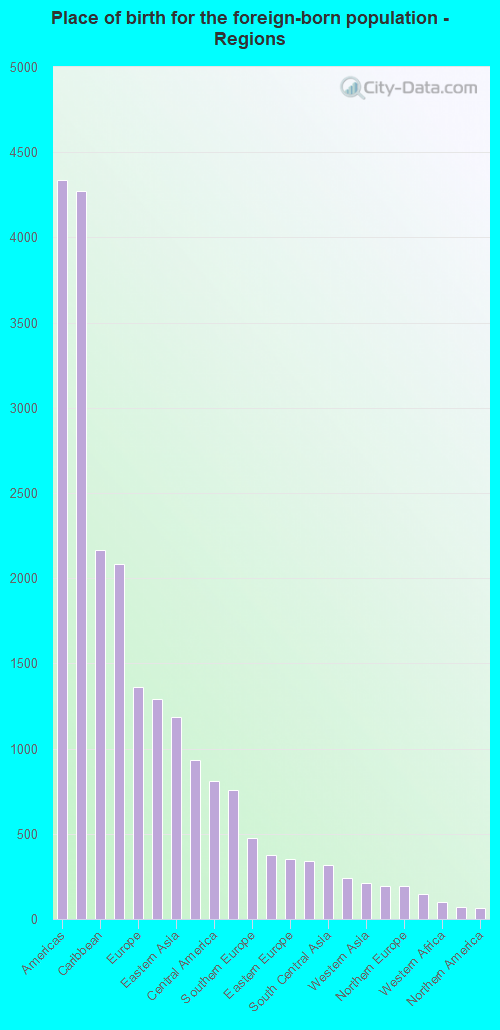
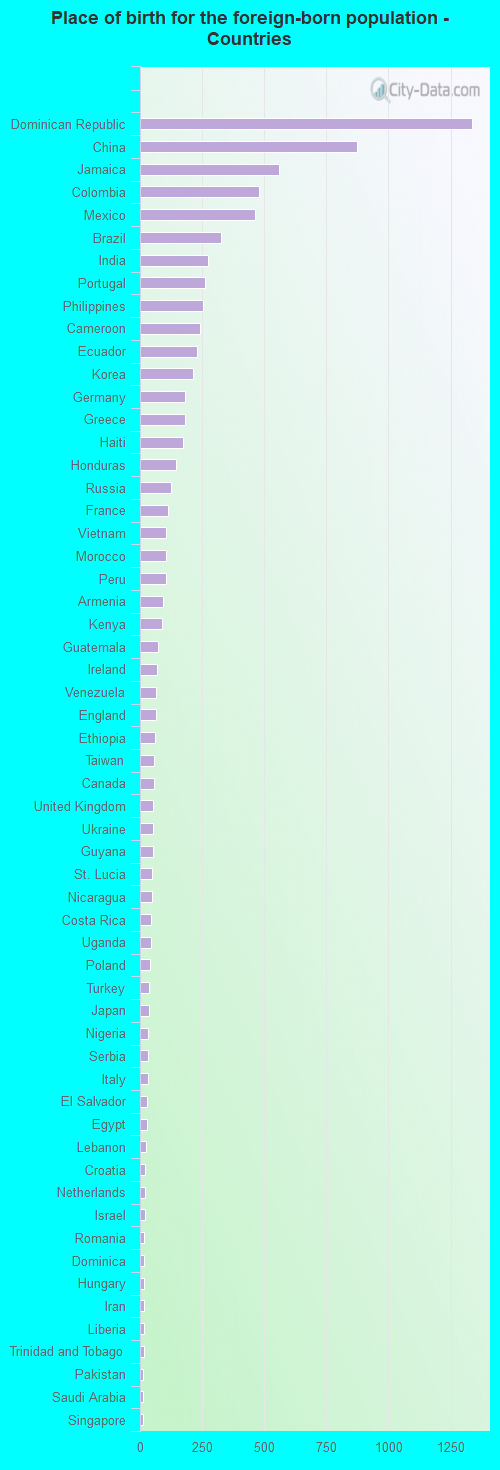
According to 2022 data, the most numerous races in Bethlehem, PA are White alone (44,100 residents), Black alone (7,755 residents), and Hispanic (22,522 residents). 76.4% of Bethlehem residents speak English at home. 11.0% of Bethlehem, PA residents are foreign-born (5.4% born in Latin America, 2.6% born in Asia, 1.7% born in Europe), which is 36.5% greater than the foreign-born rate of 7.0% across the entire state of Pennsylvania.
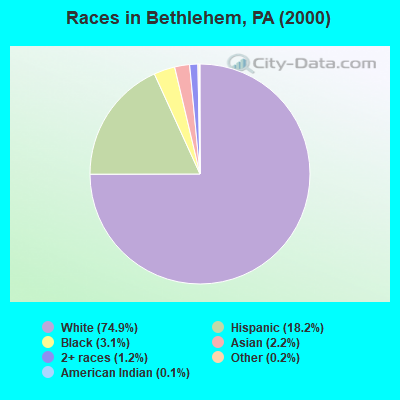
Race distribution in Bethlehem
2000 2022
10,322,455 84.1% White alone 1,202,437 9.8% Black alone 394,088 3.2% Hispanic 218,296 1.8% Asian alone 113,097 0.9% Two or more races 13,086 0.1% Other race alone 14,904 0.1% American Indian alone 2,691 0.02% Native Hawaiian and Other
9,487,228 73.1% White alone 1,311,581 10.1% Black alone 1,115,997 8.6% Hispanic 493,942 3.8% Two or more races 487,124 3.8% Asian alone 63,582 0.5% Other race alone 10,130 0.08% American Indian alone 2,424 0.02% Native Hawaiian and Other
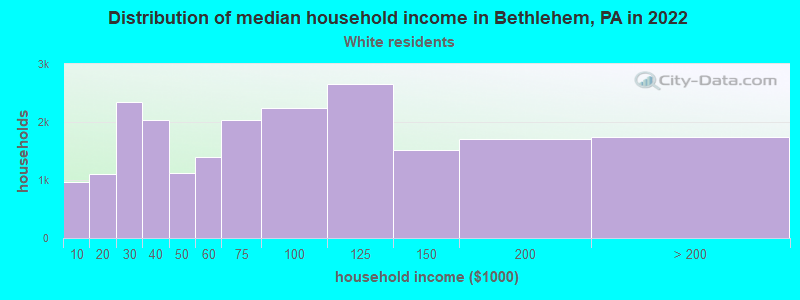
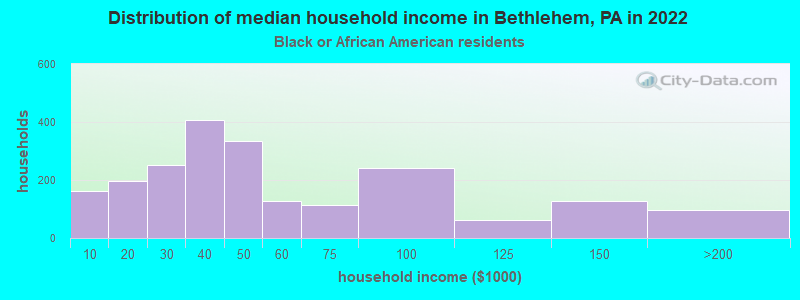
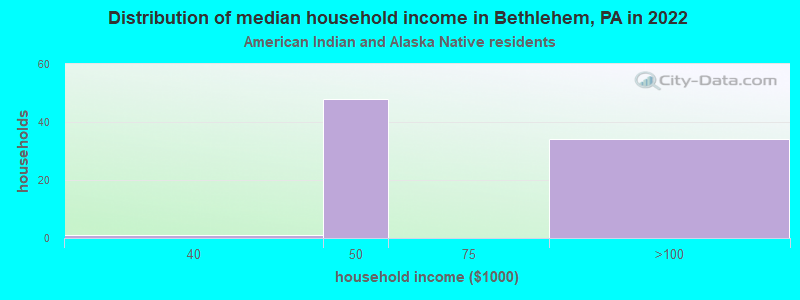
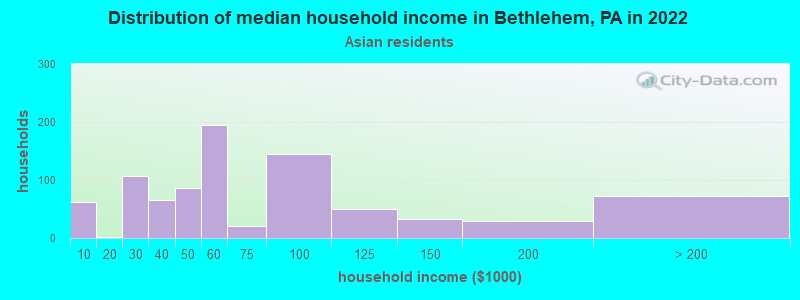
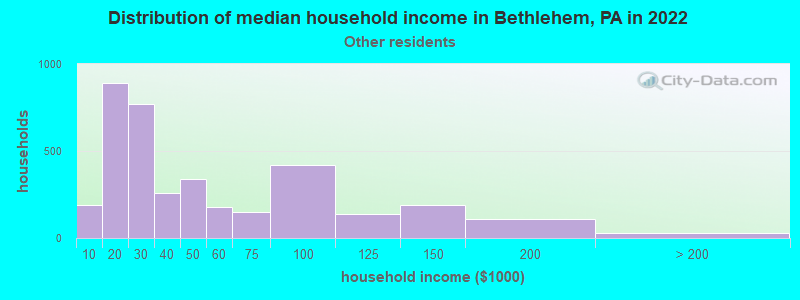
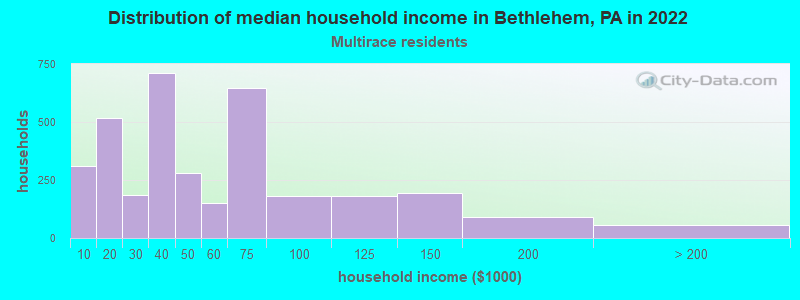
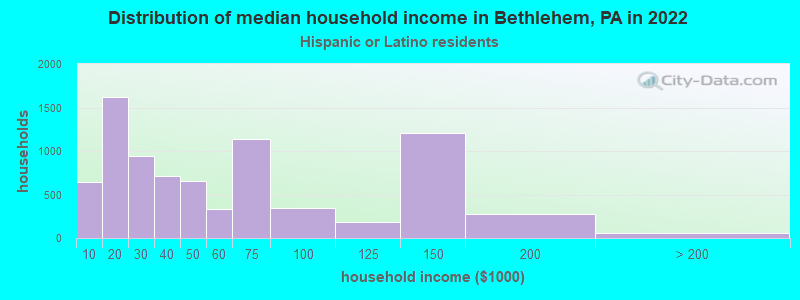
Income and house value in Bethlehem Median household income in 2022 $72,948 White non-Hispanic householders$47,875 Black householders$56,201 Asian householders$27,457 Some other race householders$61,668 Two or more races householders$40,683 Hispanic or Latino race householdersMedian 2022 house value $263,676 White Non-Hispanic householders$208,930 Black or African American householders$203,112 American Indian or Alaska Native householders $207,079 Asian householders$190,947 Some other race householders$174,814 Two or more races householders$190,947 Hispanic or Latino householders
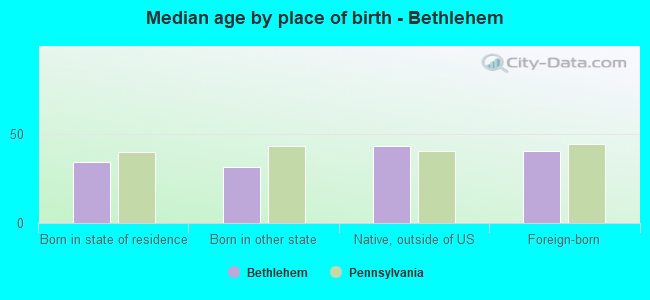
Median age by race in Bethlehem
39.1 Median age for White residents37.3 41.9 23.6 Median age for Black or African American residents30.5 21.5 40.1 Median age for American Indian / Alaska Native residents40.1 40.1 24.0 Median age for Asian residents26.3 23.6 -666,666,666.0 Median age for Native Hawaiian / Pacific Islander residents-666,666,666.0 -666,666,666.0 31.6 Median age for Other race residents24.1 36.9 27.3 Median age for Two or more races residents28.5 23.4 40.4 Median age for White alone residents37.9 43.6 31.0 Median age for Hispanic or Latino residents30.1 31.5
Owner/renter occupied households by race in Bethlehem
House owners and renters - White residents 12,409 59.6% Owner occupied8,418 40.4% Renter occupiedHouse owners and renters - Black or African American residents 1,164 50.4% Owner occupied1,146 49.6% Renter occupiedHouse owners and renters - American Indian / Alaska Native residents 17 25.6% Owner occupied48 74.4% Renter occupiedHouse owners and renters - Asian residents 197 24.7% Owner occupied602 75.3% Renter occupiedHouse owners and renters - Other race residents 685 23.8% Owner occupied2,198 76.2% Renter occupiedHouse owners and renters - Two or more races residents 1,467 32.0% Owner occupied3,124 68.0% Renter occupiedHouse owners and renters - White alone residents 11,510 59.9% Owner occupied7,707 40.1% Renter occupiedHouse owners and renters - Hispanic or Latino residents 2,779 34.3% Owner occupied5,320 65.7% Renter occupied
Language usage in Bethlehem
English speakers - Total 76.4% of residents of Bethlehem speak English at home.
18.0% of residents speak Spanish at home 8,381 62.0% Speak English very well5,132 38.0% Speak English less than very well5.5% of residents speak other language at home 2,177 52.7% Speak English very well1,957 47.3% Speak English less than very well
English speakers - Born in the United States 80.8% of residents of Bethlehem speak English at home.
19.0% of residents speak Spanish at home 3,965 95.6% Speak English very well184 4.4% Speak English less than very well0.2% of residents speak other language at home 49 100.0% Speak English very well
English speakers - Native, born elsewhere 17.3% of residents of Bethlehem speak English at home.
82.7% of residents speak Spanish at home 2,072 39.1% Speak English very well3,234 60.9% Speak English less than very well
English speakers - Foreign-born 14.8% of residents of Bethlehem speak English at home.
33.9% of residents speak Spanish at home 869 36.3% Speak English very well1,526 63.7% Speak English less than very well51.3% of residents speak other language at home 1,792 49.4% Speak English very well1,832 50.6% Speak English less than very well
White (Caucasian) - Speak only English Native:
95.5% (42,614)Foreign-born:
22.2% (696)
White (Caucasian) - Speak another language Native:
4.5% (2,004)Foreign-born:
77.8% (2,439)
Black or African American - Speak only English Native:
99.1% (5,652)Foreign-born:
33.3% (342)
Black or African American - Speak another language Native:
1.9% (109)Foreign-born:
76.1% (781)
American Indian / Alaska Native - Speak another language Native:
52.2% (98)Foreign-born:
100.0% (64)
Asian - Speak only English Native:
58.9% (497)Foreign-born:
26.3% (429)
Asian - Speak another language Native:
39.9% (337)Foreign-born:
88.0% (1,432)
Other race - Speak another language Native:
70.0% (4,468)Foreign-born:
100.0% (264)
Two or more races - Speak only English Native:
51.0% (4,827)Foreign-born:
7.3% (104)
Two or more races - Speak another language Native:
49.0% (4,631)Foreign-born:
92.7% (1,325)
White alone - Speak only English Native:
97.6% (39,406)Foreign-born:
26.7% (696)
White alone - Speak another language Native:
2.4% (959)Foreign-born:
73.3% (1,910)
Hispanic or Latino - Speak another language Native:
57.1% (10,442)Foreign-born:
100.0% (2,395)
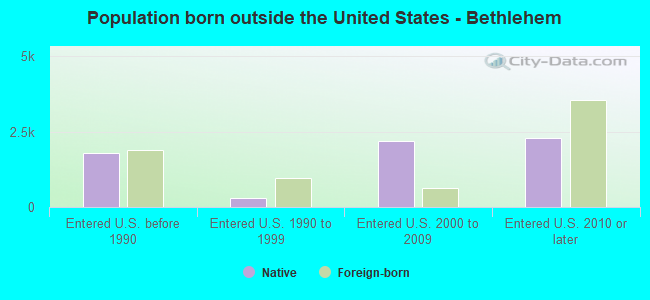
Foreign-born residents in Bethlehem 8,549 residents are foreign born (5.4% Latin America , 2.6% Asia , 1.7% Europe ).
This city:
11.0%Pennsylvania:
7.3%
Marital status for residents in Bethlehem Marital status - White (Caucasian) population 15 years and over
Males 50.4% Never married36.6% Now married1.6% Separated4.8% Widowed6.6% DivorcedFemales 39.6% Never married32.3% Now married4.4% Separated12.6% Widowed11.2% DivorcedWomen who gave birth in the past 12 months Now married:
79.2% (388)Unmarried:
20.8% (102)
Women who did not give birth in the past 12 months Now married:
25.8% (3,060)Unmarried:
74.2% (8,799)
Marital status - Black or African American population 15 years and over
Males 66.6% Never married29.4% Now married0.5% Separated0.3% Widowed3.1% DivorcedFemales 52.3% Never married20.0% Now married4.0% Separated7.0% Widowed16.6% DivorcedWomen who gave birth in the past 12 months Now married:
70.9% (54)Unmarried:
29.1% (22)
Women who did not give birth in the past 12 months Now married:
19.2% (329)Unmarried:
80.8% (1,382)
Marital status - American Indian / Alaska Native population 15 years and over
Males 20.6% Never married63.5% Now married0.0% Separated15.9% Widowed0.0% DivorcedFemales 2.5% Never married73.8% Now married0.0% Separated23.8% Widowed0.0% DivorcedWomen who did not give birth in the past 12 months Now married:
92.3% (44)Unmarried:
7.7% (4)
Marital status - Asian population 15 years and over
Males 71.5% Never married27.4% Now married0.0% Separated0.4% Widowed0.7% DivorcedFemales 55.8% Never married30.7% Now married0.0% Separated7.4% Widowed6.0% DivorcedWomen who gave birth in the past 12 months Now married:
100.0% (14)Unmarried:
0.0% (0)
Women who did not give birth in the past 12 months Now married:
30.2% (346)Unmarried:
69.8% (799)
Marital status - Native Hawaiian / Pacific Islander population 15 years and over
Males 0.0% Never married100.0% Now married0.0% Separated0.0% Widowed0.0% DivorcedFemales 0.0% Never married0.0% Now married0.0% Separated100.0% Widowed0.0% DivorcedMarital status - Other race population 15 years and over
Males 53.5% Never married42.3% Now married4.2% Separated0.0% Widowed0.0% DivorcedFemales 57.0% Never married24.8% Now married2.3% Separated7.1% Widowed8.8% DivorcedWomen who gave birth in the past 12 months Now married:
39.7% (84)Unmarried:
60.3% (127)
Women who did not give birth in the past 12 months Now married:
35.5% (1,165)Unmarried:
64.5% (2,114)
Marital status - Two or more races population 15 years and over
Males 74.6% Never married20.3% Now married0.8% Separated0.0% Widowed4.2% DivorcedFemales 55.9% Never married27.3% Now married3.2% Separated2.4% Widowed11.2% DivorcedWomen who gave birth in the past 12 months Now married:
61.5% (186)Unmarried:
38.5% (117)
Women who did not give birth in the past 12 months Now married:
23.2% (748)Unmarried:
76.8% (2,481)
Marital status - White alone, not Hispanic / Latino population 15 years and over
Males 50.8% Never married37.0% Now married0.9% Separated5.2% Widowed6.1% DivorcedFemales 38.9% Never married33.9% Now married2.7% Separated13.9% Widowed10.6% DivorcedWomen who gave birth in the past 12 months Now married:
79.2% (388)Unmarried:
20.8% (102)
Women who did not give birth in the past 12 months Now married:
24.7% (2,492)Unmarried:
75.3% (7,579)
Marital status - Hispanic or Latino population 15 years and over
Males 60.6% Never married34.0% Now married3.1% Separated0.0% Widowed2.4% DivorcedFemales 54.3% Never married21.8% Now married7.4% Separated5.2% Widowed11.3% DivorcedWomen who gave birth in the past 12 months Now married:
43.2% (227)Unmarried:
56.8% (298)
Women who did not give birth in the past 12 months Now married:
33.2% (2,143)Unmarried:
66.8% (4,308)
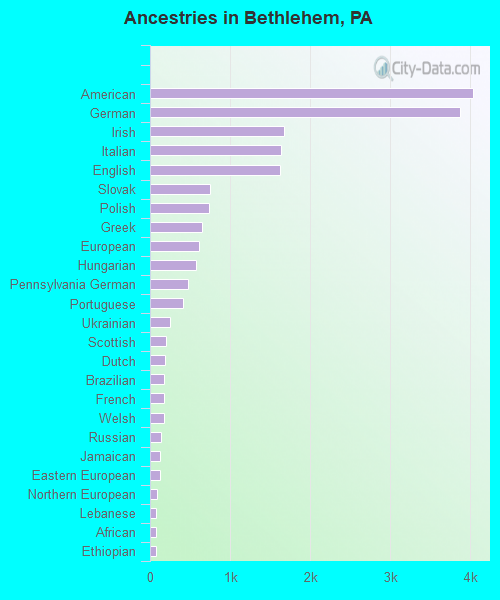
Ancestries in Bethlehem
4,033 10.4% American3,867 9.9% German1,669 4.3% Irish1,635 4.2% Italian1,629 4.2% English745 1.9% Slovak736 1.9% Polish651 1.7% Greek611 1.6% European573 1.5% Hungarian471 1.2% Pennsylvania German407 1.0% Portuguese254 0.7% Ukrainian197 0.5% Scottish191 0.5% Dutch174 0.4% Brazilian171 0.4% French169 0.4% Welsh136 0.3% Russian128 0.3% Jamaican121 0.3% Eastern European82 0.2% Northern European78 0.2% Lebanese75 0.2% African72 0.2% Ethiopian71 0.2% West Indian63 0.2% Serbian56 0.1% Lithuanian52 0.1% Czechoslovakian48 0.1% Scotch-Irish48 0.1% Arab47 0.1% Haitian47 0.1% Croatian32 0.08% Canadian31 0.08% Egyptian31 0.08% Finnish31 0.08% Turkish30 0.08% Trinidadian and Tobagonian29 0.07% Slovene28 0.07% Yugoslavian28 0.07% British27 0.07% Ugandan27 0.07% French Canadian24 0.06% Norwegian24 0.06% Austrian22 0.06% Slavic21 0.05% Scandinavian20 0.05% Syrian20 0.05% Iranian19 0.05% Liberian19 0.05% Luxembourger18 0.05% Swedish17 0.04% Bulgarian15 0.04% Albanian14 0.04% Nigerian12 0.03% Belgian11 0.03% Israeli10 0.03% Alsatian7 0.02% Swiss7 0.02% Afghan7 0.02% Bermudan4 0.01% U.S. Virgin Islander
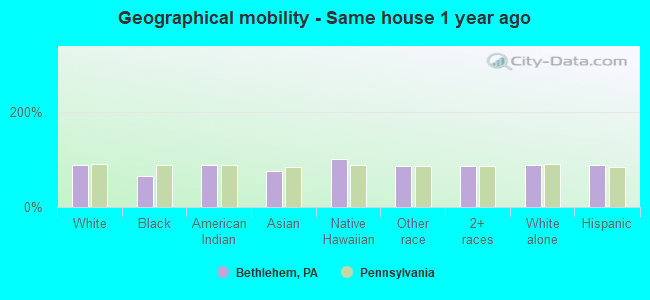
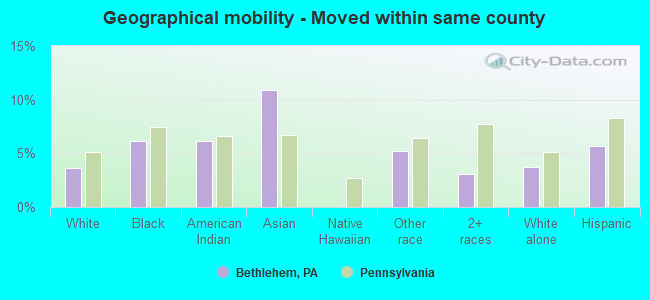
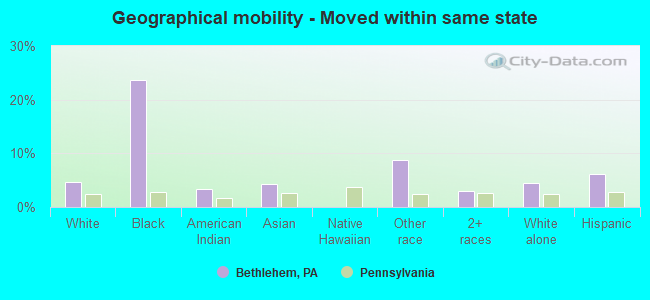
Geographical mobility in Bethlehem Same house 1 year ago 43,043 88.0% White (Caucasian)5,227 66.4% Black or African American227 87.9% American Indian / Alaska Native1,904 75.6% Asian19 100.0% Native Hawaiian / Pacific Islander9,910 85.3% Other race9,932 86.4% Two or more races38,920 88.7% White alone, not Hispanic / Latino21,172 87.1% Hispanic or LatinoMoved within same county 1,785 3.6% White / Caucasian485 6.2% Black or African American16 6.1% American Indian / Alaska Native273 10.9% Asian611 5.3% Other race359 3.1% Two or more races1,631 3.7% White alone, not Hispanic / Latino1,390 5.7% Hispanic or LatinoMoved within same state 2,309 4.7% White / Caucasian1,861 23.7% Black or African American9 3.4% American Indian / Alaska Native106 4.2% Asian1,021 8.8% Other race343 3.0% Two or more races1,965 4.5% White alone, not Hispanic / Latino1,506 6.2% Hispanic or LatinoMoved from different state 1,479 3.0% White / Caucasian294 3.7% Black or African American52 2.1% Asian175 1.5% Other race426 3.7% Two or more races1,042 2.4% White alone, not Hispanic / Latino504 2.1% Hispanic or LatinoMoved from abroad 298 0.6% White269 10.7% Asian299 2.6% Other race106 0.9% Two or more races298 0.7% White alone, not Hispanic / Latino332 1.4% Hispanic or Latino
Children Nativity (place of birth) in Bethlehem
Children under 6 years - Living with two parents Both parents native 864 100.0% Native0 0.0% Foreign-bornBoth parents foreign-born 111 93.4% Native8 6.6% Foreign-bornOne native, one foreign-born parent 484 100.0% NativeChildren under 6 years - Living with one parent Native parent 2,556 100.0% NativeForeign-born parent 356 100.0% NativeChildren 6 to 17 years - Living with two parents Both parents native 1,994 96.7% Native68 3.3% Foreign-bornBoth parents foreign-born 488 69.0% Native220 31.0% Foreign-bornOne native, one foreign-born parent 1,154 98.0% Native24 2.0% Foreign-bornChildren 6 to 17 years - Living with one parent Native parent 3,950 100.0% NativeForeign-born parent 878 52.2% Native804 47.8% Foreign-born
Grandparents responsible for own grandchildren in Bethlehem
Grandparents (30 to 59 years) White / Caucasian 57 21.9% Responsible for grandchildren202 78.1% Not responsible for grandchildrenBlack or African American 47 64.8% Responsible for grandchildren26 35.2% Not responsible for grandchildrenOther race 16 33.8% Responsible for grandchildren31 66.2% Not responsible for grandchildrenTwo or more races 72 72.4% Responsible for grandchildren28 27.6% Not responsible for grandchildrenWhite alone, not Hispanic / Latino 50 21.0% Responsible for grandchildren188 79.0% Not responsible for grandchildrenHispanic or Latino 28 28.3% Responsible for grandchildren72 71.7% Not responsible for grandchildrenGrandparents (60 years and over) White / Caucasian 235 40.2% Responsible for grandchildren349 59.8% Not responsible for grandchildrenBlack or African American 23 56.5% Responsible for grandchildren17 43.5% Not responsible for grandchildrenOther race 37 35.1% Responsible for grandchildren68 64.9% Not responsible for grandchildrenTwo or more races 75 100.0% Responsible for grandchildrenWhite alone, not Hispanic / Latino 152 36.1% Responsible for grandchildren269 63.9% Not responsible for grandchildrenHispanic or Latino 186 58.9% Responsible for grandchildren130 41.1% Not responsible for grandchildren