Races in Bethpage, New York (NY) Detailed Stats
Data:
Races - White alone (%)
Races - White alone (% change since 2000)
Races - Black alone (%)
Races - Black alone (% change since 2000)
Races - American Indian alone (%)
Races - American Indian alone (% change since 2000)
Races - Asian alone (%)
Races - Asian alone (% change since 2000)
Races - Hispanic (%)
Races - Hispanic (% change since 2000)
Races - Native Hawaiian and Other Pacific Islander alone (%)
Races - Native Hawaiian and Other Pacific Islander alone (% change since 2000)
Races - Two or more races(%)
Races - Two or more races(% change since 2000)
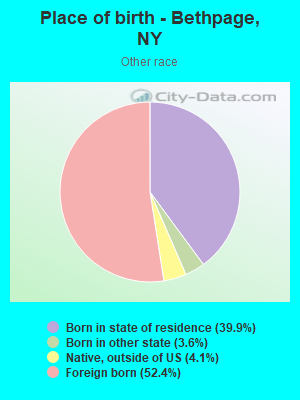
Races - Other race alone (%)
Races - Other race alone (% change since 2000)
Racial diversity
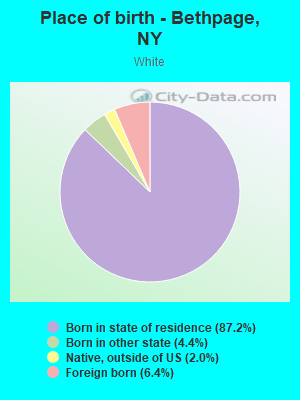
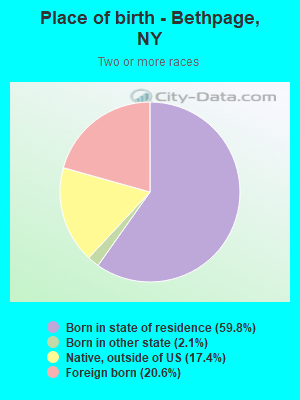
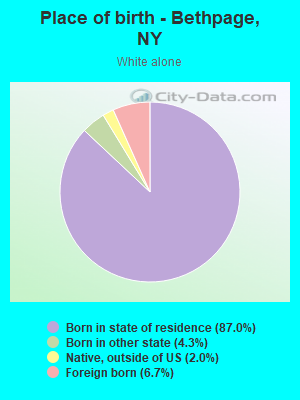
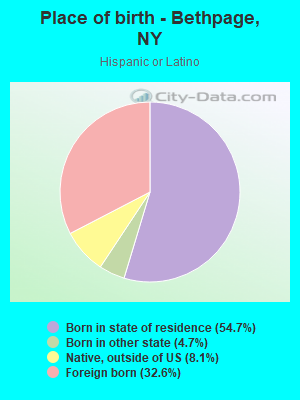
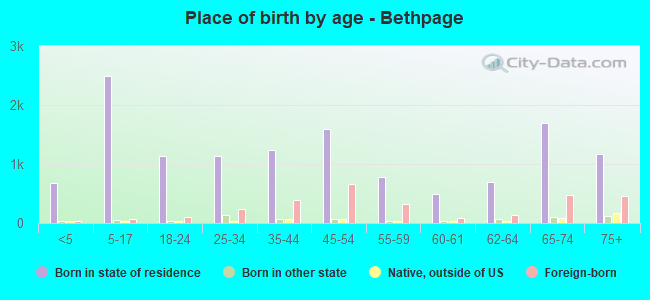
Place of birth - Born in state of residence (%)
Place of birth - Born in state of residence (%) - White
Place of birth - Born in state of residence (%) - Black or African American
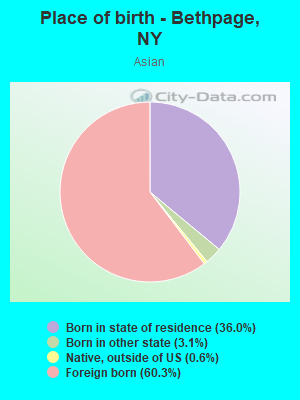
Place of birth - Born in state of residence (%) - Asian
Place of birth - Born in state of residence (%) - Hispanic or Latino
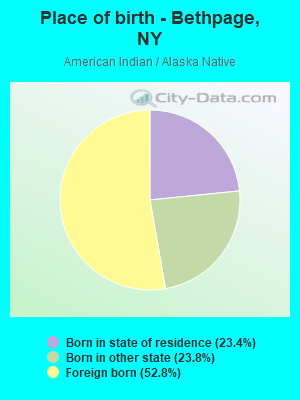
Place of birth - Born in state of residence (%) - American Indian and Alaska Native
Place of birth - Born in state of residence (%) - Multirace
Place of birth - Born in state of residence (%) - Other Race
Place of birth - Born in other state (%)
Place of birth - Born in other state (%) - White
Place of birth - Born in other state (%) - Black or African American
Place of birth - Born in other state (%) - Asian
Place of birth - Born in other state (%) - Hispanic or Latino
Place of birth - Born in other state (%) - American Indian and Alaska Native
Place of birth - Born in other state (%) - Multirace
Place of birth - Born in other state (%) - Other Race
Place of birth - Native, outside of US (%)
Place of birth - Native, outside of US (%) - White
Place of birth - Native, outside of US (%) - Black or African American
Place of birth - Native, outside of US (%) - Asian
Place of birth - Native, outside of US (%) - Hispanic or Latino
Place of birth - Native, outside of US (%) - American Indian and Alaska Native
Place of birth - Native, outside of US (%) - Multirace
Place of birth - Native, outside of US (%) - Other Race
Place of birth - Foreign born (%)
Place of birth - Foreign born (%) - White
Place of birth - Foreign born (%) - Black or African American
Place of birth - Foreign born (%) - Asian
Place of birth - Foreign born (%) - Hispanic or Latino
Place of birth - Foreign born (%) - American Indian and Alaska Native
Place of birth - Foreign born (%) - Multirace
Place of birth - Foreign born (%) - Other Race
Residents speaking English at home (%)
Residents speaking English at home - Born in the United States (%)
Residents speaking English at home - Native, born elsewhere (%)
Residents speaking English at home - Foreign born (%)
Residents speaking Spanish at home (%)
Residents speaking Spanish at home - Born in the United States (%)
Residents speaking Spanish at home - Native, born elsewhere (%)
Residents speaking Spanish at home - Foreign born (%)
Residents speaking other language at home (%)
Residents speaking other language at home - Born in the United States (%)
Residents speaking other language at home - Native, born elsewhere (%)
Residents speaking other language at home - Foreign born (%)
Marital status - Never married (%)
Marital status - Now married (%)
Marital status - Separated (%)
Marital status - Widowed (%)
Marital status - Divorced (%)
Ancestries Reported - Arab (%)
Ancestries Reported - Czech (%)
Ancestries Reported - Danish (%)
Ancestries Reported - Dutch (%)
Ancestries Reported - English (%)
Ancestries Reported - French (%)
Ancestries Reported - French Canadian (%)
Ancestries Reported - German (%)
Ancestries Reported - Greek (%)
Ancestries Reported - Hungarian (%)
Ancestries Reported - Irish (%)
Ancestries Reported - Italian (%)
Ancestries Reported - Lithuanian (%)
Ancestries Reported - Norwegian (%)
Ancestries Reported - Polish (%)
Ancestries Reported - Portuguese (%)
Ancestries Reported - Russian (%)
Ancestries Reported - Scotch-Irish (%)
Ancestries Reported - Scottish (%)
Ancestries Reported - Slovak (%)
Ancestries Reported - Subsaharan African (%)
Ancestries Reported - Swedish (%)
Ancestries Reported - Swiss (%)
Ancestries Reported - Ukrainian (%)
Ancestries Reported - United States (%)
Ancestries Reported - Welsh (%)
Ancestries Reported - West Indian (%)
Ancestries Reported - Other (%)
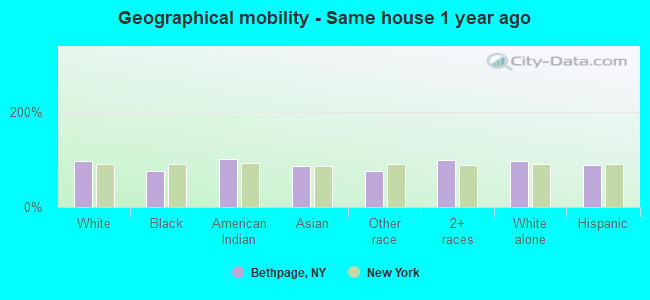
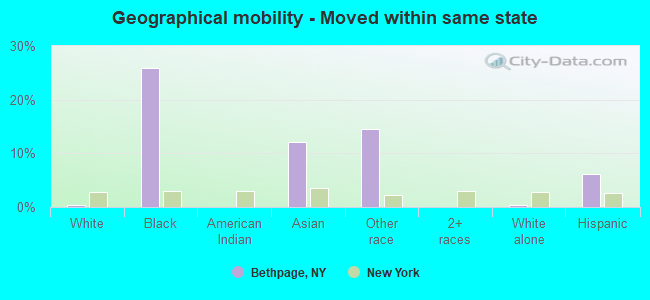
Geographical mobility - Same house 1 year ago (%)
Geographical mobility - Same house 1 year ago (%) - White
Geographical mobility - Same house 1 year ago (%) - Black or African American
Geographical mobility - Same house 1 year ago (%) - Asian
Geographical mobility - Same house 1 year ago (%) - Hispanic or Latino
Geographical mobility - Same house 1 year ago (%) - American Indian and Alaska Native
Geographical mobility - Same house 1 year ago (%) - Multirace
Geographical mobility - Same house 1 year ago (%) - Other Race
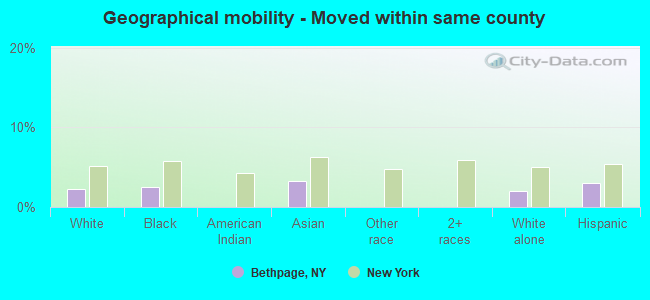
Geographical mobility - Moved within same county (%)
Geographical mobility - Moved within same county (%) - White
Geographical mobility - Moved within same county (%) - Black or African American
Geographical mobility - Moved within same county (%) - Asian
Geographical mobility - Moved within same county (%) - Hispanic or Latino
Geographical mobility - Moved within same county (%) - American Indian and Alaska Native
Geographical mobility - Moved within same county (%) - Multirace
Geographical mobility - Moved within same county (%) - Other Race
Geographical mobility - Moved from different county within same state (%)
Geographical mobility - Moved from different county within same state (%) - White
Geographical mobility - Moved from different county within same state (%) - Black or African American
Geographical mobility - Moved from different county within same state (%) - Asian
Geographical mobility - Moved from different county within same state (%) - Hispanic or Latino
Geographical mobility - Moved from different county within same state (%) - American Indian and Alaska Native
Geographical mobility - Moved from different county within same state (%) - Multirace
Geographical mobility - Moved from different county within same state (%) - Other Race
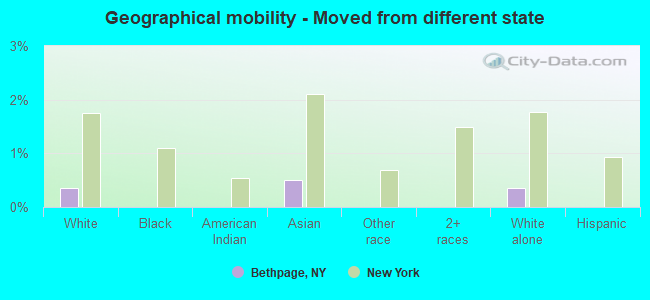
Geographical mobility - Moved from different state (%)
Geographical mobility - Moved from different state (%) - White
Geographical mobility - Moved from different state (%) - Black or African American
Geographical mobility - Moved from different state (%) - Asian
Geographical mobility - Moved from different state (%) - Hispanic or Latino
Geographical mobility - Moved from different state (%) - American Indian and Alaska Native
Geographical mobility - Moved from different state (%) - Multirace
Geographical mobility - Moved from different state (%) - Other Race
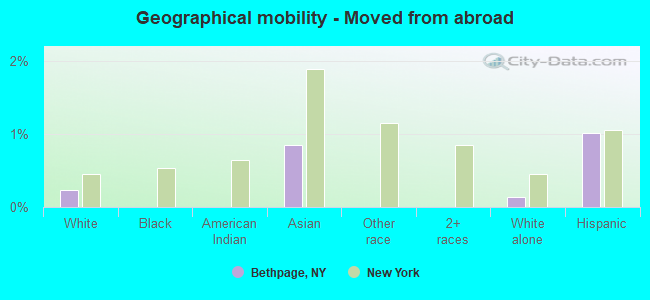
Geographical mobility - Moved from abroad (%)
Geographical mobility - Moved from abroad (%) - White
Geographical mobility - Moved from abroad (%) - Black or African American
Geographical mobility - Moved from abroad (%) - Asian
Geographical mobility - Moved from abroad (%) - Hispanic or Latino
Geographical mobility - Moved from abroad (%) - American Indian and Alaska Native
Geographical mobility - Moved from abroad (%) - Multirace
Geographical mobility - Moved from abroad (%) - Other Race
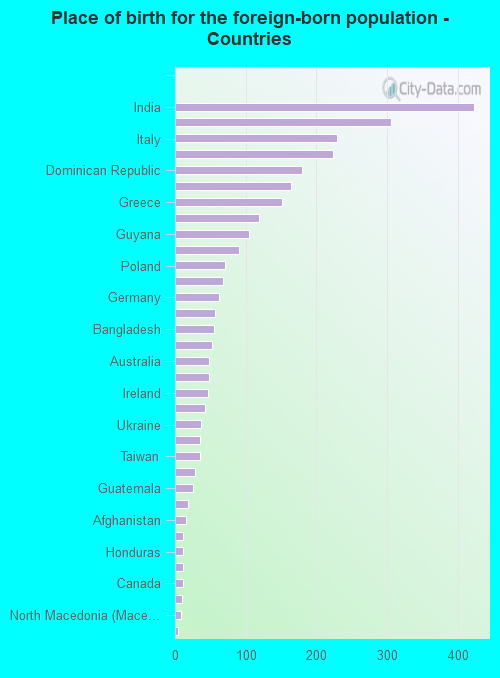
Place of birth for the foreign-born population - Ireland (%)
Place of birth for the foreign-born population - Denmark (%)
Place of birth for the foreign-born population - Norway (%)
Place of birth for the foreign-born population - Sweden (%)
Place of birth for the foreign-born population - United Kingdom (%)
Place of birth for the foreign-born population - England (%)
Place of birth for the foreign-born population - Scotland (%)
Place of birth for the foreign-born population - Other Northern Europe (%)
Place of birth for the foreign-born population - Austria (%)
Place of birth for the foreign-born population - Belgium (%)
Place of birth for the foreign-born population - France (%)
Place of birth for the foreign-born population - Germany (%)
Place of birth for the foreign-born population - Netherlands (%)
Place of birth for the foreign-born population - Switzerland (%)
Place of birth for the foreign-born population - Other Western Europe (%)
Place of birth for the foreign-born population - Greece (%)
Place of birth for the foreign-born population - Italy (%)
Place of birth for the foreign-born population - Portugal (%)
Place of birth for the foreign-born population - Spain (%)
Place of birth for the foreign-born population - Other Southern Europe (%)
Place of birth for the foreign-born population - Albania (%)
Place of birth for the foreign-born population - Belarus (%)
Place of birth for the foreign-born population - Bosnia and Herzegovina (%)
Place of birth for the foreign-born population - Bulgaria (%)
Place of birth for the foreign-born population - Croatia (%)
Place of birth for the foreign-born population - Czechoslovakia (%)
Place of birth for the foreign-born population - Hungary (%)
Place of birth for the foreign-born population - Latvia (%)
Place of birth for the foreign-born population - Lithuania (%)
Place of birth for the foreign-born population - North Macedonia (Macedonia) (%)
Place of birth for the foreign-born population - Moldova (%)
Place of birth for the foreign-born population - Poland (%)
Place of birth for the foreign-born population - Romania (%)
Place of birth for the foreign-born population - Russia (%)
Place of birth for the foreign-born population - Serbia (%)
Place of birth for the foreign-born population - Ukraine (%)
Place of birth for the foreign-born population - Other Eastern Europe (%)
Place of birth for the foreign-born population - China (%)
Place of birth for the foreign-born population - Hong Kong (%)
Place of birth for the foreign-born population - Taiwan (%)
Place of birth for the foreign-born population - Japan (%)
Place of birth for the foreign-born population - Korea (%)
Place of birth for the foreign-born population - Other Eastern Asia (%)
Place of birth for the foreign-born population - Afghanistan (%)
Place of birth for the foreign-born population - Bangladesh (%)
Place of birth for the foreign-born population - India (%)
Place of birth for the foreign-born population - Iran (%)
Place of birth for the foreign-born population - Kazakhstan (%)
Place of birth for the foreign-born population - Nepal (%)
Place of birth for the foreign-born population - Pakistan (%)
Place of birth for the foreign-born population - Sri Lanka (%)
Place of birth for the foreign-born population - Uzbekistan (%)
Place of birth for the foreign-born population - Other South Central Asia (%)
Place of birth for the foreign-born population - Burma (%)
Place of birth for the foreign-born population - Cambodia (%)
Place of birth for the foreign-born population - Indonesia (%)
Place of birth for the foreign-born population - Laos (%)
Place of birth for the foreign-born population - Malaysia (%)
Place of birth for the foreign-born population - Philippines (%)
Place of birth for the foreign-born population - Singapore (%)
Place of birth for the foreign-born population - Thailand (%)
Place of birth for the foreign-born population - Vietnam (%)
Place of birth for the foreign-born population - Other South Eastern Asia (%)
Place of birth for the foreign-born population - Armenia (%)
Place of birth for the foreign-born population - Iraq (%)
Place of birth for the foreign-born population - Israel (%)
Place of birth for the foreign-born population - Jordan (%)
Place of birth for the foreign-born population - Kuwait (%)
Place of birth for the foreign-born population - Lebanon (%)
Place of birth for the foreign-born population - Saudi Arabia (%)
Place of birth for the foreign-born population - Syria (%)
Place of birth for the foreign-born population - Turkey (%)
Place of birth for the foreign-born population - Yemen (%)
Place of birth for the foreign-born population - Other Western Asia (%)
Place of birth for the foreign-born population - Eritrea (%)
Place of birth for the foreign-born population - Ethiopia (%)
Place of birth for the foreign-born population - Kenya (%)
Place of birth for the foreign-born population - Somalia (%)
Place of birth for the foreign-born population - Uganda (%)
Place of birth for the foreign-born population - Zimbabwe (%)
Place of birth for the foreign-born population - Other Eastern Africa (%)
Place of birth for the foreign-born population - Cameroon (%)
Place of birth for the foreign-born population - Congo (%)
Place of birth for the foreign-born population - Democratic Republic of Congo (Zaire) (%)
Place of birth for the foreign-born population - Other Middle Africa (%)
Place of birth for the foreign-born population - Egypt (%)
Place of birth for the foreign-born population - Morocco (%)
Place of birth for the foreign-born population - Sudan (%)
Place of birth for the foreign-born population - Other Northern Africa (%)
Place of birth for the foreign-born population - South Africa (%)
Place of birth for the foreign-born population - Other Southern Africa (%)
Place of birth for the foreign-born population - Cabo Verde (%)
Place of birth for the foreign-born population - Ghana (%)
Place of birth for the foreign-born population - Liberia (%)
Place of birth for the foreign-born population - Nigeria (%)
Place of birth for the foreign-born population - Senegal (%)
Place of birth for the foreign-born population - Sierra Leone (%)
Place of birth for the foreign-born population - Other Western Africa (%)
Place of birth for the foreign-born population - Australia (%)
Place of birth for the foreign-born population - New Zealand (%)
Place of birth for the foreign-born population - Fiji (%)
Place of birth for the foreign-born population - Micronesia (%)
Place of birth for the foreign-born population - Bahamas (%)
Place of birth for the foreign-born population - Barbados (%)
Place of birth for the foreign-born population - Cuba (%)
Place of birth for the foreign-born population - Dominica (%)
Place of birth for the foreign-born population - Dominican Republic (%)
Place of birth for the foreign-born population - Grenada (%)
Place of birth for the foreign-born population - Haiti (%)
Place of birth for the foreign-born population - Jamaica (%)
Place of birth for the foreign-born population - St. Vincent and the Grenadines (%)
Place of birth for the foreign-born population - Trinidad and Tobago (%)
Place of birth for the foreign-born population - West Indies (%)
Place of birth for the foreign-born population - Other Caribbean (%)
Place of birth for the foreign-born population - Belize (%)
Place of birth for the foreign-born population - Costa Rica (%)
Place of birth for the foreign-born population - El Salvador (%)
Place of birth for the foreign-born population - Guatemala (%)
Place of birth for the foreign-born population - Honduras (%)
Place of birth for the foreign-born population - Mexico (%)
Place of birth for the foreign-born population - Nicaragua (%)
Place of birth for the foreign-born population - Panama (%)
Place of birth for the foreign-born population - Other Central America (%)
Place of birth for the foreign-born population - Argentina (%)
Place of birth for the foreign-born population - Bolivia (%)
Place of birth for the foreign-born population - Brazil (%)
Place of birth for the foreign-born population - Chile (%)
Place of birth for the foreign-born population - Colombia (%)
Place of birth for the foreign-born population - Ecuador (%)
Place of birth for the foreign-born population - Guyana (%)
Place of birth for the foreign-born population - Peru (%)
Place of birth for the foreign-born population - Uruguay (%)
Place of birth for the foreign-born population - Venezuela (%)
Place of birth for the foreign-born population - Other South America (%)
Place of birth for the foreign-born population - Canada (%)
Place of birth for the foreign-born population - Other Northern America (%)
Place of birth for the foreign-born population - Other (%)
Latest news about races in Bethpage, NY collected exclusively by city-data.com from local newspapers, TV, and radio stations
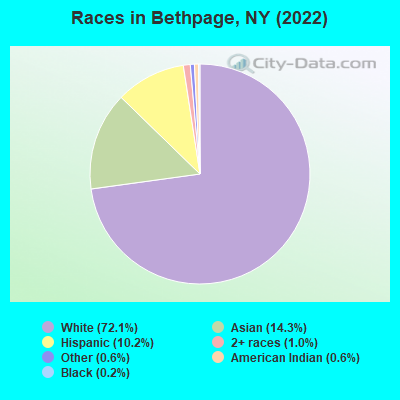
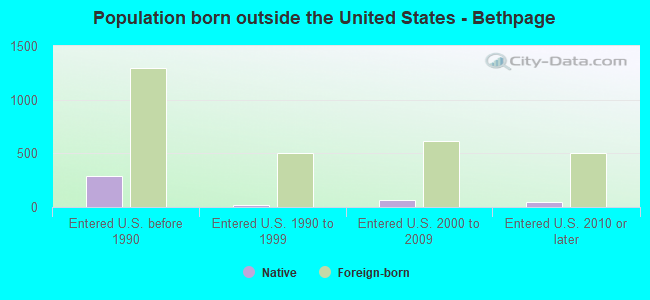
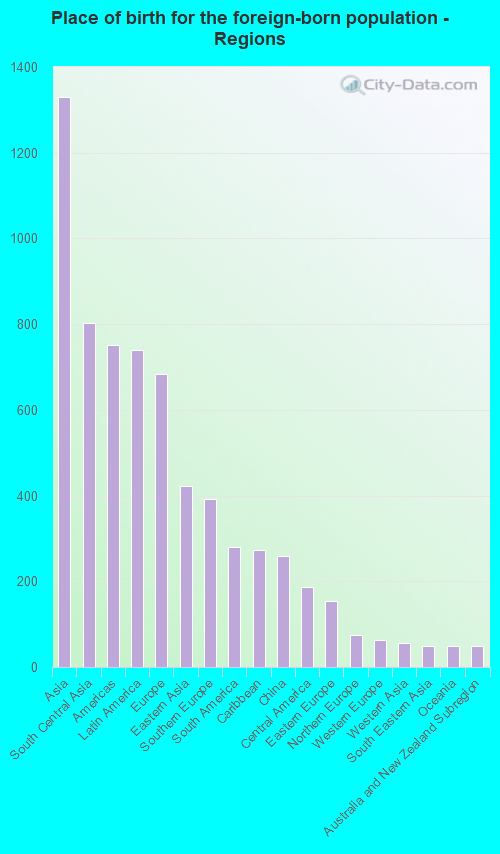
According to 2022 data, the most numerous races in Bethpage, NY are White alone (12,403 residents), Hispanic (1,751 residents), and Black alone (39 residents). 75.6% of Bethpage residents speak English at home. 16.4% of Bethpage, NY residents are foreign-born (7.8% born in Asia, 4.3% born in Latin America, 4.0% born in Europe), which is 33.9% less than the foreign-born rate of 22.0% across the entire state of New York.
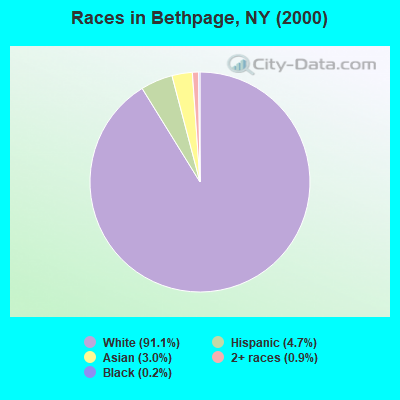
Race distribution in Bethpage
2000 2022
11,760,981 62.0% White alone 2,867,583 15.1% Hispanic 2,812,623 14.8% Black alone 1,035,926 5.5% Asian alone 366,116 1.9% Two or more races 75,499 0.4% Other race alone 52,499 0.3% American Indian alone 5,230 0.03% Native Hawaiian and Other
10,408,933 52.9% White alone 3,867,299 19.7% Hispanic 2,633,840 13.4% Black alone 1,776,286 9.0% Asian alone 732,670 3.7% Two or more races 216,110 1.1% Other race alone 35,082 0.2% American Indian alone 6,931 0.04% Native Hawaiian and Other
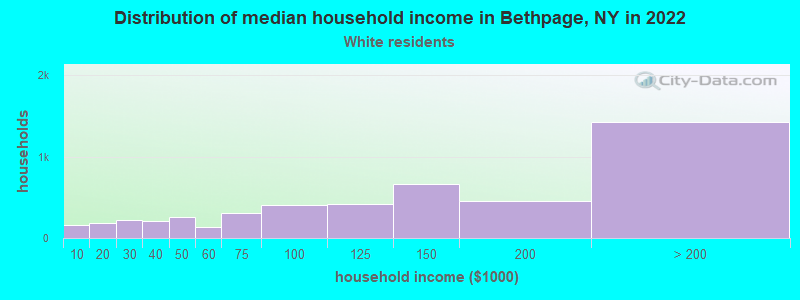
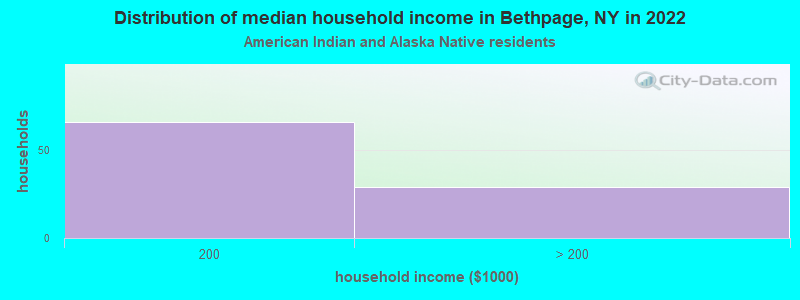
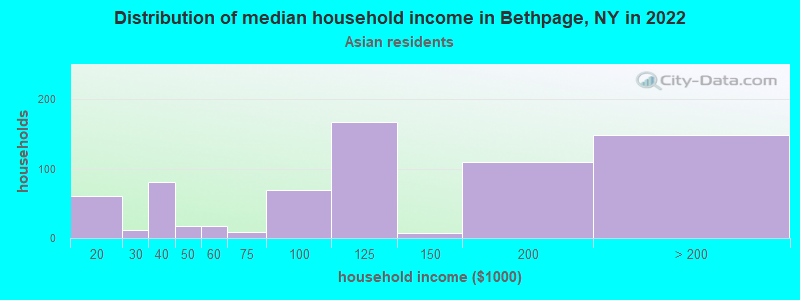
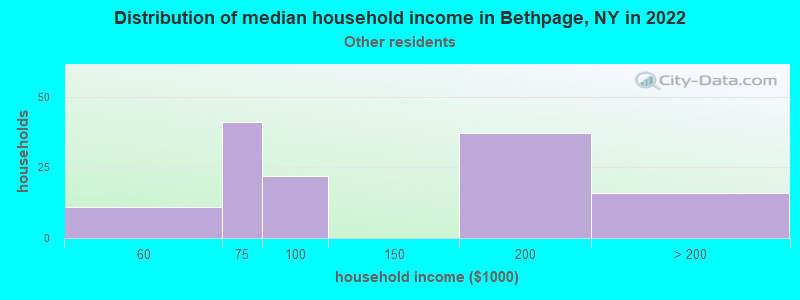
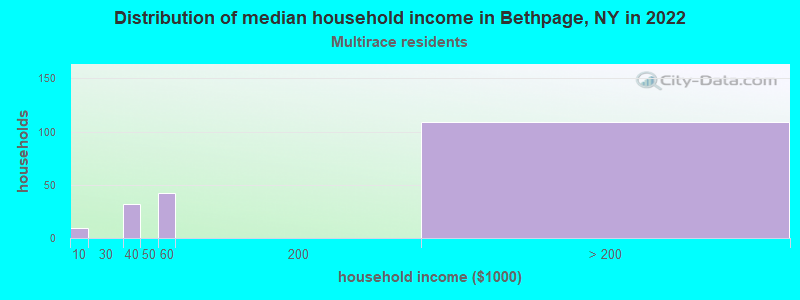
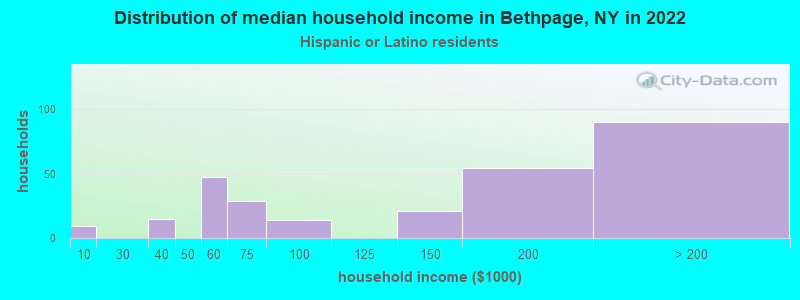
Income and house value in Bethpage Median household income in 2022 $124,282 White non-Hispanic householders$110,707 Asian householdersover $200,000 Two or more races householders$152,520 Hispanic or Latino race householdersMedian 2022 house value $605,531 White Non-Hispanic householders $626,366 Asian householders$631,113 Two or more races householders$617,399 Hispanic or Latino householders
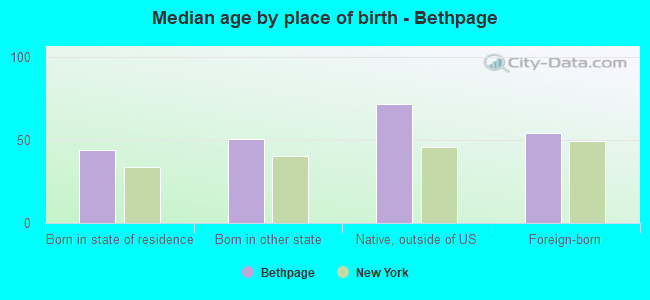
Median age by race in Bethpage
51.7 Median age for White residents51.8 51.9 36.3 Median age for Black or African American residents-666,666,666.0 51.4 67.7 Median age for American Indian / Alaska Native residents-607,543,322.5 66.0 35.6 Median age for Asian residents29.5 40.9 -487,992,314.6 Median age for Native Hawaiian / Pacific Islander residents-477,502,295.2 -497,387,669.3 35.8 Median age for Other race residents43.1 33.9 38.5 Median age for Two or more races residents36.6 49.1 52.5 Median age for White alone residents52.7 52.1 37.3 Median age for Hispanic or Latino residents33.6 37.7
Owner/renter occupied households by race in Bethpage
House owners and renters - White residents 4,515 94.5% Owner occupied265 5.5% Renter occupiedHouse owners and renters - American Indian / Alaska Native residents 93 100.0% Owner occupiedHouse owners and renters - Asian residents 618 92.8% Owner occupied48 7.2% Renter occupiedHouse owners and renters - Other race residents 95 72.9% Owner occupied35 27.1% Renter occupiedHouse owners and renters - Two or more races residents 150 79.1% Owner occupied40 20.9% Renter occupiedHouse owners and renters - White alone residents 4,565 94.3% Owner occupied276 5.7% Renter occupiedHouse owners and renters - Hispanic or Latino residents 231 76.3% Owner occupied72 23.7% Renter occupied
Language usage in Bethpage
English speakers - Total 75.6% of residents of Bethpage speak English at home.
5.2% of residents speak Spanish at home 684 79.1% Speak English very well181 20.9% Speak English less than very well19.1% of residents speak other language at home 2,185 69.1% Speak English very well976 30.9% Speak English less than very well
English speakers - Born in the United States 79.6% of residents of Bethpage speak English at home.
13.2% of residents speak Spanish at home 95 100.0% Speak English very well9.8% of residents speak other language at home 71 100.0% Speak English very well
English speakers - Native, born elsewhere 32.4% of residents of Bethpage speak English at home.
23.6% of residents speak Spanish at home 92 97.9% Speak English very well2 2.1% Speak English less than very well45.0% of residents speak other language at home 167 93.3% Speak English very well12 6.7% Speak English less than very well
English speakers - Foreign-born 14.7% of residents of Bethpage speak English at home.
17.1% of residents speak Spanish at home 319 63.9% Speak English very well180 36.1% Speak English less than very well69.7% of residents speak other language at home 1,142 56.1% Speak English very well894 43.9% Speak English less than very well
White (Caucasian) - Speak only English Native:
96.3% (10,928)Foreign-born:
26.5% (213)
White (Caucasian) - Speak another language Native:
4.3% (487)Foreign-born:
72.9% (587)
American Indian / Alaska Native - Speak only English Native:
48.8% (58)Foreign-born:
65.9% (68)
Asian - Speak only English Native:
33.7% (278)Foreign-born:
4.8% (71)
Asian - Speak another language Native:
65.2% (536)Foreign-born:
97.1% (1,447)
Other race - Speak only English Native:
73.7% (121)Foreign-born:
9.2% (29)
Other race - Speak another language Native:
31.5% (52)Foreign-born:
90.2% (281)
Two or more races - Speak only English Native:
60.2% (411)Foreign-born:
9.5% (18)
Two or more races - Speak another language Native:
41.2% (281)Foreign-born:
91.9% (173)
White alone - Speak only English Native:
95.4% (10,667)Foreign-born:
24.8% (206)
White alone - Speak another language Native:
4.7% (526)Foreign-born:
75.4% (625)
Hispanic or Latino - Speak only English Native:
66.8% (687)Foreign-born:
7.2% (42)
Hispanic or Latino - Speak another language Native:
32.8% (337)Foreign-born:
92.8% (537)
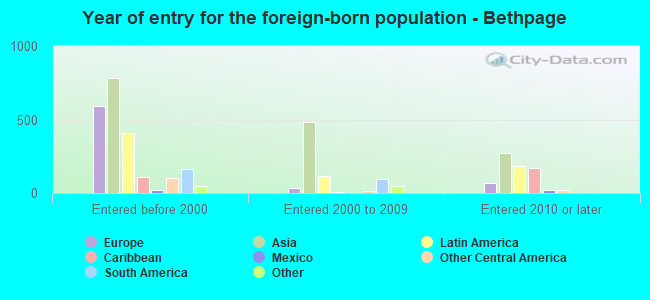
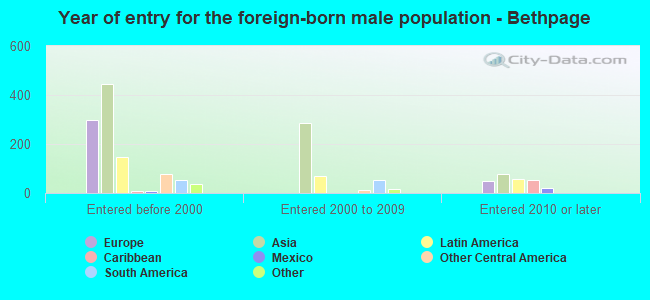
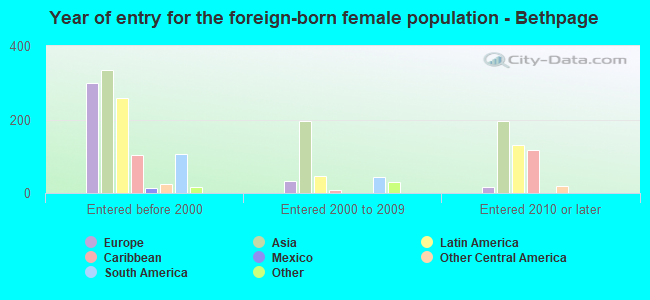
Foreign-born residents in Bethpage 2,828 residents are foreign born (7.8% Asia , 4.3% Latin America , 4.0% Europe ).
This city:
16.4%New York:
22.6%
Marital status for residents in Bethpage Marital status - White (Caucasian) population 15 years and over
Males 23.2% Never married66.7% Now married0.5% Separated2.5% Widowed7.1% DivorcedFemales 24.1% Never married56.2% Now married0.0% Separated13.7% Widowed5.9% DivorcedWomen who gave birth in the past 12 months Now married:
100.0% (89)Unmarried:
0.0% (0)
Women who did not give birth in the past 12 months Now married:
46.8% (1,041)Unmarried:
53.2% (1,182)
Marital status - Black or African American population 15 years and over
Males 100.0% Never married0.0% Now married0.0% Separated0.0% Widowed0.0% DivorcedFemales 60.6% Never married0.0% Now married39.4% Separated0.0% Widowed0.0% DivorcedWomen who did not give birth in the past 12 months Now married:
68.4% (12)Unmarried:
31.6% (6)
Marital status - American Indian / Alaska Native population 15 years and over
Males 38.7% Never married61.3% Now married0.0% Separated0.0% Widowed0.0% DivorcedFemales 0.0% Never married78.3% Now married21.7% Separated0.0% Widowed0.0% DivorcedWomen who did not give birth in the past 12 months Now married:
100.0% (33)Unmarried:
0.0% (0)
Marital status - Asian population 15 years and over
Males 40.9% Never married54.2% Now married0.0% Separated1.0% Widowed3.9% DivorcedFemales 8.6% Never married66.1% Now married0.0% Separated4.6% Widowed20.8% DivorcedWomen who gave birth in the past 12 months Now married:
100.0% (15)Unmarried:
0.0% (0)
Women who did not give birth in the past 12 months Now married:
59.1% (334)Unmarried:
40.9% (231)
Marital status - Other race population 15 years and over
Males 14.9% Never married77.0% Now married0.0% Separated8.1% Widowed0.0% DivorcedFemales 8.2% Never married91.8% Now married0.0% Separated0.0% Widowed0.0% DivorcedWomen who gave birth in the past 12 months Now married:
75.0% (20)Unmarried:
25.0% (7)
Women who did not give birth in the past 12 months Now married:
91.2% (94)Unmarried:
8.8% (9)
Marital status - Two or more races population 15 years and over
Males 20.1% Never married57.7% Now married0.0% Separated4.6% Widowed17.5% DivorcedFemales 26.7% Never married53.4% Now married0.0% Separated9.2% Widowed10.7% DivorcedWomen who did not give birth in the past 12 months Now married:
51.3% (121)Unmarried:
48.7% (115)
Marital status - White alone, not Hispanic / Latino population 15 years and over
Males 22.8% Never married66.4% Now married0.5% Separated2.7% Widowed7.6% DivorcedFemales 23.7% Never married56.1% Now married0.0% Separated14.1% Widowed6.1% DivorcedWomen who gave birth in the past 12 months Now married:
100.0% (95)Unmarried:
0.0% (0)
Women who did not give birth in the past 12 months Now married:
46.8% (1,047)Unmarried:
53.2% (1,188)
Marital status - Hispanic or Latino population 15 years and over
Males 24.9% Never married66.4% Now married0.0% Separated3.4% Widowed5.3% DivorcedFemales 22.4% Never married62.6% Now married3.6% Separated5.8% Widowed5.5% DivorcedWomen who gave birth in the past 12 months Now married:
64.7% (11)Unmarried:
35.3% (6)
Women who did not give birth in the past 12 months Now married:
62.2% (182)Unmarried:
37.8% (110)
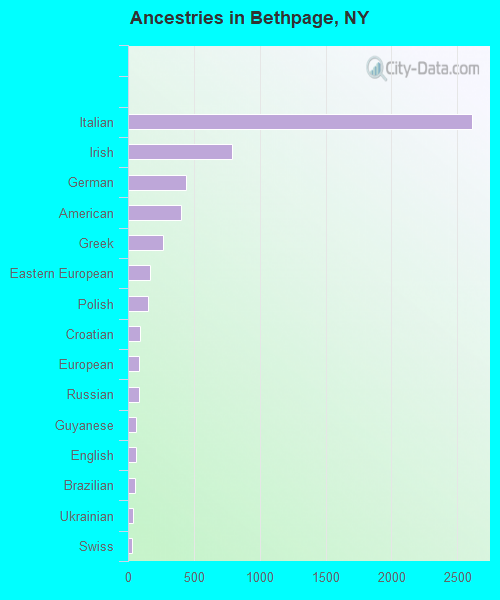
Ancestries in Bethpage
2,611 32.5% Italian789 9.8% Irish437 5.4% German400 5.0% American269 3.3% Greek169 2.1% Eastern European150 1.9% Polish90 1.1% Croatian84 1.0% European81 1.0% Russian64 0.8% Guyanese62 0.8% English55 0.7% Brazilian39 0.5% Ukrainian27 0.3% Swiss18 0.2% Armenian18 0.2% Scotch-Irish17 0.2% Afghan17 0.2% Scottish15 0.2% Hungarian9 0.1% Macedonian8 0.10% Serbian8 0.10% Swedish7 0.09% Egyptian7 0.09% Cypriot7 0.09% Dutch7 0.09% Portuguese6 0.07% Czech5 0.06% French
Children Nativity (place of birth) in Bethpage
Children under 6 years - Living with two parents Both parents native 539 100.0% NativeBoth parents foreign-born 191 100.0% NativeOne native, one foreign-born parent 86 100.0% NativeChildren under 6 years - Living with one parent Native parent 65 100.0% NativeChildren 6 to 17 years - Living with two parents Both parents native 1,505 100.0% NativeBoth parents foreign-born 282 82.6% Native59 17.4% Foreign-bornOne native, one foreign-born parent 163 100.0% NativeChildren 6 to 17 years - Living with one parent Native parent 229 100.0% NativeForeign-born parent 123 47.2% Native138 52.8% Foreign-born
Grandparents responsible for own grandchildren in Bethpage
Grandparents (30 to 59 years) White / Caucasian 31 41.2% Responsible for grandchildren43 58.8% Not responsible for grandchildrenAmerican Indian / Alaska Native 40 100.0% Responsible for grandchildrenOther race 25 100.0% Not responsible for grandchildrenWhite alone, not Hispanic / Latino 33 54.2% Responsible for grandchildren27 45.8% Not responsible for grandchildrenHispanic or Latino 25 59.6% Responsible for grandchildren17 40.4% Not responsible for grandchildrenGrandparents (60 years and over) White / Caucasian 19 7.7% Responsible for grandchildren224 92.3% Not responsible for grandchildrenOther race 21 100.0% Responsible for grandchildrenWhite alone, not Hispanic / Latino 18 7.1% Responsible for grandchildren229 92.9% Not responsible for grandchildrenHispanic or Latino 35 81.3% Responsible for grandchildren8 18.7% Not responsible for grandchildren