Races in Bettendorf, Iowa (IA) Detailed Stats
Data:
Races - White alone (%)
Races - White alone (% change since 2000)
Races - Black alone (%)
Races - Black alone (% change since 2000)
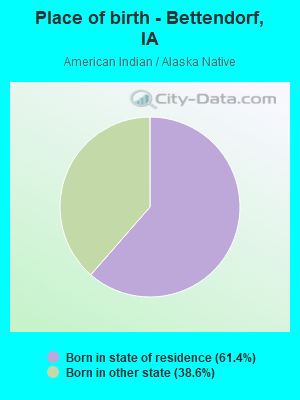
Races - American Indian alone (%)
Races - American Indian alone (% change since 2000)
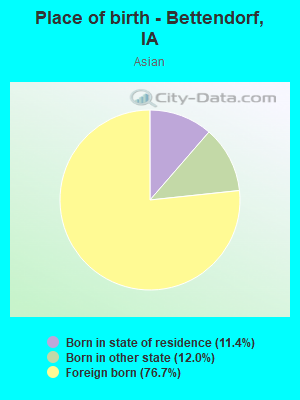
Races - Asian alone (%)
Races - Asian alone (% change since 2000)
Races - Hispanic (%)
Races - Hispanic (% change since 2000)
Races - Native Hawaiian and Other Pacific Islander alone (%)
Races - Native Hawaiian and Other Pacific Islander alone (% change since 2000)
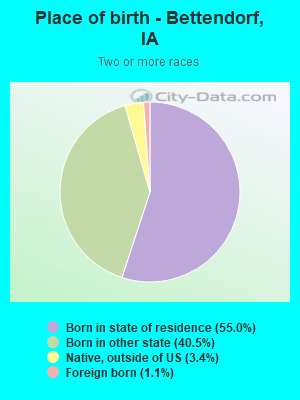
Races - Two or more races(%)
Races - Two or more races(% change since 2000)
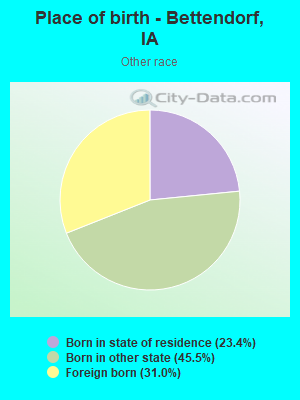
Races - Other race alone (%)
Races - Other race alone (% change since 2000)
Racial diversity
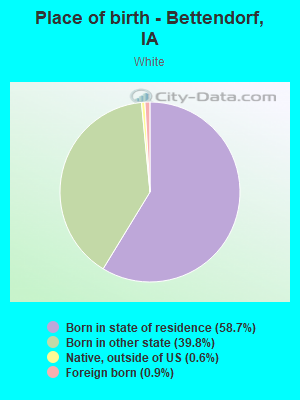
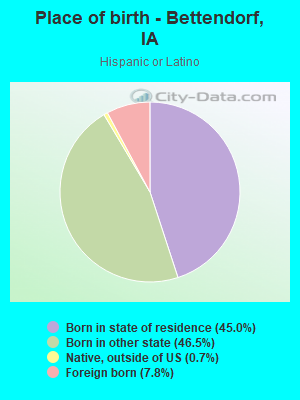
Place of birth - Born in state of residence (%)
Place of birth - Born in state of residence (%) - White
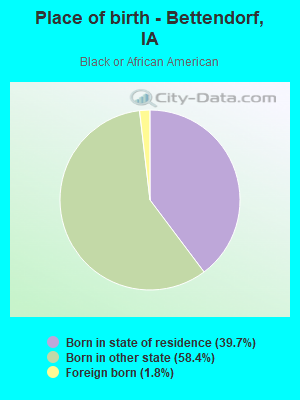
Place of birth - Born in state of residence (%) - Black or African American
Place of birth - Born in state of residence (%) - Asian
Place of birth - Born in state of residence (%) - Hispanic or Latino
Place of birth - Born in state of residence (%) - American Indian and Alaska Native
Place of birth - Born in state of residence (%) - Multirace
Place of birth - Born in state of residence (%) - Other Race
Place of birth - Born in other state (%)
Place of birth - Born in other state (%) - White
Place of birth - Born in other state (%) - Black or African American
Place of birth - Born in other state (%) - Asian
Place of birth - Born in other state (%) - Hispanic or Latino
Place of birth - Born in other state (%) - American Indian and Alaska Native
Place of birth - Born in other state (%) - Multirace
Place of birth - Born in other state (%) - Other Race
Place of birth - Native, outside of US (%)
Place of birth - Native, outside of US (%) - White
Place of birth - Native, outside of US (%) - Black or African American
Place of birth - Native, outside of US (%) - Asian
Place of birth - Native, outside of US (%) - Hispanic or Latino
Place of birth - Native, outside of US (%) - American Indian and Alaska Native
Place of birth - Native, outside of US (%) - Multirace
Place of birth - Native, outside of US (%) - Other Race
Place of birth - Foreign born (%)
Place of birth - Foreign born (%) - White
Place of birth - Foreign born (%) - Black or African American
Place of birth - Foreign born (%) - Asian
Place of birth - Foreign born (%) - Hispanic or Latino
Place of birth - Foreign born (%) - American Indian and Alaska Native
Place of birth - Foreign born (%) - Multirace
Place of birth - Foreign born (%) - Other Race
Residents speaking English at home (%)
Residents speaking English at home - Born in the United States (%)
Residents speaking English at home - Native, born elsewhere (%)
Residents speaking English at home - Foreign born (%)
Residents speaking Spanish at home (%)
Residents speaking Spanish at home - Born in the United States (%)
Residents speaking Spanish at home - Native, born elsewhere (%)
Residents speaking Spanish at home - Foreign born (%)
Residents speaking other language at home (%)
Residents speaking other language at home - Born in the United States (%)
Residents speaking other language at home - Native, born elsewhere (%)
Residents speaking other language at home - Foreign born (%)
Marital status - Never married (%)
Marital status - Now married (%)
Marital status - Separated (%)
Marital status - Widowed (%)
Marital status - Divorced (%)
Ancestries Reported - Arab (%)
Ancestries Reported - Czech (%)
Ancestries Reported - Danish (%)
Ancestries Reported - Dutch (%)
Ancestries Reported - English (%)
Ancestries Reported - French (%)
Ancestries Reported - French Canadian (%)
Ancestries Reported - German (%)
Ancestries Reported - Greek (%)
Ancestries Reported - Hungarian (%)
Ancestries Reported - Irish (%)
Ancestries Reported - Italian (%)
Ancestries Reported - Lithuanian (%)
Ancestries Reported - Norwegian (%)
Ancestries Reported - Polish (%)
Ancestries Reported - Portuguese (%)
Ancestries Reported - Russian (%)
Ancestries Reported - Scotch-Irish (%)
Ancestries Reported - Scottish (%)
Ancestries Reported - Slovak (%)
Ancestries Reported - Subsaharan African (%)
Ancestries Reported - Swedish (%)
Ancestries Reported - Swiss (%)
Ancestries Reported - Ukrainian (%)
Ancestries Reported - United States (%)
Ancestries Reported - Welsh (%)
Ancestries Reported - West Indian (%)
Ancestries Reported - Other (%)
Geographical mobility - Same house 1 year ago (%)
Geographical mobility - Same house 1 year ago (%) - White
Geographical mobility - Same house 1 year ago (%) - Black or African American
Geographical mobility - Same house 1 year ago (%) - Asian
Geographical mobility - Same house 1 year ago (%) - Hispanic or Latino
Geographical mobility - Same house 1 year ago (%) - American Indian and Alaska Native
Geographical mobility - Same house 1 year ago (%) - Multirace
Geographical mobility - Same house 1 year ago (%) - Other Race
Geographical mobility - Moved within same county (%)
Geographical mobility - Moved within same county (%) - White
Geographical mobility - Moved within same county (%) - Black or African American
Geographical mobility - Moved within same county (%) - Asian
Geographical mobility - Moved within same county (%) - Hispanic or Latino
Geographical mobility - Moved within same county (%) - American Indian and Alaska Native
Geographical mobility - Moved within same county (%) - Multirace
Geographical mobility - Moved within same county (%) - Other Race
Geographical mobility - Moved from different county within same state (%)
Geographical mobility - Moved from different county within same state (%) - White
Geographical mobility - Moved from different county within same state (%) - Black or African American
Geographical mobility - Moved from different county within same state (%) - Asian
Geographical mobility - Moved from different county within same state (%) - Hispanic or Latino
Geographical mobility - Moved from different county within same state (%) - American Indian and Alaska Native
Geographical mobility - Moved from different county within same state (%) - Multirace
Geographical mobility - Moved from different county within same state (%) - Other Race
Geographical mobility - Moved from different state (%)
Geographical mobility - Moved from different state (%) - White
Geographical mobility - Moved from different state (%) - Black or African American
Geographical mobility - Moved from different state (%) - Asian
Geographical mobility - Moved from different state (%) - Hispanic or Latino
Geographical mobility - Moved from different state (%) - American Indian and Alaska Native
Geographical mobility - Moved from different state (%) - Multirace
Geographical mobility - Moved from different state (%) - Other Race
Geographical mobility - Moved from abroad (%)
Geographical mobility - Moved from abroad (%) - White
Geographical mobility - Moved from abroad (%) - Black or African American
Geographical mobility - Moved from abroad (%) - Asian
Geographical mobility - Moved from abroad (%) - Hispanic or Latino
Geographical mobility - Moved from abroad (%) - American Indian and Alaska Native
Geographical mobility - Moved from abroad (%) - Multirace
Geographical mobility - Moved from abroad (%) - Other Race
Place of birth for the foreign-born population - Ireland (%)
Place of birth for the foreign-born population - Denmark (%)
Place of birth for the foreign-born population - Norway (%)
Place of birth for the foreign-born population - Sweden (%)
Place of birth for the foreign-born population - United Kingdom (%)
Place of birth for the foreign-born population - England (%)
Place of birth for the foreign-born population - Scotland (%)
Place of birth for the foreign-born population - Other Northern Europe (%)
Place of birth for the foreign-born population - Austria (%)
Place of birth for the foreign-born population - Belgium (%)
Place of birth for the foreign-born population - France (%)
Place of birth for the foreign-born population - Germany (%)
Place of birth for the foreign-born population - Netherlands (%)
Place of birth for the foreign-born population - Switzerland (%)
Place of birth for the foreign-born population - Other Western Europe (%)
Place of birth for the foreign-born population - Greece (%)
Place of birth for the foreign-born population - Italy (%)
Place of birth for the foreign-born population - Portugal (%)
Place of birth for the foreign-born population - Spain (%)
Place of birth for the foreign-born population - Other Southern Europe (%)
Place of birth for the foreign-born population - Albania (%)
Place of birth for the foreign-born population - Belarus (%)
Place of birth for the foreign-born population - Bosnia and Herzegovina (%)
Place of birth for the foreign-born population - Bulgaria (%)
Place of birth for the foreign-born population - Croatia (%)
Place of birth for the foreign-born population - Czechoslovakia (%)
Place of birth for the foreign-born population - Hungary (%)
Place of birth for the foreign-born population - Latvia (%)
Place of birth for the foreign-born population - Lithuania (%)
Place of birth for the foreign-born population - North Macedonia (Macedonia) (%)
Place of birth for the foreign-born population - Moldova (%)
Place of birth for the foreign-born population - Poland (%)
Place of birth for the foreign-born population - Romania (%)
Place of birth for the foreign-born population - Russia (%)
Place of birth for the foreign-born population - Serbia (%)
Place of birth for the foreign-born population - Ukraine (%)
Place of birth for the foreign-born population - Other Eastern Europe (%)
Place of birth for the foreign-born population - China (%)
Place of birth for the foreign-born population - Hong Kong (%)
Place of birth for the foreign-born population - Taiwan (%)
Place of birth for the foreign-born population - Japan (%)
Place of birth for the foreign-born population - Korea (%)
Place of birth for the foreign-born population - Other Eastern Asia (%)
Place of birth for the foreign-born population - Afghanistan (%)
Place of birth for the foreign-born population - Bangladesh (%)
Place of birth for the foreign-born population - India (%)
Place of birth for the foreign-born population - Iran (%)
Place of birth for the foreign-born population - Kazakhstan (%)
Place of birth for the foreign-born population - Nepal (%)
Place of birth for the foreign-born population - Pakistan (%)
Place of birth for the foreign-born population - Sri Lanka (%)
Place of birth for the foreign-born population - Uzbekistan (%)
Place of birth for the foreign-born population - Other South Central Asia (%)
Place of birth for the foreign-born population - Burma (%)
Place of birth for the foreign-born population - Cambodia (%)
Place of birth for the foreign-born population - Indonesia (%)
Place of birth for the foreign-born population - Laos (%)
Place of birth for the foreign-born population - Malaysia (%)
Place of birth for the foreign-born population - Philippines (%)
Place of birth for the foreign-born population - Singapore (%)
Place of birth for the foreign-born population - Thailand (%)
Place of birth for the foreign-born population - Vietnam (%)
Place of birth for the foreign-born population - Other South Eastern Asia (%)
Place of birth for the foreign-born population - Armenia (%)
Place of birth for the foreign-born population - Iraq (%)
Place of birth for the foreign-born population - Israel (%)
Place of birth for the foreign-born population - Jordan (%)
Place of birth for the foreign-born population - Kuwait (%)
Place of birth for the foreign-born population - Lebanon (%)
Place of birth for the foreign-born population - Saudi Arabia (%)
Place of birth for the foreign-born population - Syria (%)
Place of birth for the foreign-born population - Turkey (%)
Place of birth for the foreign-born population - Yemen (%)
Place of birth for the foreign-born population - Other Western Asia (%)
Place of birth for the foreign-born population - Eritrea (%)
Place of birth for the foreign-born population - Ethiopia (%)
Place of birth for the foreign-born population - Kenya (%)
Place of birth for the foreign-born population - Somalia (%)
Place of birth for the foreign-born population - Uganda (%)
Place of birth for the foreign-born population - Zimbabwe (%)
Place of birth for the foreign-born population - Other Eastern Africa (%)
Place of birth for the foreign-born population - Cameroon (%)
Place of birth for the foreign-born population - Congo (%)
Place of birth for the foreign-born population - Democratic Republic of Congo (Zaire) (%)
Place of birth for the foreign-born population - Other Middle Africa (%)
Place of birth for the foreign-born population - Egypt (%)
Place of birth for the foreign-born population - Morocco (%)
Place of birth for the foreign-born population - Sudan (%)
Place of birth for the foreign-born population - Other Northern Africa (%)
Place of birth for the foreign-born population - South Africa (%)
Place of birth for the foreign-born population - Other Southern Africa (%)
Place of birth for the foreign-born population - Cabo Verde (%)
Place of birth for the foreign-born population - Ghana (%)
Place of birth for the foreign-born population - Liberia (%)
Place of birth for the foreign-born population - Nigeria (%)
Place of birth for the foreign-born population - Senegal (%)
Place of birth for the foreign-born population - Sierra Leone (%)
Place of birth for the foreign-born population - Other Western Africa (%)
Place of birth for the foreign-born population - Australia (%)
Place of birth for the foreign-born population - New Zealand (%)
Place of birth for the foreign-born population - Fiji (%)
Place of birth for the foreign-born population - Micronesia (%)
Place of birth for the foreign-born population - Bahamas (%)
Place of birth for the foreign-born population - Barbados (%)
Place of birth for the foreign-born population - Cuba (%)
Place of birth for the foreign-born population - Dominica (%)
Place of birth for the foreign-born population - Dominican Republic (%)
Place of birth for the foreign-born population - Grenada (%)
Place of birth for the foreign-born population - Haiti (%)
Place of birth for the foreign-born population - Jamaica (%)
Place of birth for the foreign-born population - St. Vincent and the Grenadines (%)
Place of birth for the foreign-born population - Trinidad and Tobago (%)
Place of birth for the foreign-born population - West Indies (%)
Place of birth for the foreign-born population - Other Caribbean (%)
Place of birth for the foreign-born population - Belize (%)
Place of birth for the foreign-born population - Costa Rica (%)
Place of birth for the foreign-born population - El Salvador (%)
Place of birth for the foreign-born population - Guatemala (%)
Place of birth for the foreign-born population - Honduras (%)
Place of birth for the foreign-born population - Mexico (%)
Place of birth for the foreign-born population - Nicaragua (%)
Place of birth for the foreign-born population - Panama (%)
Place of birth for the foreign-born population - Other Central America (%)
Place of birth for the foreign-born population - Argentina (%)
Place of birth for the foreign-born population - Bolivia (%)
Place of birth for the foreign-born population - Brazil (%)
Place of birth for the foreign-born population - Chile (%)
Place of birth for the foreign-born population - Colombia (%)
Place of birth for the foreign-born population - Ecuador (%)
Place of birth for the foreign-born population - Guyana (%)
Place of birth for the foreign-born population - Peru (%)
Place of birth for the foreign-born population - Uruguay (%)
Place of birth for the foreign-born population - Venezuela (%)
Place of birth for the foreign-born population - Other South America (%)
Place of birth for the foreign-born population - Canada (%)
Place of birth for the foreign-born population - Other Northern America (%)
Place of birth for the foreign-born population - Other (%)
Latest news about races in Bettendorf, IA collected exclusively by city-data.com from local newspapers, TV, and radio stations
According to 2022 data, the most numerous races in Bettendorf, IA are White alone (31,799 residents), Hispanic (2,016 residents), and Black alone (689 residents). 92.1% of Bettendorf residents speak English at home. 6.5% of Bettendorf, IA residents are foreign-born (4.9% born in Asia, 0.8% born in Europe), which is 22.5% greater than the foreign-born rate of 5.0% across the entire state of Iowa.
Race distribution in Bettendorf
2000 2022
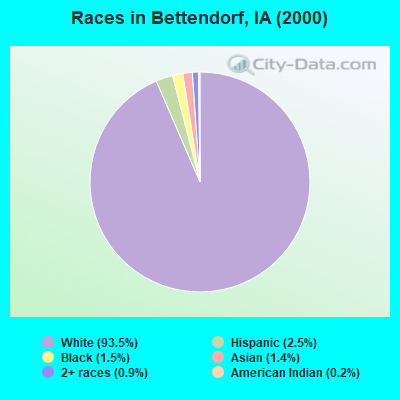
2,710,344 92.6% White alone 82,473 2.8% Hispanic 60,744 2.1% Black alone 36,345 1.2% Asian alone 25,472 0.9% Two or more races 7,955 0.3% American Indian alone 2,103 0.07% Other race alone 888 0.03% Native Hawaiian and Other
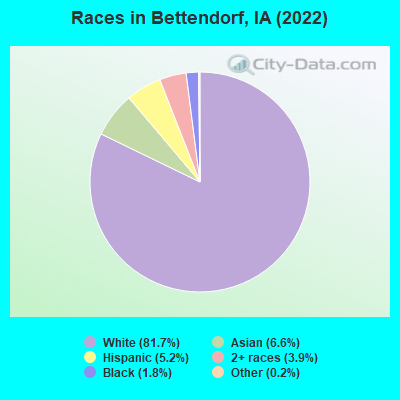
2,650,110 82.8% White alone 218,024 6.8% Hispanic 119,004 3.7% Black alone 115,286 3.6% Two or more races 74,892 2.3% Asian alone 9,260 0.3% Other race alone 8,595 0.3% Native Hawaiian and Other 5,346 0.2% American Indian alone
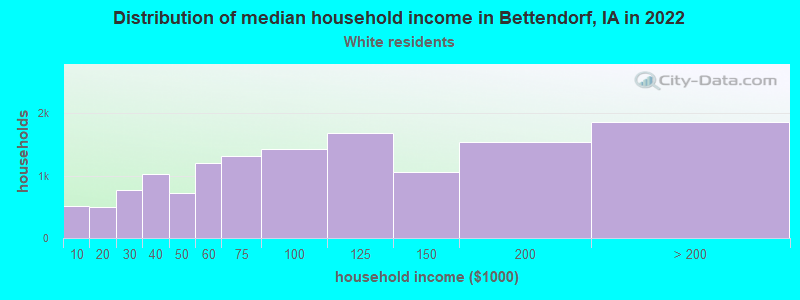
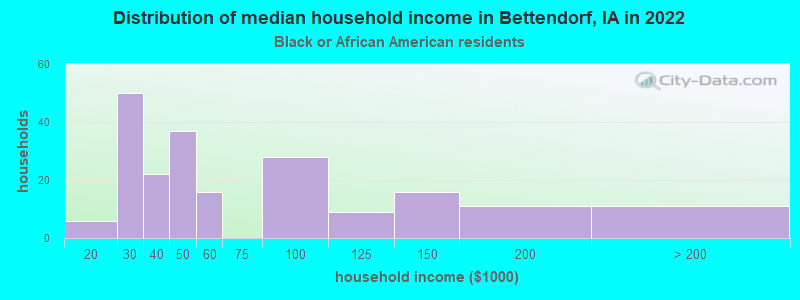
Income and house value in Bettendorf Median household income in 2022 $89,390 White non-Hispanic householders$45,132 Black householders$136,318 Asian householders$49,215 Some other race householders$100,783 Two or more races householders$69,802 Hispanic or Latino race householdersMedian 2022 house value $283,394 White Non-Hispanic householders$223,108 Black or African American householders$272,001 American Indian or Alaska Native householders $437,671 Asian householders$260,134 Some other race householders$271,764 Two or more races householders$220,259 Hispanic or Latino householders
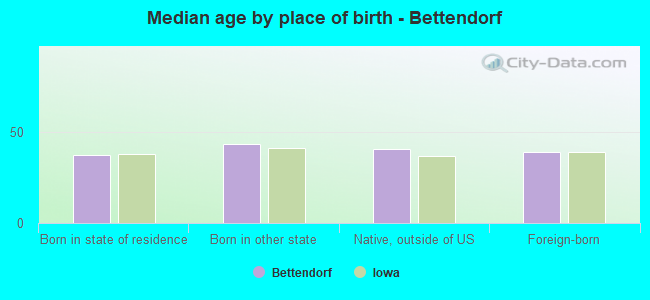
Median age by race in Bettendorf
42.1 Median age for White residents42.4 42.0 28.0 Median age for Black or African American residents28.3 25.8 47.7 Median age for American Indian / Alaska Native residents45.5 70.7 39.1 Median age for Asian residents36.6 40.0 -666,666,666.0 Median age for Native Hawaiian / Pacific Islander residents-666,666,666.0 -666,666,666.0 32.9 Median age for Other race residents25.7 29.8 20.2 Median age for Two or more races residents14.7 18.3 42.4 Median age for White alone residents42.7 42.3 22.3 Median age for Hispanic or Latino residents26.8 22.5
Owner/renter occupied households by race in Bettendorf
House owners and renters - White residents 10,741 76.6% Owner occupied3,287 23.4% Renter occupiedHouse owners and renters - Black or African American residents 68 31.6% Owner occupied148 68.4% Renter occupiedHouse owners and renters - American Indian / Alaska Native residents 11 100.0% Owner occupiedHouse owners and renters - Asian residents 674 81.4% Owner occupied154 18.6% Renter occupiedHouse owners and renters - Other race residents 49 45.6% Owner occupied58 54.4% Renter occupiedHouse owners and renters - Two or more races residents 276 51.4% Owner occupied261 48.6% Renter occupiedHouse owners and renters - White alone residents 10,539 76.9% Owner occupied3,160 23.1% Renter occupiedHouse owners and renters - Hispanic or Latino residents 333 59.5% Owner occupied227 40.5% Renter occupied
Language usage in Bettendorf
English speakers - Total 92.1% of residents of Bettendorf speak English at home.
2.0% of residents speak Spanish at home 396 53.7% Speak English very well342 46.3% Speak English less than very well5.6% of residents speak other language at home 1,583 76.7% Speak English very well482 23.3% Speak English less than very well
English speakers - Born in the United States 96.5% of residents of Bettendorf speak English at home.
2.3% of residents speak Spanish at home 232 70.3% Speak English very well98 29.7% Speak English less than very well0.8% of residents speak other language at home 121 100.0% Speak English very well
English speakers - Native, born elsewhere 94.7% of residents of Bettendorf speak English at home.
2.6% of residents speak other language at home 7 100.0% Speak English very well
English speakers - Foreign-born 21.8% of residents of Bettendorf speak English at home.
4.1% of residents speak Spanish at home 90 77.6% Speak English very well26 22.4% Speak English less than very well64.9% of residents speak other language at home 1,357 74.2% Speak English very well471 25.8% Speak English less than very well
White (Caucasian) - Speak only English Native:
99.3% (30,146)Foreign-born:
97.0% (284)
White (Caucasian) - Speak another language Native:
0.8% (250)Foreign-born:
29.0% (85)
Black or African American - Speak only English Native:
100.0% (614)Foreign-born:
63.0% (7)
Asian - Speak only English Native:
44.1% (130)Foreign-born:
20.7% (440)
Asian - Speak another language Native:
56.6% (166)Foreign-born:
76.5% (1,624)
Other race - Speak another language Native:
47.7% (112)Foreign-born:
100.0% (119)
Two or more races - Speak only English Native:
85.5% (2,262)Foreign-born:
100.0% (26)
Two or more races - Speak another language Native:
13.5% (358)Foreign-born:
12.2% (3)
White alone - Speak only English Native:
99.5% (29,607)Foreign-born:
67.2% (302)
White alone - Speak another language Native:
0.5% (156)Foreign-born:
34.1% (153)
Hispanic or Latino - Speak another language Native:
24.1% (399)Foreign-born:
100.0% (161)
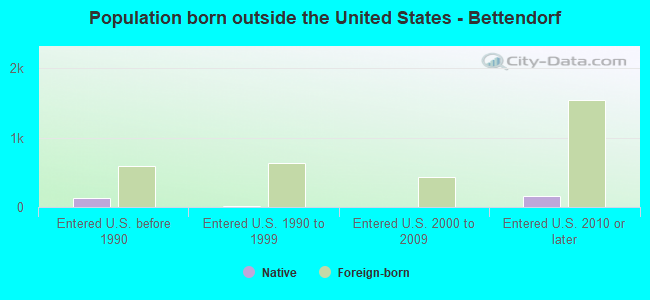
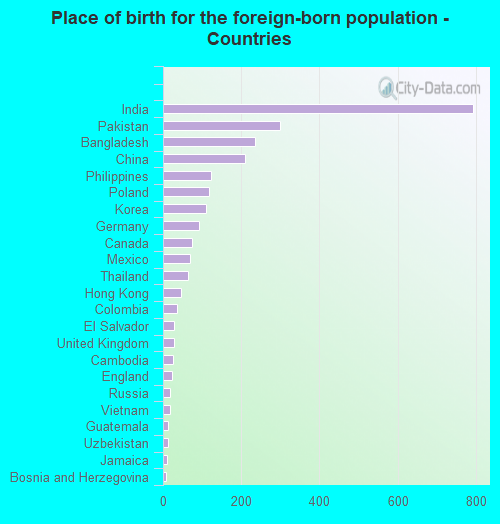
Foreign-born residents in Bettendorf 2,511 residents are foreign born (4.9% Asia , 0.8% Europe ).
Marital status for residents in Bettendorf Marital status - White (Caucasian) population 15 years and over
Males 25.7% Never married60.6% Now married0.8% Separated1.9% Widowed11.0% DivorcedFemales 23.4% Never married53.7% Now married0.8% Separated8.2% Widowed14.0% DivorcedWomen who gave birth in the past 12 months Now married:
90.6% (247)Unmarried:
9.4% (26)
Women who did not give birth in the past 12 months Now married:
48.5% (3,459)Unmarried:
51.5% (3,671)
Marital status - Black or African American population 15 years and over
Males 32.1% Never married53.4% Now married0.0% Separated0.0% Widowed14.5% DivorcedFemales 50.4% Never married16.8% Now married0.0% Separated9.5% Widowed23.2% DivorcedWomen who gave birth in the past 12 months Now married:
100.0% (33)Unmarried:
0.0% (0)
Women who did not give birth in the past 12 months Now married:
7.2% (16)Unmarried:
92.8% (201)
Marital status - American Indian / Alaska Native population 15 years and over
Males 25.0% Never married12.5% Now married0.0% Separated0.0% Widowed62.5% DivorcedFemales 25.0% Never married56.3% Now married0.0% Separated0.0% Widowed18.8% DivorcedWomen who did not give birth in the past 12 months Now married:
60.0% (6)Unmarried:
40.0% (4)
Marital status - Asian population 15 years and over
Males 40.3% Never married53.8% Now married2.7% Separated3.2% Widowed0.0% DivorcedFemales 21.5% Never married64.1% Now married2.1% Separated2.4% Widowed9.9% DivorcedWomen who gave birth in the past 12 months Now married:
100.0% (70)Unmarried:
0.0% (0)
Women who did not give birth in the past 12 months Now married:
56.9% (369)Unmarried:
43.1% (279)
Marital status - Other race population 15 years and over
Males 57.1% Never married33.0% Now married0.0% Separated9.9% Widowed0.0% DivorcedFemales 28.2% Never married37.6% Now married0.0% Separated0.0% Widowed34.1% DivorcedWomen who gave birth in the past 12 months Now married:
100.0% (10)Unmarried:
0.0% (0)
Women who did not give birth in the past 12 months Now married:
31.2% (31)Unmarried:
68.8% (69)
Marital status - Two or more races population 15 years and over
Males 55.5% Never married36.7% Now married0.0% Separated0.0% Widowed7.8% DivorcedFemales 55.7% Never married27.8% Now married7.4% Separated1.0% Widowed8.1% DivorcedWomen who gave birth in the past 12 months Now married:
0.0% (0)Unmarried:
100.0% (30)
Women who did not give birth in the past 12 months Now married:
30.9% (276)Unmarried:
69.1% (618)
Marital status - White alone, not Hispanic / Latino population 15 years and over
Males 25.0% Never married61.4% Now married0.4% Separated1.9% Widowed11.2% DivorcedFemales 23.0% Never married54.0% Now married0.7% Separated8.3% Widowed14.0% DivorcedWomen who gave birth in the past 12 months Now married:
90.2% (240)Unmarried:
9.8% (26)
Women who did not give birth in the past 12 months Now married:
48.6% (3,419)Unmarried:
51.4% (3,622)
Marital status - Hispanic or Latino population 15 years and over
Males 48.4% Never married37.6% Now married9.0% Separated1.2% Widowed3.7% DivorcedFemales 56.2% Never married28.2% Now married2.3% Separated0.0% Widowed13.3% DivorcedWomen who gave birth in the past 12 months Now married:
100.0% (19)Unmarried:
0.0% (0)
Women who did not give birth in the past 12 months Now married:
27.1% (141)Unmarried:
72.9% (378)
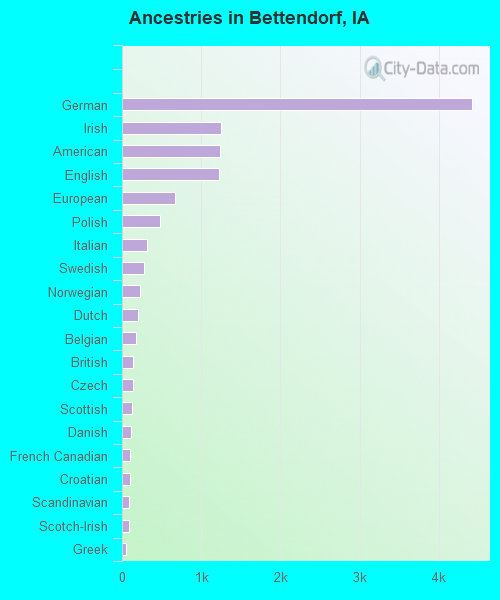
Ancestries in Bettendorf
4,415 27.2% German1,249 7.7% Irish1,244 7.7% American1,229 7.6% English664 4.1% European483 3.0% Polish311 1.9% Italian280 1.7% Swedish232 1.4% Norwegian202 1.2% Dutch180 1.1% Belgian133 0.8% British133 0.8% Czech131 0.8% Scottish116 0.7% Danish102 0.6% French Canadian98 0.6% Croatian94 0.6% Scandinavian87 0.5% Scotch-Irish52 0.3% Greek36 0.2% Northern European29 0.2% Welsh21 0.1% French20 0.1% Palestinian20 0.1% Eastern European20 0.1% Jamaican13 0.08% Egyptian12 0.07% Austrian11 0.07% Canadian11 0.07% Swiss9 0.06% Finnish6 0.04% Yugoslavian5 0.03% Russian2 0.01% Hungarian1 0.01% Ethiopian
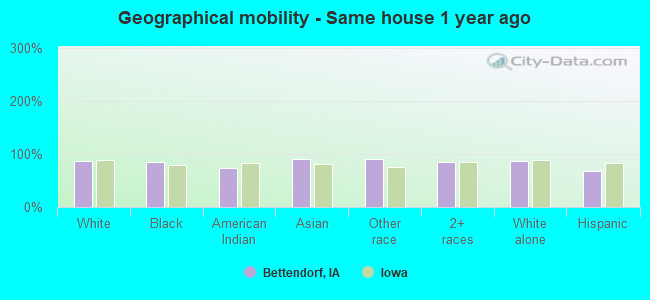
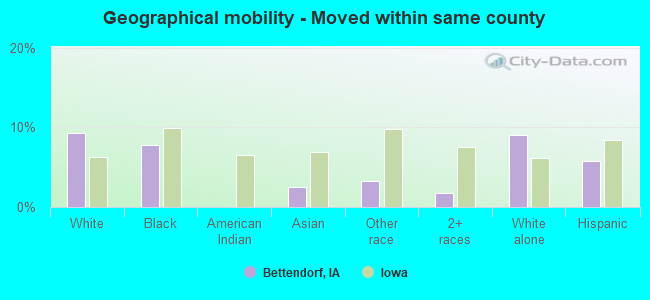
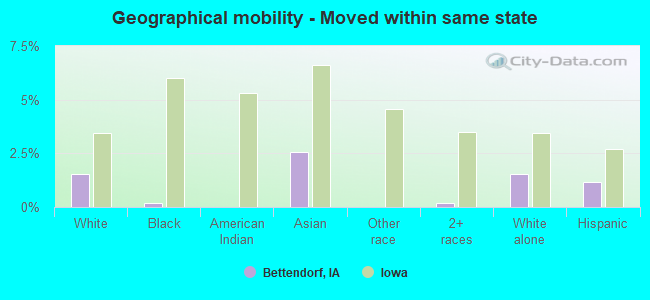
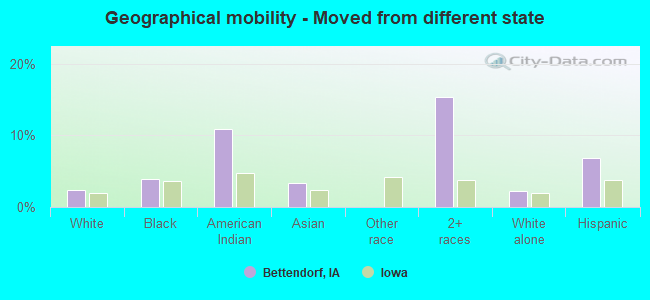
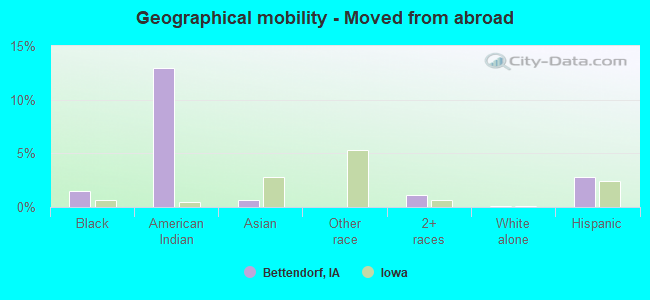
Geographical mobility in Bettendorf Same house 1 year ago 27,806 86.8% White (Caucasian)616 84.5% Black or African American26 73.7% American Indian / Alaska Native2,277 90.7% Asian347 90.7% Other race1,768 84.7% Two or more races27,484 87.2% White alone, not Hispanic / Latino1,320 68.7% Hispanic or LatinoMoved within same county 2,966 9.3% White / Caucasian57 7.8% Black or African American63 2.5% Asian13 3.3% Other race36 1.7% Two or more races2,859 9.1% White alone, not Hispanic / Latino111 5.8% Hispanic or LatinoMoved within same state 499 1.6% White / Caucasian1 0.2% Black or African American64 2.5% Asian4 0.2% Two or more races492 1.6% White alone, not Hispanic / Latino23 1.2% Hispanic or LatinoMoved from different state 750 2.3% White / Caucasian29 3.9% Black or African American4 10.8% American Indian / Alaska Native86 3.4% Asian319 15.3% Two or more races683 2.2% White alone, not Hispanic / Latino133 6.9% Hispanic or LatinoMoved from abroad 30 0.1% White11 1.5% Black or African American5 13.0% American Indian / Alaska Native16 0.6% Asian23 1.1% Two or more races33 0.1% White alone, not Hispanic / Latino53 2.8% Hispanic or Latino
Children Nativity (place of birth) in Bettendorf
Children under 6 years - Living with two parents Both parents native 1,913 100.0% Native0 0.0% Foreign-bornBoth parents foreign-born 107 93.8% Native7 6.2% Foreign-bornOne native, one foreign-born parent 251 100.0% NativeChildren under 6 years - Living with one parent Native parent 442 100.0% NativeForeign-born parent 16 100.0% NativeChildren 6 to 17 years - Living with two parents Both parents native 4,521 99.6% Native17 0.4% Foreign-bornBoth parents foreign-born 293 54.2% Native247 45.8% Foreign-bornOne native, one foreign-born parent 127 100.0% NativeChildren 6 to 17 years - Living with one parent Native parent 1,678 100.0% NativeForeign-born parent 134 51.8% Native125 48.2% Foreign-born
Grandparents responsible for own grandchildren in Bettendorf
Grandparents (30 to 59 years) White / Caucasian 25 16.8% Responsible for grandchildren124 83.2% Not responsible for grandchildrenBlack or African American 18 100.0% Responsible for grandchildrenWhite alone, not Hispanic / Latino 25 14.0% Responsible for grandchildren153 86.0% Not responsible for grandchildrenGrandparents (60 years and over) White / Caucasian 34 31.8% Responsible for grandchildren73 68.2% Not responsible for grandchildrenBlack or African American 5 100.0% Not responsible for grandchildrenWhite alone, not Hispanic / Latino 34 29.1% Responsible for grandchildren83 70.9% Not responsible for grandchildren