Races in Beverly Hills, Florida (FL) Detailed Stats
Ancestries, Foreign-born residents, place of birth
Settings
X


Recent posts about races in Beverly Hills, Florida on our local forum with over 2,400,000 registered users:
 | Beverly Hills, Inverness, or Homosassa Springs area to live (8 replies) |
| Fla. insurance crisis deepens as rates soar, companies fall (77 replies) |
| Considering Moving to Tampa from NJ (47 replies) |
| Is Sarasota in a bubble (860 replies) |
| Jacksonville heading for a White Flight (23 replies) |
| Is Florida the new California? (73 replies) |
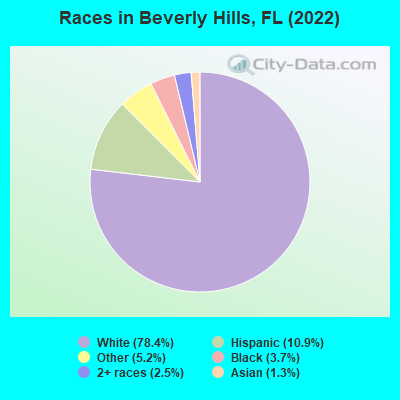
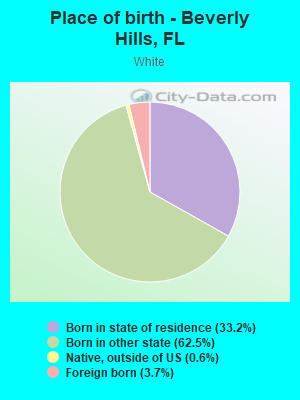
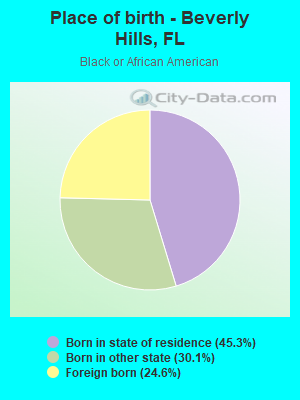
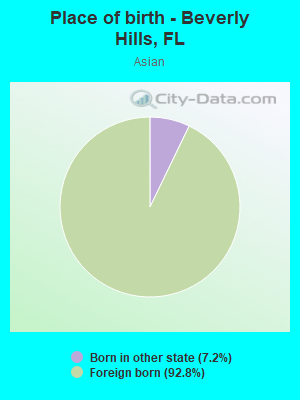
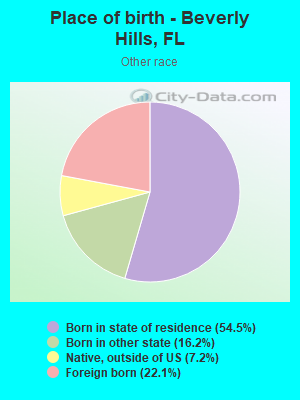
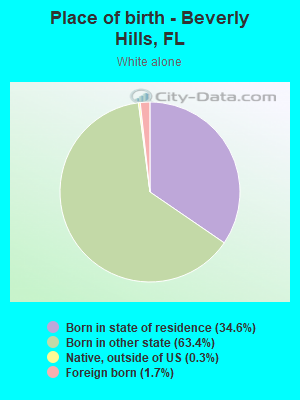
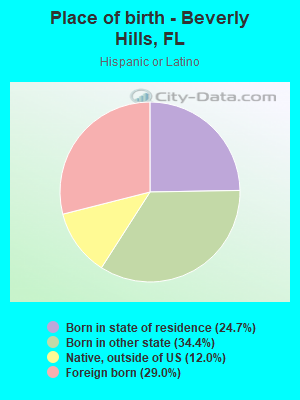
According to 2022 data, the most numerous races in Beverly Hills, FL are White alone (8,039 residents), Hispanic (1,122 residents), and Black alone (382 residents). 90.2% of Beverly Hills residents speak English at home. 8.3% of Beverly Hills, FL residents are foreign-born (4.5% born in Latin America, 1.7% born in Asia, 1.4% born in Europe), which is 152.4% less than the foreign-born rate of 21.0% across the entire state of Florida.
Race distribution in Beverly Hills
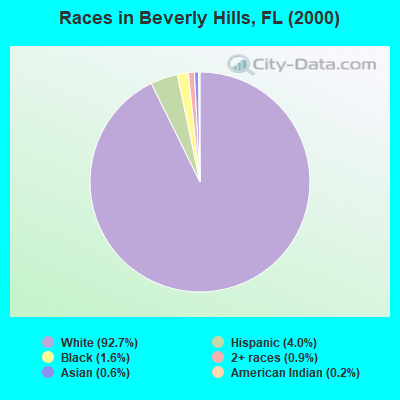
2000
2022

- 7,70692.7%White alone
- 3304.0%Hispanic
- 1371.6%Black alone
- 750.9%Two or more races
- 500.6%Asian alone
- 140.2%American Indian alone
- 40.05%Other race alone
- 10.01%Native Hawaiian and Other
Pacific Islander alone
-
- 8,03978.4%White alone
- 1,12210.9%Hispanic
- 5375.2%Other race alone
- 3823.7%Black alone
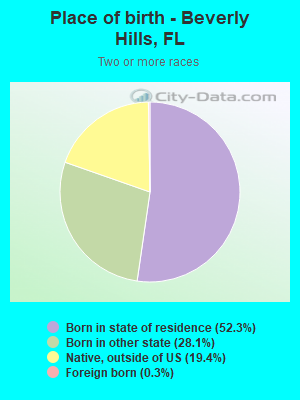
- 2602.5%Two or more races
- 1321.3%Asian alone
2000
2022
-
- 10,458,50965.4%White alone
- 2,682,71516.8%Hispanic
- 2,264,26814.2%Black alone
- 261,6931.6%Asian alone
- 236,9541.5%Two or more races
- 42,3580.3%American Indian alone
- 28,9940.2%Other race alone
- 6,8870.04%Native Hawaiian and Other
Pacific Islander alone

-
- 11,309,40350.8%White alone
- 6,025,03927.1%Hispanic
- 3,241,01514.6%Black alone
- 861,6303.9%Two or more races
- 623,6922.8%Asian alone
- 152,0540.7%Other race alone
- 22,5040.1%American Indian alone
- 9,4860.04%Native Hawaiian and Other
Pacific Islander alone

Income and house value in Beverly Hills
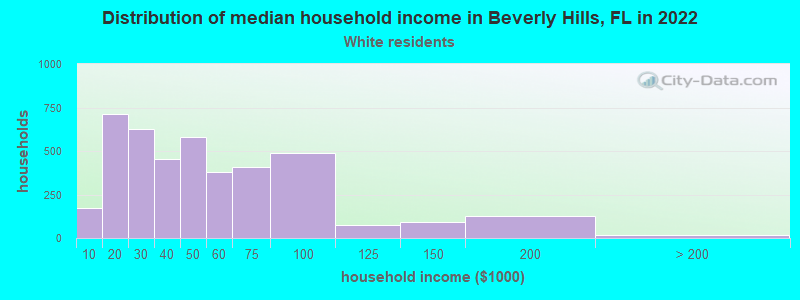
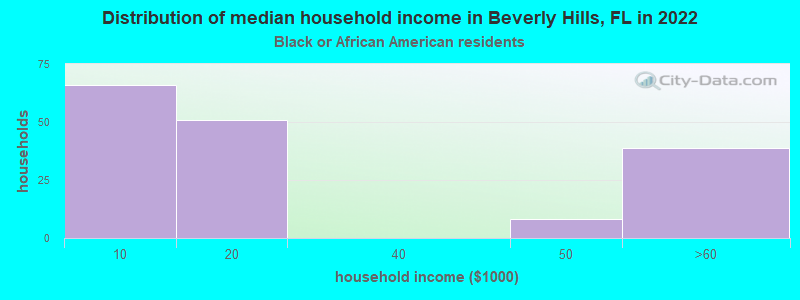
- Median household income in 2022
- $40,843White non-Hispanic householders
- $44,878Asian householders
- $69,407Some other race householders
- $46,826Hispanic or Latino race householders
- Median 2022 house value
- $156,932White Non-Hispanic householders
- $200,942Black or African American householders
- $246,111Asian householders
- $325,735Some other race householders
- $137,822Two or more races householders
- $128,556Hispanic or Latino householders
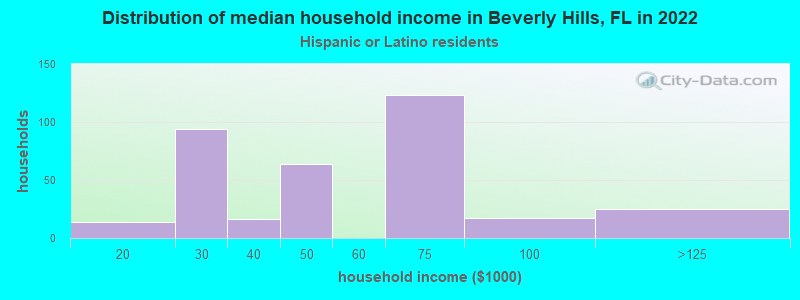
Household income for White non-Hispanic householders
Household income for Black householders
Household income for Asian householders
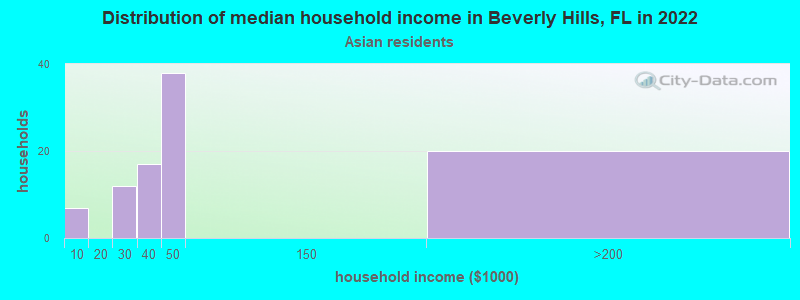
Household income for Some other race householders
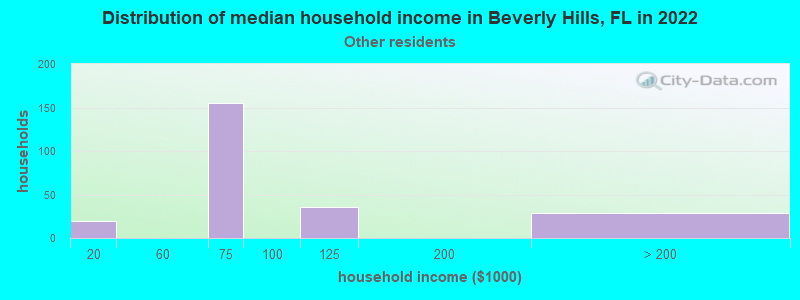
Household income for Two or more races householders
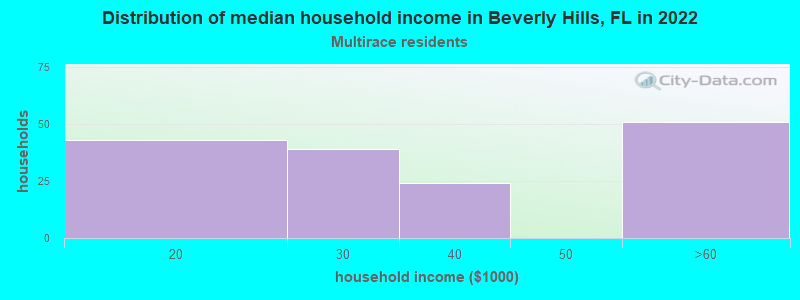
Household income for Hispanic or Latino race householders
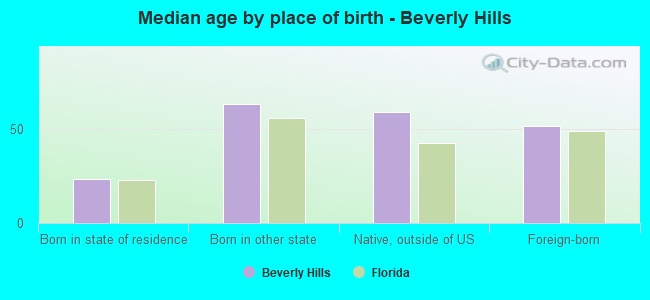
Median age by race in Beverly Hills
- 52.9Median age for White residents
- 46.8Males
- 59.9Females
- 47.0Median age for Black or African American residents
- 43.7Males
- 65.7Females
- -598,566,307.6Median age for American Indian / Alaska Native residents
- -611,418,047.3Males
- -594,925,633.7Females
- 54.7Median age for Asian residents
- 60.6Males
- 50.0Females
- -679,849,340.2Median age for Native Hawaiian / Pacific Islander residents
- -666,666,666.0Males
- -666,666,666.0Females
- 21.5Median age for Other race residents
- 19.4Males
- 28.3Females
- 27.3Median age for Two or more races residents
- 22.0Males
- 33.2Females
- 54.3Median age for White alone residents
- 49.0Males
- 59.8Females
- 39.1Median age for Hispanic or Latino residents
- 35.1Males
- 46.4Females
Owner/renter occupied households by race in Beverly Hills
- House owners and renters - White residents
- 2,93473.2%Owner occupied
- 1,07626.8%Renter occupied
- House owners and renters - Black or African American residents
- 1810.6%Owner occupied
- 14989.4%Renter occupied
- House owners and renters - American Indian / Alaska Native residents
- 18100.0%Owner occupied
- House owners and renters - Asian residents
- 3941.7%Owner occupied
- 5458.3%Renter occupied
- House owners and renters - Other race residents
- 15255.0%Owner occupied
- 12445.0%Renter occupied
- House owners and renters - Two or more races residents
- 5737.2%Owner occupied
- 9562.8%Renter occupied
- House owners and renters - White alone residents
- 2,80872.6%Owner occupied
- 1,06127.4%Renter occupied
- House owners and renters - Hispanic or Latino residents
- 20553.3%Owner occupied
- 17946.7%Renter occupied
Language usage in Beverly Hills
- English speakers - Total
- 90.2% of residents of Beverly Hills speak English at home.
- 7.0% of residents speak Spanish at home
- 45064.7%Speak English very well
- 24535.3%Speak English less than very well
- 2.6% of residents speak other language at home
- 18472.4%Speak English very well
- 7027.6%Speak English less than very well
- English speakers - Born in the United States
- 97.8% of residents of Beverly Hills speak English at home.
- 2.4% of residents speak Spanish at home
- 133100.0%Speak English very well
- 0.2% of residents speak other language at home
- 13100.0%Speak English very well
- English speakers - Native, born elsewhere
- 12.8% of residents of Beverly Hills speak English at home.
- 55.1% of residents speak Spanish at home
- 4341.7%Speak English very well
- 6058.3%Speak English less than very well
- English speakers - Foreign-born
- 29.4% of residents of Beverly Hills speak English at home.
- 44.1% of residents speak Spanish at home
- 16754.9%Speak English very well
- 13745.1%Speak English less than very well
- 27.2% of residents speak other language at home
- 12767.6%Speak English very well
- 6132.4%Speak English less than very well
White (Caucasian) - Speak only English
| Native: | 98.5% (7,667) |
| Foreign-born: | 27.6% (87) |
White (Caucasian) - Speak another language
| Native: | 1.5% (119) |
| Foreign-born: | 49.6% (157) |
Black or African American - Speak only English
| Native: | 99.8% (281) |
| Foreign-born: | 97.0% (68) |
Asian - Speak another language
| Native: | 97.5% (12) |
| Foreign-born: | 81.7% (138) |
Other race - Speak only English
| Native: | 58.6% (448) |
| Foreign-born: | 30.8% (66) |
Other race - Speak another language
| Native: | 41.4% (317) |
| Foreign-born: | 56.5% (122) |
Two or more races - Speak another language
| Native: | 24.6% (129) |
| Foreign-born: | 100.0% (2) |
White alone - Speak only English
| Native: | 99.3% (7,538) |
| Foreign-born: | 63.2% (89) |
White alone - Speak another language
| Native: | 0.8% (62) |
| Foreign-born: | 79.7% (112) |
Hispanic or Latino - Speak another language
| Native: | 49.5% (378) |
| Foreign-born: | 100.0% (303) |
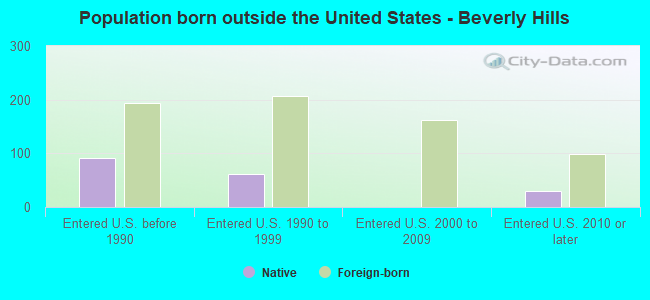
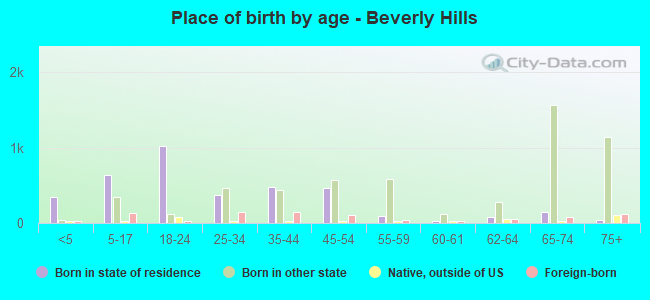
Foreign-born residents in Beverly Hills
853 residents are foreign born (4.5% Latin America, 1.7% Asia, 1.4% Europe).
| This city: | 8.3% |
| Florida: | 21.1% |
Marital status for residents in Beverly Hills
Marital status - White (Caucasian) population 15 years and over
- Males
- 38.0%Never married
- 41.9%Now married
- 1.8%Separated
- 3.2%Widowed
- 15.1%Divorced
- Females
- 24.9%Never married
- 32.6%Now married
- 1.8%Separated
- 20.3%Widowed
- 20.3%Divorced
Women who did not give birth in the past 12 months
| Now married: | 26.2% (396) |
| Unmarried: | 73.8% (1,116) |
Marital status - Black or African American population 15 years and over
- Males
- 70.3%Never married
- 28.3%Now married
- 0.0%Separated
- 1.4%Widowed
- 0.0%Divorced
- Females
- 26.6%Never married
- 57.0%Now married
- 0.0%Separated
- 3.3%Widowed
- 13.1%Divorced
Women who did not give birth in the past 12 months
| Now married: | 55.0% (71) |
| Unmarried: | 45.0% (58) |
Marital status - Asian population 15 years and over
- Males
- 82.9%Never married
- 17.1%Now married
- 0.0%Separated
- 0.0%Widowed
- 0.0%Divorced
- Females
- 34.4%Never married
- 34.4%Now married
- 0.0%Separated
- 0.0%Widowed
- 31.1%Divorced
Women who did not give birth in the past 12 months
| Now married: | 34.0% (17) |
| Unmarried: | 66.0% (32) |
Marital status - Other race population 15 years and over
- Males
- 74.6%Never married
- 20.4%Now married
- 0.0%Separated
- 0.0%Widowed
- 5.0%Divorced
- Females
- 45.1%Never married
- 30.7%Now married
- 0.0%Separated
- 0.0%Widowed
- 24.2%Divorced
Women who did not give birth in the past 12 months
| Now married: | 30.7% (95) |
| Unmarried: | 69.3% (214) |
Marital status - Two or more races population 15 years and over
- Males
- 58.2%Never married
- 41.8%Now married
- 0.0%Separated
- 0.0%Widowed
- 0.0%Divorced
- Females
- 61.8%Never married
- 20.0%Now married
- 0.0%Separated
- 0.0%Widowed
- 18.2%Divorced
Women who did not give birth in the past 12 months
| Now married: | 13.2% (38) |
| Unmarried: | 86.8% (249) |
Marital status - White alone, not Hispanic / Latino population 15 years and over
- Males
- 38.9%Never married
- 40.2%Now married
- 1.8%Separated
- 3.5%Widowed
- 15.6%Divorced
- Females
- 24.4%Never married
- 32.2%Now married
- 1.9%Separated
- 20.1%Widowed
- 21.5%Divorced
Women who did not give birth in the past 12 months
| Now married: | 25.0% (350) |
| Unmarried: | 75.0% (1,050) |
Marital status - Hispanic or Latino population 15 years and over
- Males
- 48.5%Never married
- 43.8%Now married
- 0.2%Separated
- 0.0%Widowed
- 7.5%Divorced
- Females
- 32.7%Never married
- 39.6%Now married
- 0.0%Separated
- 12.8%Widowed
- 15.0%Divorced
Women who did not give birth in the past 12 months
| Now married: | 38.2% (119) |
| Unmarried: | 61.8% (193) |
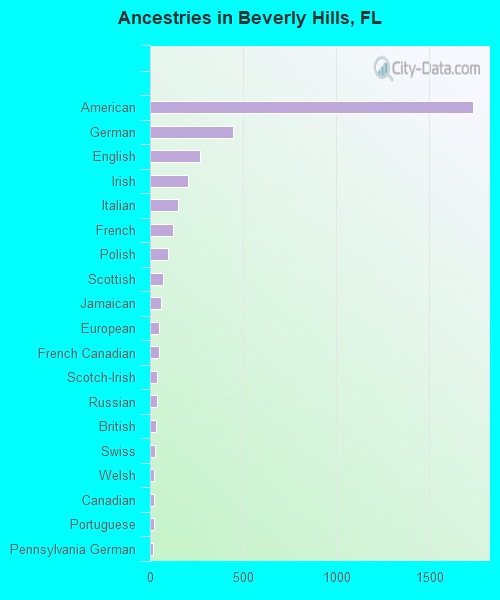
Ancestries in Beverly Hills

- 1,73433.9%American
- 4478.7%German
- 2715.3%English
- 2044.0%Irish
- 1482.9%Italian
- 1252.4%French
- 941.8%Polish
- 721.4%Scottish
- 591.2%Jamaican
- 470.9%European
- 470.9%French Canadian
- 390.8%Scotch-Irish
- 370.7%Russian
- 340.7%British
- 260.5%Swiss
- 240.5%Welsh
- 220.4%Canadian
- 200.4%Portuguese
- 160.3%Pennsylvania German
- 150.3%Dutch
- 100.2%Bahamian
- 90.2%Greek
- 70.1%Eastern European
- 30.06%Haitian
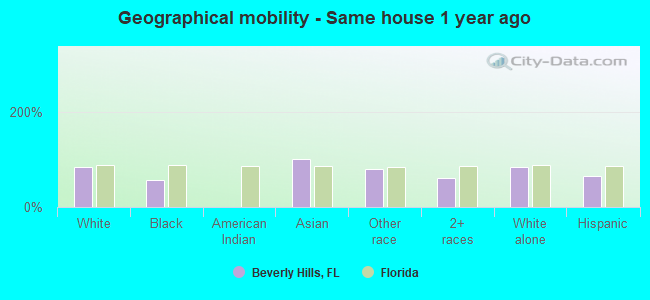
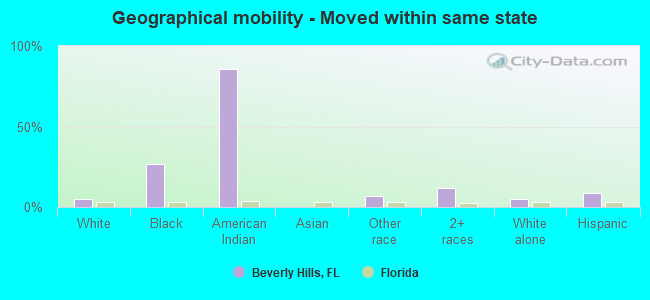
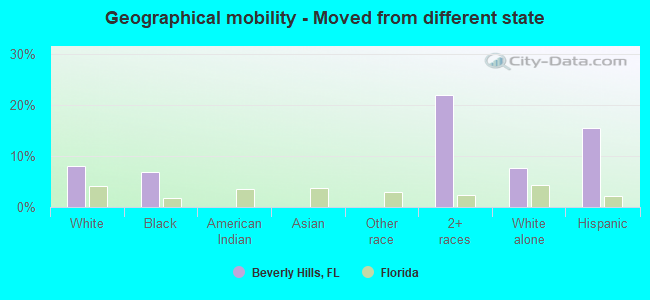
Geographical mobility in Beverly Hills

- Same house 1 year ago
- 7,06383.9%White (Caucasian)
- 20356.5%Black or African American
- 183100.0%Asian
- 61480.4%Other race
- 30260.4%Two or more races
- 6,75584.3%White alone, not Hispanic / Latino
- 74566.1%Hispanic or Latino
-
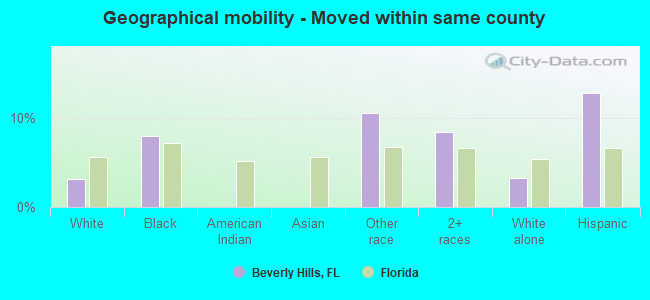
- Moved within same county
- 2653.1%White / Caucasian
- 298.0%Black or African American
- 8010.5%Other race
- 428.4%Two or more races
- 2583.2%White alone, not Hispanic / Latino
- 14412.8%Hispanic or Latino
-
- Moved within same state
- 3964.7%White / Caucasian
- 9727.0%Black or African American
- 1886.0%American Indian / Alaska Native
- 526.8%Other race
- 6012.1%Two or more races
- 3744.7%White alone, not Hispanic / Latino
- 1008.9%Hispanic or Latino
-
- Moved from different state
- 6708.0%White / Caucasian
- 256.9%Black or African American
- 10921.9%Two or more races
- 6087.6%White alone, not Hispanic / Latino
- 17515.5%Hispanic or Latino
Children Nativity (place of birth) in Beverly Hills
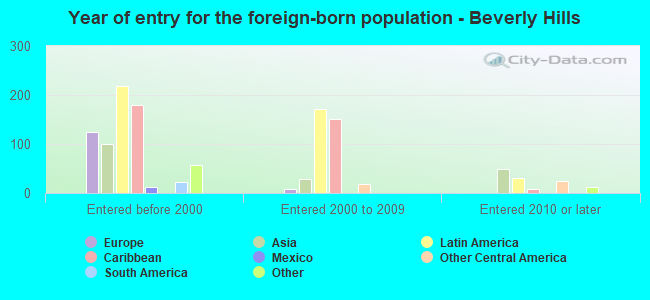
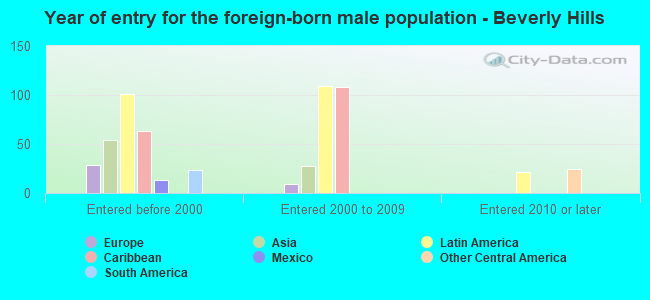
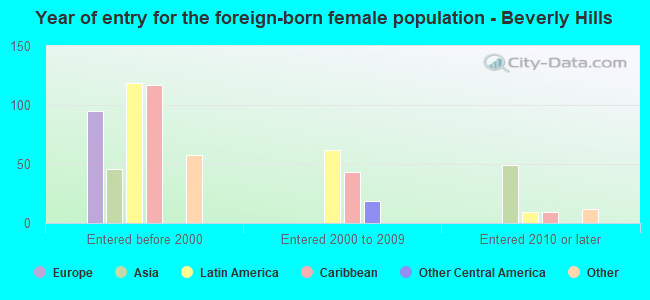
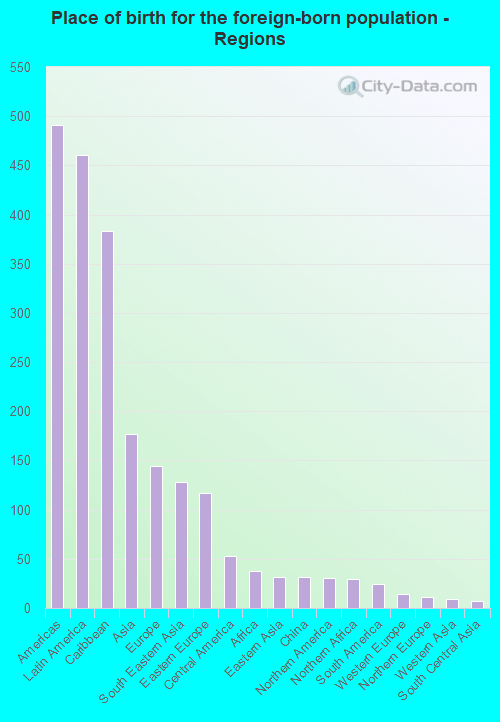
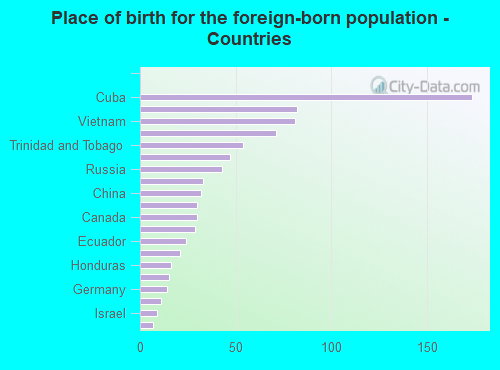
Place of birth for residents in Beverly Hills
![Place of birth for the foreign-born population - Regions]()
- 491Americas
- 461Latin America
- 383Caribbean
- 177Asia
- 144Europe
- 128South Eastern Asia
- 117Eastern Europe
- 53Central America
- 38Africa
- 32Eastern Asia
- 32China
- 30Northern America
- 29Northern Africa
- 24South America
- 14Western Europe
- 11Northern Europe
- 9Western Asia
- 7South Central Asia
![Place of birth for the foreign-born population - Countries]()
- 174Cuba
- 82Dominican Republic
- 81Vietnam
- 71Jamaica
- 54Trinidad and Tobago
- 47Philippines
- 43Russia
- 33Poland
- 32China
- 30Croatia
- 30Canada
- 29Morocco
- 24Ecuador
- 21Costa Rica
- 16Honduras
- 15Mexico
- 14Germany
- 11England
- 9Israel
- 7India
Grandparents responsible for own grandchildren in Beverly Hills
Zip codes: 34465.