Races in Beverly Hills, Michigan (MI) Detailed Stats
Data:
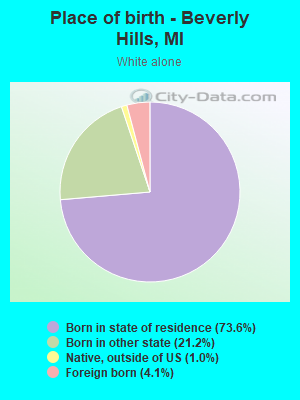
Races - White alone (%)
Races - White alone (% change since 2000)
Races - Black alone (%)
Races - Black alone (% change since 2000)
Races - American Indian alone (%)
Races - American Indian alone (% change since 2000)
Races - Asian alone (%)
Races - Asian alone (% change since 2000)
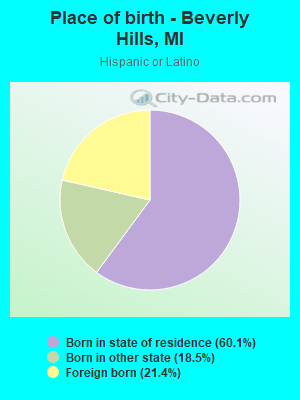
Races - Hispanic (%)
Races - Hispanic (% change since 2000)
Races - Native Hawaiian and Other Pacific Islander alone (%)
Races - Native Hawaiian and Other Pacific Islander alone (% change since 2000)
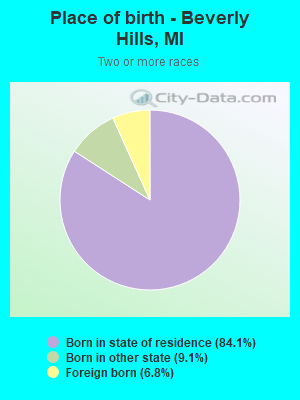
Races - Two or more races(%)
Races - Two or more races(% change since 2000)
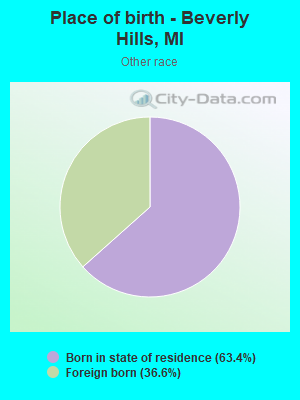
Races - Other race alone (%)
Races - Other race alone (% change since 2000)
Racial diversity
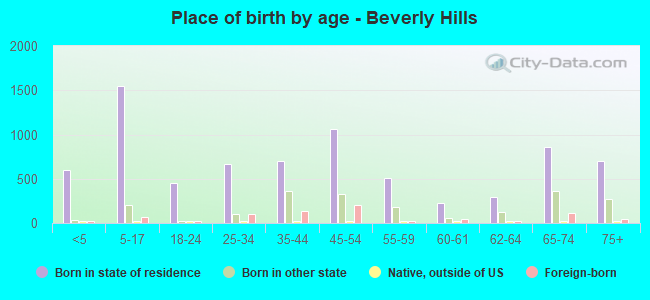
Place of birth - Born in state of residence (%)
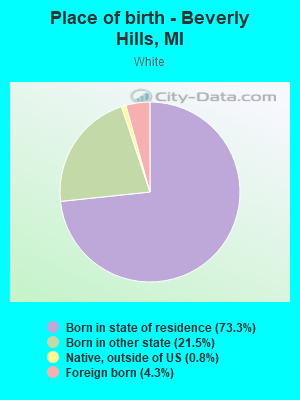
Place of birth - Born in state of residence (%) - White
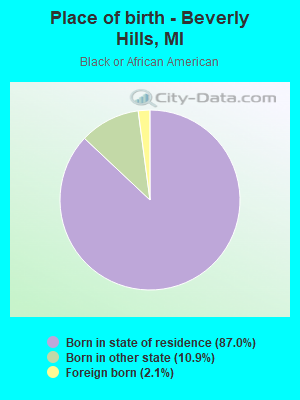
Place of birth - Born in state of residence (%) - Black or African American
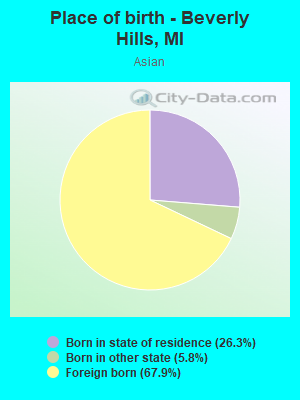
Place of birth - Born in state of residence (%) - Asian
Place of birth - Born in state of residence (%) - Hispanic or Latino
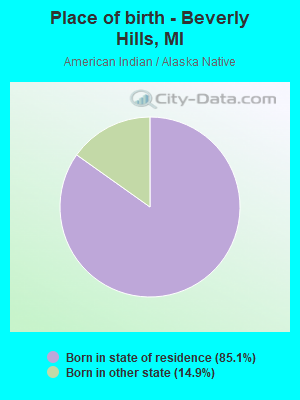
Place of birth - Born in state of residence (%) - American Indian and Alaska Native
Place of birth - Born in state of residence (%) - Multirace
Place of birth - Born in state of residence (%) - Other Race
Place of birth - Born in other state (%)
Place of birth - Born in other state (%) - White
Place of birth - Born in other state (%) - Black or African American
Place of birth - Born in other state (%) - Asian
Place of birth - Born in other state (%) - Hispanic or Latino
Place of birth - Born in other state (%) - American Indian and Alaska Native
Place of birth - Born in other state (%) - Multirace
Place of birth - Born in other state (%) - Other Race
Place of birth - Native, outside of US (%)
Place of birth - Native, outside of US (%) - White
Place of birth - Native, outside of US (%) - Black or African American
Place of birth - Native, outside of US (%) - Asian
Place of birth - Native, outside of US (%) - Hispanic or Latino
Place of birth - Native, outside of US (%) - American Indian and Alaska Native
Place of birth - Native, outside of US (%) - Multirace
Place of birth - Native, outside of US (%) - Other Race
Place of birth - Foreign born (%)
Place of birth - Foreign born (%) - White
Place of birth - Foreign born (%) - Black or African American
Place of birth - Foreign born (%) - Asian
Place of birth - Foreign born (%) - Hispanic or Latino
Place of birth - Foreign born (%) - American Indian and Alaska Native
Place of birth - Foreign born (%) - Multirace
Place of birth - Foreign born (%) - Other Race
Residents speaking English at home (%)
Residents speaking English at home - Born in the United States (%)
Residents speaking English at home - Native, born elsewhere (%)
Residents speaking English at home - Foreign born (%)
Residents speaking Spanish at home (%)
Residents speaking Spanish at home - Born in the United States (%)
Residents speaking Spanish at home - Native, born elsewhere (%)
Residents speaking Spanish at home - Foreign born (%)
Residents speaking other language at home (%)
Residents speaking other language at home - Born in the United States (%)
Residents speaking other language at home - Native, born elsewhere (%)
Residents speaking other language at home - Foreign born (%)
Marital status - Never married (%)
Marital status - Now married (%)
Marital status - Separated (%)
Marital status - Widowed (%)
Marital status - Divorced (%)
Ancestries Reported - Arab (%)
Ancestries Reported - Czech (%)
Ancestries Reported - Danish (%)
Ancestries Reported - Dutch (%)
Ancestries Reported - English (%)
Ancestries Reported - French (%)
Ancestries Reported - French Canadian (%)
Ancestries Reported - German (%)
Ancestries Reported - Greek (%)
Ancestries Reported - Hungarian (%)
Ancestries Reported - Irish (%)
Ancestries Reported - Italian (%)
Ancestries Reported - Lithuanian (%)
Ancestries Reported - Norwegian (%)
Ancestries Reported - Polish (%)
Ancestries Reported - Portuguese (%)
Ancestries Reported - Russian (%)
Ancestries Reported - Scotch-Irish (%)
Ancestries Reported - Scottish (%)
Ancestries Reported - Slovak (%)
Ancestries Reported - Subsaharan African (%)
Ancestries Reported - Swedish (%)
Ancestries Reported - Swiss (%)
Ancestries Reported - Ukrainian (%)
Ancestries Reported - United States (%)
Ancestries Reported - Welsh (%)
Ancestries Reported - West Indian (%)
Ancestries Reported - Other (%)
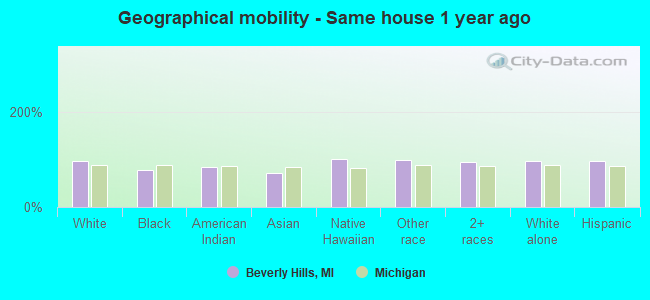
Geographical mobility - Same house 1 year ago (%)
Geographical mobility - Same house 1 year ago (%) - White
Geographical mobility - Same house 1 year ago (%) - Black or African American
Geographical mobility - Same house 1 year ago (%) - Asian
Geographical mobility - Same house 1 year ago (%) - Hispanic or Latino
Geographical mobility - Same house 1 year ago (%) - American Indian and Alaska Native
Geographical mobility - Same house 1 year ago (%) - Multirace
Geographical mobility - Same house 1 year ago (%) - Other Race
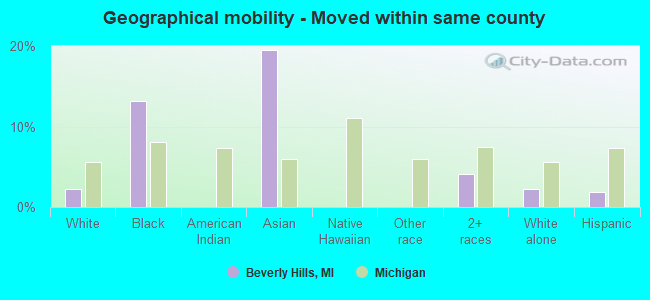
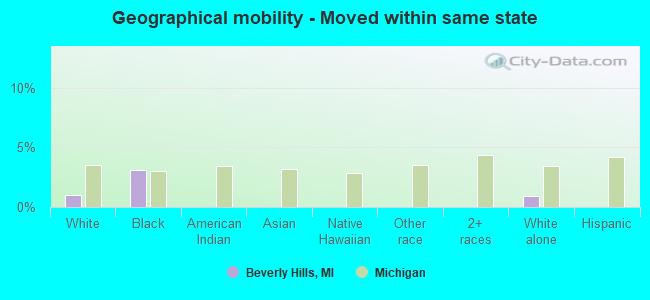
Geographical mobility - Moved within same county (%)
Geographical mobility - Moved within same county (%) - White
Geographical mobility - Moved within same county (%) - Black or African American
Geographical mobility - Moved within same county (%) - Asian
Geographical mobility - Moved within same county (%) - Hispanic or Latino
Geographical mobility - Moved within same county (%) - American Indian and Alaska Native
Geographical mobility - Moved within same county (%) - Multirace
Geographical mobility - Moved within same county (%) - Other Race
Geographical mobility - Moved from different county within same state (%)
Geographical mobility - Moved from different county within same state (%) - White
Geographical mobility - Moved from different county within same state (%) - Black or African American
Geographical mobility - Moved from different county within same state (%) - Asian
Geographical mobility - Moved from different county within same state (%) - Hispanic or Latino
Geographical mobility - Moved from different county within same state (%) - American Indian and Alaska Native
Geographical mobility - Moved from different county within same state (%) - Multirace
Geographical mobility - Moved from different county within same state (%) - Other Race
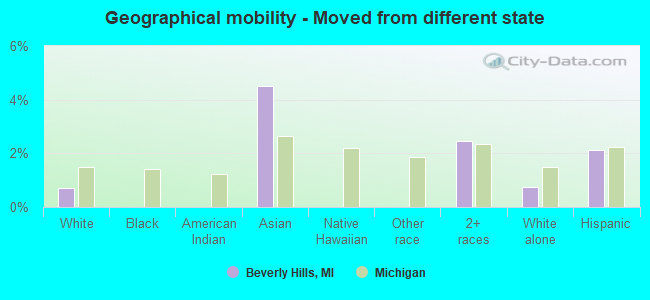
Geographical mobility - Moved from different state (%)
Geographical mobility - Moved from different state (%) - White
Geographical mobility - Moved from different state (%) - Black or African American
Geographical mobility - Moved from different state (%) - Asian
Geographical mobility - Moved from different state (%) - Hispanic or Latino
Geographical mobility - Moved from different state (%) - American Indian and Alaska Native
Geographical mobility - Moved from different state (%) - Multirace
Geographical mobility - Moved from different state (%) - Other Race
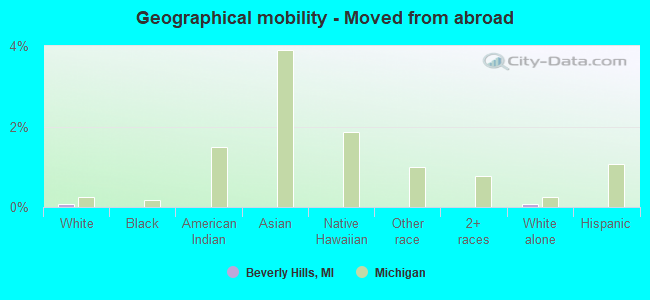
Geographical mobility - Moved from abroad (%)
Geographical mobility - Moved from abroad (%) - White
Geographical mobility - Moved from abroad (%) - Black or African American
Geographical mobility - Moved from abroad (%) - Asian
Geographical mobility - Moved from abroad (%) - Hispanic or Latino
Geographical mobility - Moved from abroad (%) - American Indian and Alaska Native
Geographical mobility - Moved from abroad (%) - Multirace
Geographical mobility - Moved from abroad (%) - Other Race
Place of birth for the foreign-born population - Ireland (%)
Place of birth for the foreign-born population - Denmark (%)
Place of birth for the foreign-born population - Norway (%)
Place of birth for the foreign-born population - Sweden (%)
Place of birth for the foreign-born population - United Kingdom (%)
Place of birth for the foreign-born population - England (%)
Place of birth for the foreign-born population - Scotland (%)
Place of birth for the foreign-born population - Other Northern Europe (%)
Place of birth for the foreign-born population - Austria (%)
Place of birth for the foreign-born population - Belgium (%)
Place of birth for the foreign-born population - France (%)
Place of birth for the foreign-born population - Germany (%)
Place of birth for the foreign-born population - Netherlands (%)
Place of birth for the foreign-born population - Switzerland (%)
Place of birth for the foreign-born population - Other Western Europe (%)
Place of birth for the foreign-born population - Greece (%)
Place of birth for the foreign-born population - Italy (%)
Place of birth for the foreign-born population - Portugal (%)
Place of birth for the foreign-born population - Spain (%)
Place of birth for the foreign-born population - Other Southern Europe (%)
Place of birth for the foreign-born population - Albania (%)
Place of birth for the foreign-born population - Belarus (%)
Place of birth for the foreign-born population - Bosnia and Herzegovina (%)
Place of birth for the foreign-born population - Bulgaria (%)
Place of birth for the foreign-born population - Croatia (%)
Place of birth for the foreign-born population - Czechoslovakia (%)
Place of birth for the foreign-born population - Hungary (%)
Place of birth for the foreign-born population - Latvia (%)
Place of birth for the foreign-born population - Lithuania (%)
Place of birth for the foreign-born population - North Macedonia (Macedonia) (%)
Place of birth for the foreign-born population - Moldova (%)
Place of birth for the foreign-born population - Poland (%)
Place of birth for the foreign-born population - Romania (%)
Place of birth for the foreign-born population - Russia (%)
Place of birth for the foreign-born population - Serbia (%)
Place of birth for the foreign-born population - Ukraine (%)
Place of birth for the foreign-born population - Other Eastern Europe (%)
Place of birth for the foreign-born population - China (%)
Place of birth for the foreign-born population - Hong Kong (%)
Place of birth for the foreign-born population - Taiwan (%)
Place of birth for the foreign-born population - Japan (%)
Place of birth for the foreign-born population - Korea (%)
Place of birth for the foreign-born population - Other Eastern Asia (%)
Place of birth for the foreign-born population - Afghanistan (%)
Place of birth for the foreign-born population - Bangladesh (%)
Place of birth for the foreign-born population - India (%)
Place of birth for the foreign-born population - Iran (%)
Place of birth for the foreign-born population - Kazakhstan (%)
Place of birth for the foreign-born population - Nepal (%)
Place of birth for the foreign-born population - Pakistan (%)
Place of birth for the foreign-born population - Sri Lanka (%)
Place of birth for the foreign-born population - Uzbekistan (%)
Place of birth for the foreign-born population - Other South Central Asia (%)
Place of birth for the foreign-born population - Burma (%)
Place of birth for the foreign-born population - Cambodia (%)
Place of birth for the foreign-born population - Indonesia (%)
Place of birth for the foreign-born population - Laos (%)
Place of birth for the foreign-born population - Malaysia (%)
Place of birth for the foreign-born population - Philippines (%)
Place of birth for the foreign-born population - Singapore (%)
Place of birth for the foreign-born population - Thailand (%)
Place of birth for the foreign-born population - Vietnam (%)
Place of birth for the foreign-born population - Other South Eastern Asia (%)
Place of birth for the foreign-born population - Armenia (%)
Place of birth for the foreign-born population - Iraq (%)
Place of birth for the foreign-born population - Israel (%)
Place of birth for the foreign-born population - Jordan (%)
Place of birth for the foreign-born population - Kuwait (%)
Place of birth for the foreign-born population - Lebanon (%)
Place of birth for the foreign-born population - Saudi Arabia (%)
Place of birth for the foreign-born population - Syria (%)
Place of birth for the foreign-born population - Turkey (%)
Place of birth for the foreign-born population - Yemen (%)
Place of birth for the foreign-born population - Other Western Asia (%)
Place of birth for the foreign-born population - Eritrea (%)
Place of birth for the foreign-born population - Ethiopia (%)
Place of birth for the foreign-born population - Kenya (%)
Place of birth for the foreign-born population - Somalia (%)
Place of birth for the foreign-born population - Uganda (%)
Place of birth for the foreign-born population - Zimbabwe (%)
Place of birth for the foreign-born population - Other Eastern Africa (%)
Place of birth for the foreign-born population - Cameroon (%)
Place of birth for the foreign-born population - Congo (%)
Place of birth for the foreign-born population - Democratic Republic of Congo (Zaire) (%)
Place of birth for the foreign-born population - Other Middle Africa (%)
Place of birth for the foreign-born population - Egypt (%)
Place of birth for the foreign-born population - Morocco (%)
Place of birth for the foreign-born population - Sudan (%)
Place of birth for the foreign-born population - Other Northern Africa (%)
Place of birth for the foreign-born population - South Africa (%)
Place of birth for the foreign-born population - Other Southern Africa (%)
Place of birth for the foreign-born population - Cabo Verde (%)
Place of birth for the foreign-born population - Ghana (%)
Place of birth for the foreign-born population - Liberia (%)
Place of birth for the foreign-born population - Nigeria (%)
Place of birth for the foreign-born population - Senegal (%)
Place of birth for the foreign-born population - Sierra Leone (%)
Place of birth for the foreign-born population - Other Western Africa (%)
Place of birth for the foreign-born population - Australia (%)
Place of birth for the foreign-born population - New Zealand (%)
Place of birth for the foreign-born population - Fiji (%)
Place of birth for the foreign-born population - Micronesia (%)
Place of birth for the foreign-born population - Bahamas (%)
Place of birth for the foreign-born population - Barbados (%)
Place of birth for the foreign-born population - Cuba (%)
Place of birth for the foreign-born population - Dominica (%)
Place of birth for the foreign-born population - Dominican Republic (%)
Place of birth for the foreign-born population - Grenada (%)
Place of birth for the foreign-born population - Haiti (%)
Place of birth for the foreign-born population - Jamaica (%)
Place of birth for the foreign-born population - St. Vincent and the Grenadines (%)
Place of birth for the foreign-born population - Trinidad and Tobago (%)
Place of birth for the foreign-born population - West Indies (%)
Place of birth for the foreign-born population - Other Caribbean (%)
Place of birth for the foreign-born population - Belize (%)
Place of birth for the foreign-born population - Costa Rica (%)
Place of birth for the foreign-born population - El Salvador (%)
Place of birth for the foreign-born population - Guatemala (%)
Place of birth for the foreign-born population - Honduras (%)
Place of birth for the foreign-born population - Mexico (%)
Place of birth for the foreign-born population - Nicaragua (%)
Place of birth for the foreign-born population - Panama (%)
Place of birth for the foreign-born population - Other Central America (%)
Place of birth for the foreign-born population - Argentina (%)
Place of birth for the foreign-born population - Bolivia (%)
Place of birth for the foreign-born population - Brazil (%)
Place of birth for the foreign-born population - Chile (%)
Place of birth for the foreign-born population - Colombia (%)
Place of birth for the foreign-born population - Ecuador (%)
Place of birth for the foreign-born population - Guyana (%)
Place of birth for the foreign-born population - Peru (%)
Place of birth for the foreign-born population - Uruguay (%)
Place of birth for the foreign-born population - Venezuela (%)
Place of birth for the foreign-born population - Other South America (%)
Place of birth for the foreign-born population - Canada (%)
Place of birth for the foreign-born population - Other Northern America (%)
Place of birth for the foreign-born population - Other (%)
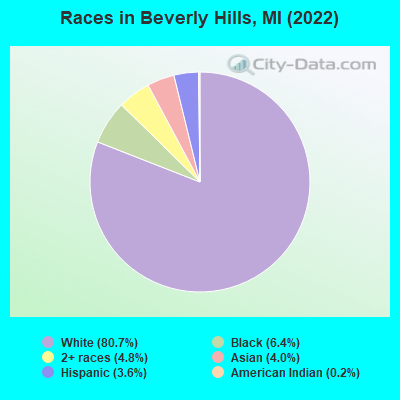
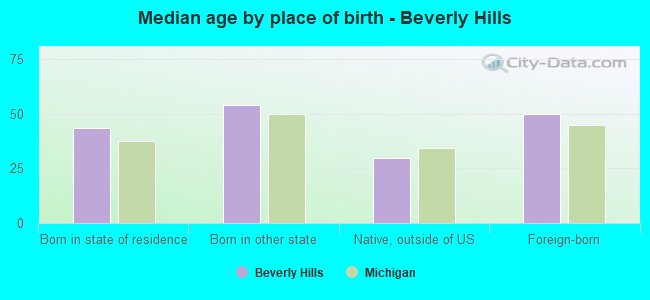
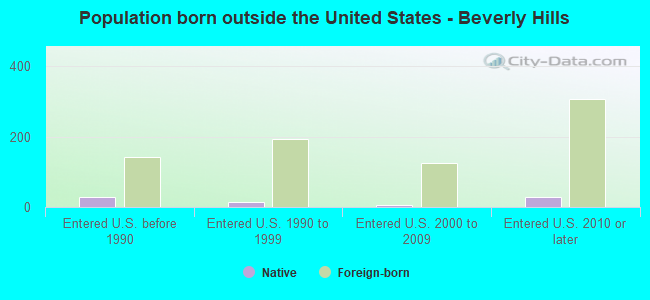
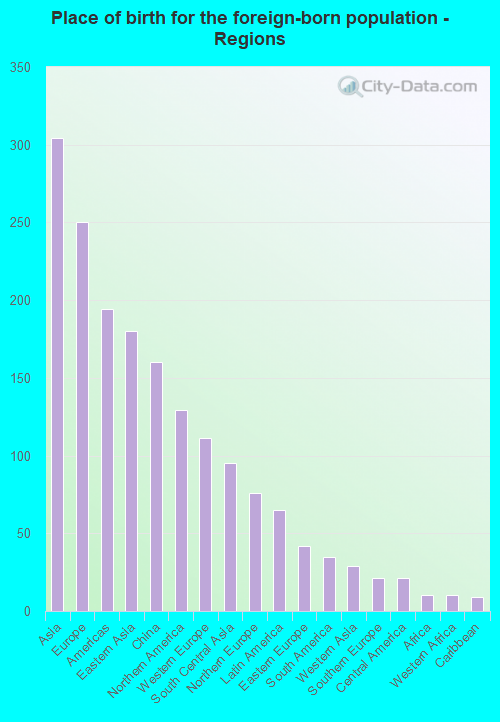
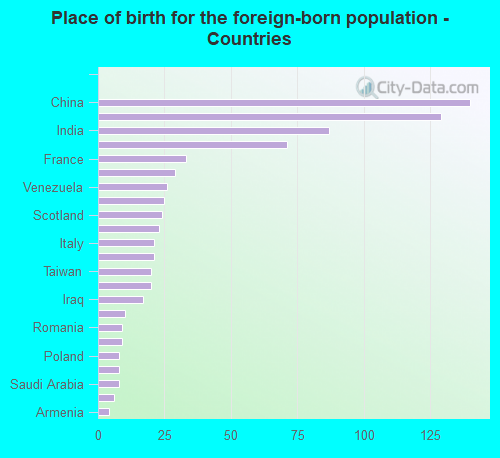
According to 2022 data, the most numerous races in Beverly Hills, MI are White alone (8,499 residents), Black alone (673 residents), and Hispanic (382 residents). 92.2% of Beverly Hills residents speak English at home. 7.2% of Beverly Hills, MI residents are foreign-born (2.9% born in Asia, 2.4% born in Europe, 1.2% born in North America), which is 16.7% greater than the foreign-born rate of 6.0% across the entire state of Michigan.
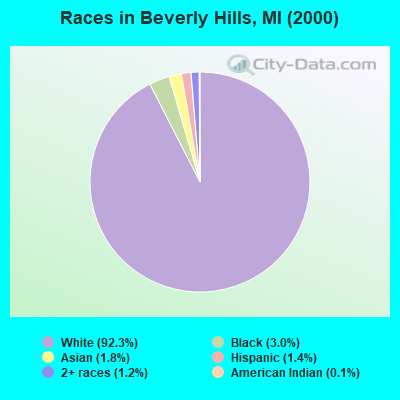
Race distribution in Beverly Hills
2000 2022
7,806,691 78.6% White alone 1,402,047 14.1% Black alone 323,877 3.3% Hispanic 175,311 1.8% Asian alone 163,487 1.6% Two or more races 53,421 0.5% American Indian alone 11,465 0.1% Other race alone 2,145 0.02% Native Hawaiian and Other
7,289,051 72.6% White alone 1,310,464 13.1% Black alone 572,405 5.7% Hispanic 450,031 4.5% Two or more races 335,732 3.3% Asian alone 45,217 0.5% Other race alone 29,011 0.3% American Indian alone 2,207 0.02% Native Hawaiian and Other
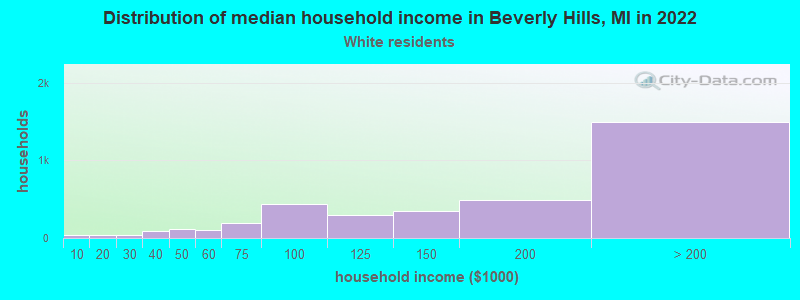
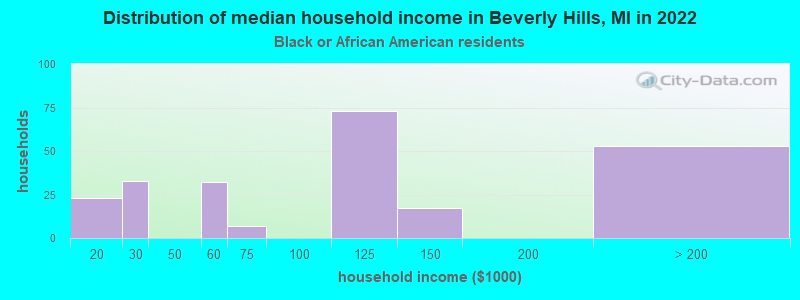
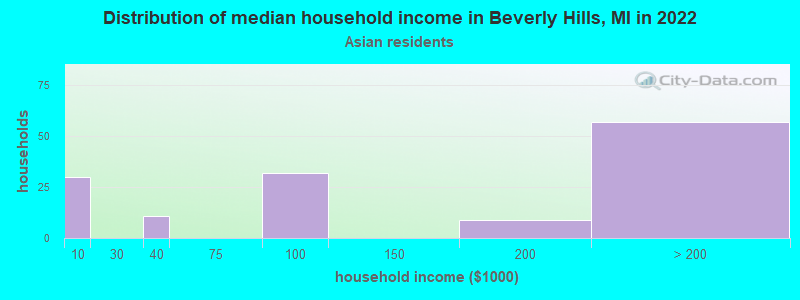
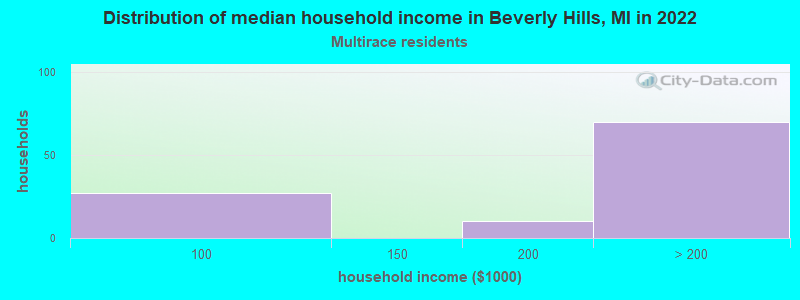
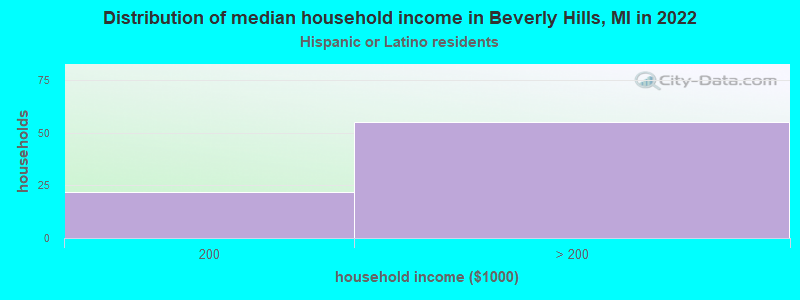
Income and house value in Beverly Hills Median household income in 2022 $159,115 White non-Hispanic householders$110,973 Black householdersover $200,000 Two or more races householdersover $200,000 Hispanic or Latino race householdersMedian 2022 house value $507,578 White Non-Hispanic householders$498,264 Black or African American householders$209,550 American Indian or Alaska Native householders $476,098 Asian householders$158,327 Native Hawaiian and other Pacific Islander householders$512,234 Some other race householders$230,598 Two or more races householders$585,437 Hispanic or Latino householders
Median age by race in Beverly Hills
50.1 Median age for White residents48.4 51.1 40.3 Median age for Black or African American residents32.0 40.8 18.6 Median age for American Indian / Alaska Native residents-505,050,504.5 -728,395,061.0 43.7 Median age for Asian residents54.0 40.3 -670,531,400.3 Median age for Native Hawaiian / Pacific Islander residents-674,772,035.8 -699,588,476.7 -641,545,893.1 Median age for Other race residents-685,416,666.0 -604,609,928.5 11.6 Median age for Two or more races residents11.8 20.7 49.8 Median age for White alone residents48.0 51.0 34.5 Median age for Hispanic or Latino residents5.5 42.9
Owner/renter occupied households by race in Beverly Hills
House owners and renters - White residents 3,586 96.6% Owner occupied128 3.4% Renter occupiedHouse owners and renters - Black or African American residents 119 52.0% Owner occupied110 48.0% Renter occupiedHouse owners and renters - Asian residents 124 93.7% Owner occupied8 6.3% Renter occupiedHouse owners and renters - Two or more races residents 128 100.0% Owner occupiedHouse owners and renters - White alone residents 3,548 96.5% Owner occupied129 3.5% Renter occupiedHouse owners and renters - Hispanic or Latino residents 81 100.0% Owner occupied
Language usage in Beverly Hills
English speakers - Total 92.2% of residents of Beverly Hills speak English at home.
0.6% of residents speak Spanish at home 52 82.5% Speak English very well11 17.5% Speak English less than very well6.8% of residents speak other language at home 413 61.5% Speak English very well259 38.5% Speak English less than very well
English speakers - Born in the United States 99.5% of residents of Beverly Hills speak English at home.
0.4% of residents speak other language at home 8 100.0% Speak English very well
English speakers - Native, born elsewhere 40.5% of residents of Beverly Hills speak English at home.
66.2% of residents speak other language at home 36 73.5% Speak English very well13 26.5% Speak English less than very well
English speakers - Foreign-born 32.6% of residents of Beverly Hills speak English at home.
5.2% of residents speak Spanish at home 28 70.0% Speak English very well12 30.0% Speak English less than very well60.3% of residents speak other language at home 291 63.1% Speak English very well170 36.9% Speak English less than very well
White (Caucasian) - Speak only English Native:
98.3% (7,624)Foreign-born:
49.6% (182)
White (Caucasian) - Speak another language Native:
1.9% (145)Foreign-born:
52.4% (192)
Black or African American - Speak only English Native:
98.5% (630)Foreign-born:
69.8% (10)
Asian - Speak only English Native:
50.5% (58)Foreign-born:
15.5% (45)
Asian - Speak another language Native:
49.4% (57)Foreign-born:
84.7% (243)
Two or more races - Speak only English Native:
97.7% (501)Foreign-born:
20.4% (11)
Two or more races - Speak another language Native:
2.1% (11)Foreign-born:
78.5% (43)
White alone - Speak only English Native:
97.9% (7,595)Foreign-born:
52.5% (184)
White alone - Speak another language Native:
2.0% (155)Foreign-born:
48.9% (171)
Hispanic or Latino - Speak only English Native:
87.8% (171)Foreign-born:
10.1% (8)
Hispanic or Latino - Speak another language Native:
9.2% (18)Foreign-born:
88.2% (73)
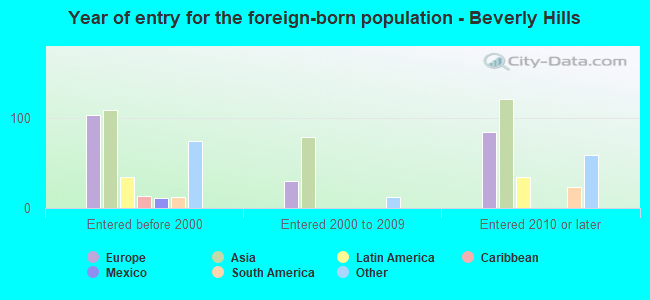
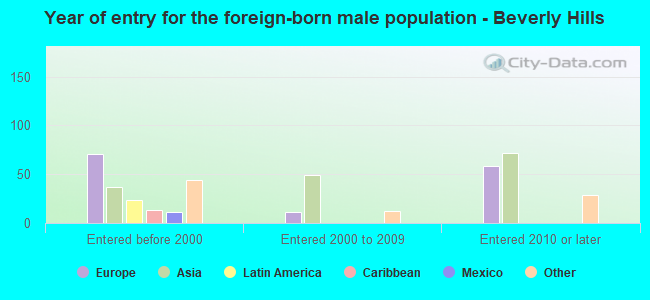
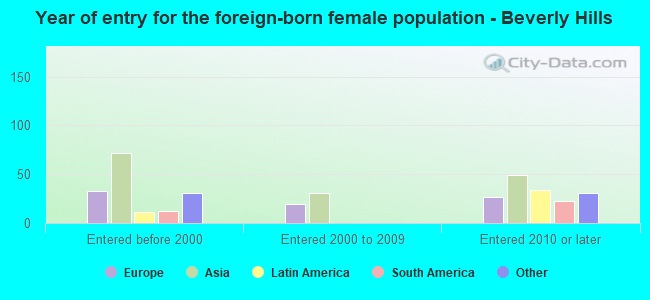
Foreign-born residents in Beverly Hills 758 residents are foreign born (2.9% Asia , 2.4% Europe , 1.2% North America ).
This city:
7.2%Michigan:
6.9%
Marital status for residents in Beverly Hills Marital status - White (Caucasian) population 15 years and over
Males 19.7% Never married71.0% Now married0.0% Separated3.0% Widowed6.3% DivorcedFemales 18.0% Never married62.1% Now married0.0% Separated7.6% Widowed12.3% DivorcedWomen who gave birth in the past 12 months Now married:
100.0% (41)Unmarried:
0.0% (0)
Women who did not give birth in the past 12 months Now married:
58.2% (891)Unmarried:
41.8% (641)
Marital status - Black or African American population 15 years and over
Males 50.7% Never married31.9% Now married0.0% Separated0.0% Widowed17.5% DivorcedFemales 25.5% Never married38.7% Now married0.0% Separated3.2% Widowed32.6% DivorcedWomen who did not give birth in the past 12 months Now married:
46.4% (94)Unmarried:
53.6% (109)
Marital status - American Indian / Alaska Native population 15 years and over
Males 0.0% Never married100.0% Now married0.0% Separated0.0% Widowed0.0% DivorcedFemales 100.0% Never married0.0% Now married0.0% Separated0.0% Widowed0.0% DivorcedWomen who did not give birth in the past 12 months Now married:
0.0% (0)Unmarried:
100.0% (9)
Marital status - Asian population 15 years and over
Males 18.2% Never married62.3% Now married0.0% Separated0.0% Widowed19.5% DivorcedFemales 5.8% Never married94.2% Now married0.0% Separated0.0% Widowed0.0% DivorcedWomen who did not give birth in the past 12 months Now married:
91.6% (88)Unmarried:
8.4% (8)
Marital status - Two or more races population 15 years and over
Males 38.5% Never married52.1% Now married0.0% Separated0.0% Widowed9.4% DivorcedFemales 13.7% Never married74.1% Now married0.0% Separated0.0% Widowed12.2% DivorcedWomen who gave birth in the past 12 months Now married:
100.0% (17)Unmarried:
0.0% (0)
Women who did not give birth in the past 12 months Now married:
72.9% (71)Unmarried:
27.1% (26)
Marital status - White alone, not Hispanic / Latino population 15 years and over
Males 19.8% Never married70.9% Now married0.0% Separated3.0% Widowed6.3% DivorcedFemales 18.5% Never married60.9% Now married0.0% Separated7.8% Widowed12.7% DivorcedWomen who gave birth in the past 12 months Now married:
100.0% (42)Unmarried:
0.0% (0)
Women who did not give birth in the past 12 months Now married:
55.5% (815)Unmarried:
44.5% (652)
Marital status - Hispanic or Latino population 15 years and over
Males 14.8% Never married71.6% Now married0.0% Separated0.0% Widowed13.6% DivorcedFemales 5.6% Never married94.4% Now married0.0% Separated0.0% Widowed0.0% DivorcedWomen who gave birth in the past 12 months Now married:
100.0% (9)Unmarried:
0.0% (0)
Women who did not give birth in the past 12 months Now married:
91.3% (103)Unmarried:
8.7% (10)
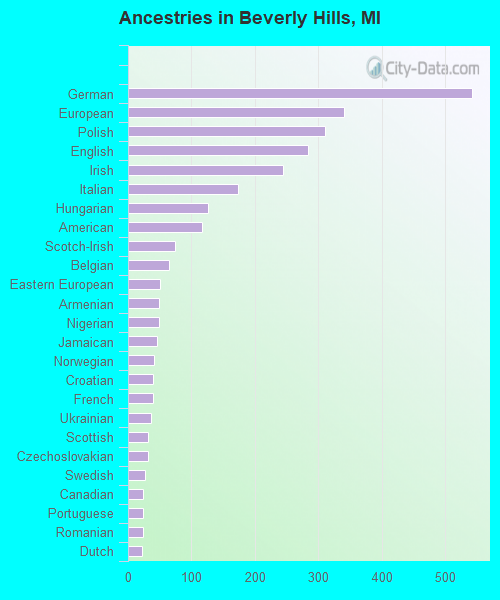
Ancestries in Beverly Hills
542 12.8% German340 8.0% European311 7.3% Polish284 6.7% English244 5.8% Irish173 4.1% Italian126 3.0% Hungarian116 2.7% American74 1.7% Scotch-Irish65 1.5% Belgian51 1.2% Eastern European49 1.2% Armenian49 1.2% Nigerian45 1.1% Jamaican41 1.0% Norwegian39 0.9% Croatian39 0.9% French36 0.8% Ukrainian32 0.8% Scottish31 0.7% Czechoslovakian27 0.6% Swedish24 0.6% Canadian24 0.6% Portuguese24 0.6% Romanian22 0.5% Dutch20 0.5% Lebanese19 0.4% British18 0.4% Welsh17 0.4% Yugoslavian16 0.4% Danish16 0.4% French Canadian11 0.3% Syrian11 0.3% Scandinavian10 0.2% Greek7 0.2% Lithuanian7 0.2% Russian7 0.2% Slovak5 0.1% Czech4 0.09% Northern European
Children Nativity (place of birth) in Beverly Hills
Children under 6 years - Living with two parents Both parents native 514 100.0% NativeBoth parents foreign-born 91 100.0% NativeOne native, one foreign-born parent 44 100.0% NativeChildren under 6 years - Living with one parent Native parent 130 100.0% NativeForeign-born parent 11 100.0% NativeChildren 6 to 17 years - Living with two parents Both parents native 964 100.0% NativeBoth parents foreign-born 45 37.4% Native76 62.6% Foreign-bornOne native, one foreign-born parent 138 100.0% NativeChildren 6 to 17 years - Living with one parent Native parent 414 100.0% NativeForeign-born parent 31 46.9% Native36 53.1% Foreign-born