Races in Biloxi, Mississippi (MS) Detailed Stats
Data:
Races - White alone (%)
Races - White alone (% change since 2000)
Races - Black alone (%)
Races - Black alone (% change since 2000)
Races - American Indian alone (%)
Races - American Indian alone (% change since 2000)
Races - Asian alone (%)
Races - Asian alone (% change since 2000)
Races - Hispanic (%)
Races - Hispanic (% change since 2000)
Races - Native Hawaiian and Other Pacific Islander alone (%)
Races - Native Hawaiian and Other Pacific Islander alone (% change since 2000)
Races - Two or more races(%)
Races - Two or more races(% change since 2000)
Races - Other race alone (%)
Races - Other race alone (% change since 2000)
Racial diversity
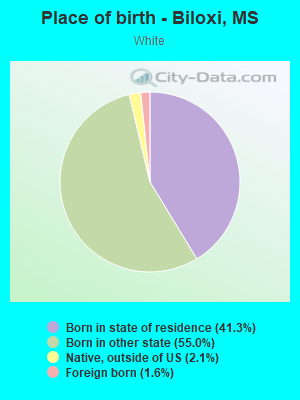
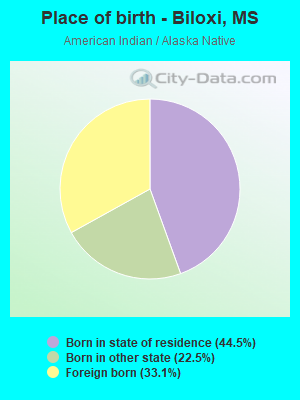
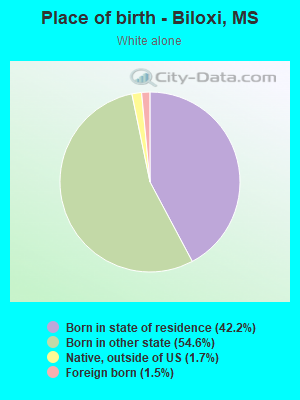
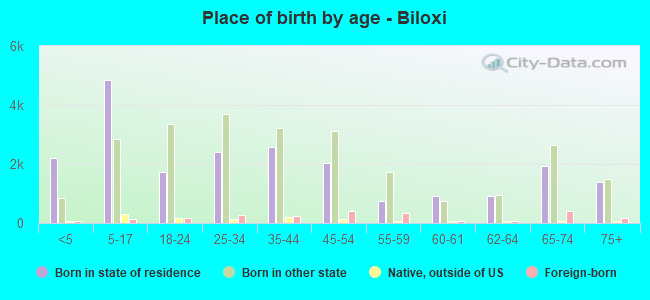
Place of birth - Born in state of residence (%)
Place of birth - Born in state of residence (%) - White
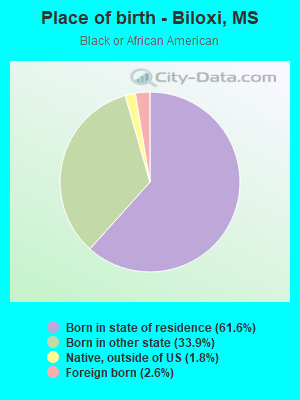
Place of birth - Born in state of residence (%) - Black or African American
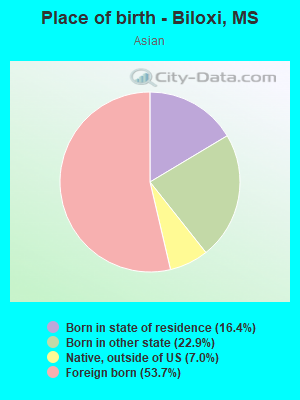
Place of birth - Born in state of residence (%) - Asian
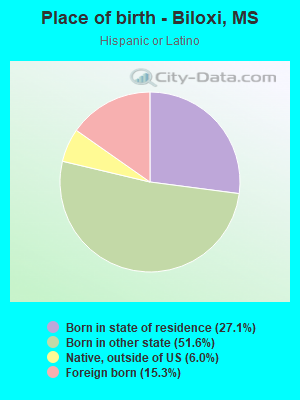
Place of birth - Born in state of residence (%) - Hispanic or Latino
Place of birth - Born in state of residence (%) - American Indian and Alaska Native
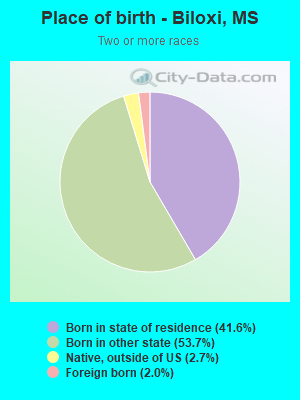
Place of birth - Born in state of residence (%) - Multirace
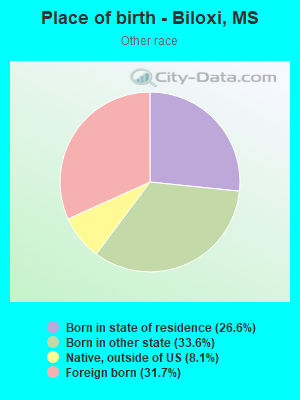
Place of birth - Born in state of residence (%) - Other Race
Place of birth - Born in other state (%)
Place of birth - Born in other state (%) - White
Place of birth - Born in other state (%) - Black or African American
Place of birth - Born in other state (%) - Asian
Place of birth - Born in other state (%) - Hispanic or Latino
Place of birth - Born in other state (%) - American Indian and Alaska Native
Place of birth - Born in other state (%) - Multirace
Place of birth - Born in other state (%) - Other Race
Place of birth - Native, outside of US (%)
Place of birth - Native, outside of US (%) - White
Place of birth - Native, outside of US (%) - Black or African American
Place of birth - Native, outside of US (%) - Asian
Place of birth - Native, outside of US (%) - Hispanic or Latino
Place of birth - Native, outside of US (%) - American Indian and Alaska Native
Place of birth - Native, outside of US (%) - Multirace
Place of birth - Native, outside of US (%) - Other Race
Place of birth - Foreign born (%)
Place of birth - Foreign born (%) - White
Place of birth - Foreign born (%) - Black or African American
Place of birth - Foreign born (%) - Asian
Place of birth - Foreign born (%) - Hispanic or Latino
Place of birth - Foreign born (%) - American Indian and Alaska Native
Place of birth - Foreign born (%) - Multirace
Place of birth - Foreign born (%) - Other Race
Residents speaking English at home (%)
Residents speaking English at home - Born in the United States (%)
Residents speaking English at home - Native, born elsewhere (%)
Residents speaking English at home - Foreign born (%)
Residents speaking Spanish at home (%)
Residents speaking Spanish at home - Born in the United States (%)
Residents speaking Spanish at home - Native, born elsewhere (%)
Residents speaking Spanish at home - Foreign born (%)
Residents speaking other language at home (%)
Residents speaking other language at home - Born in the United States (%)
Residents speaking other language at home - Native, born elsewhere (%)
Residents speaking other language at home - Foreign born (%)
Marital status - Never married (%)
Marital status - Now married (%)
Marital status - Separated (%)
Marital status - Widowed (%)
Marital status - Divorced (%)
Ancestries Reported - Arab (%)
Ancestries Reported - Czech (%)
Ancestries Reported - Danish (%)
Ancestries Reported - Dutch (%)
Ancestries Reported - English (%)
Ancestries Reported - French (%)
Ancestries Reported - French Canadian (%)
Ancestries Reported - German (%)
Ancestries Reported - Greek (%)
Ancestries Reported - Hungarian (%)
Ancestries Reported - Irish (%)
Ancestries Reported - Italian (%)
Ancestries Reported - Lithuanian (%)
Ancestries Reported - Norwegian (%)
Ancestries Reported - Polish (%)
Ancestries Reported - Portuguese (%)
Ancestries Reported - Russian (%)
Ancestries Reported - Scotch-Irish (%)
Ancestries Reported - Scottish (%)
Ancestries Reported - Slovak (%)
Ancestries Reported - Subsaharan African (%)
Ancestries Reported - Swedish (%)
Ancestries Reported - Swiss (%)
Ancestries Reported - Ukrainian (%)
Ancestries Reported - United States (%)
Ancestries Reported - Welsh (%)
Ancestries Reported - West Indian (%)
Ancestries Reported - Other (%)
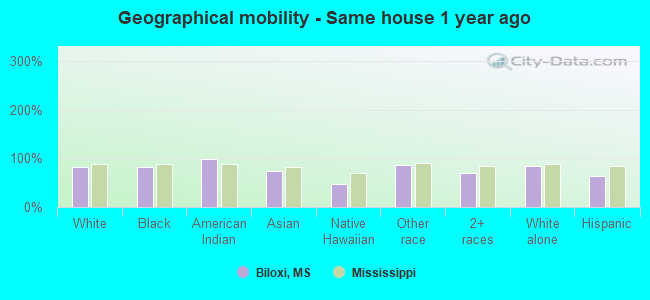
Geographical mobility - Same house 1 year ago (%)
Geographical mobility - Same house 1 year ago (%) - White
Geographical mobility - Same house 1 year ago (%) - Black or African American
Geographical mobility - Same house 1 year ago (%) - Asian
Geographical mobility - Same house 1 year ago (%) - Hispanic or Latino
Geographical mobility - Same house 1 year ago (%) - American Indian and Alaska Native
Geographical mobility - Same house 1 year ago (%) - Multirace
Geographical mobility - Same house 1 year ago (%) - Other Race
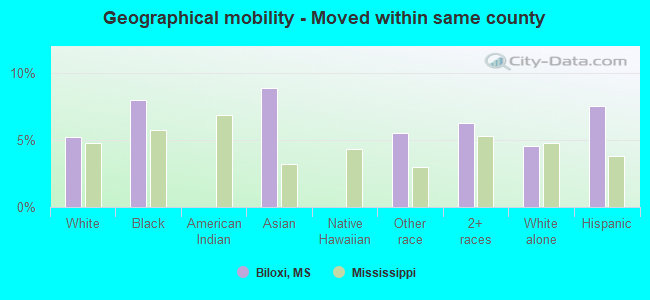
Geographical mobility - Moved within same county (%)
Geographical mobility - Moved within same county (%) - White
Geographical mobility - Moved within same county (%) - Black or African American
Geographical mobility - Moved within same county (%) - Asian
Geographical mobility - Moved within same county (%) - Hispanic or Latino
Geographical mobility - Moved within same county (%) - American Indian and Alaska Native
Geographical mobility - Moved within same county (%) - Multirace
Geographical mobility - Moved within same county (%) - Other Race
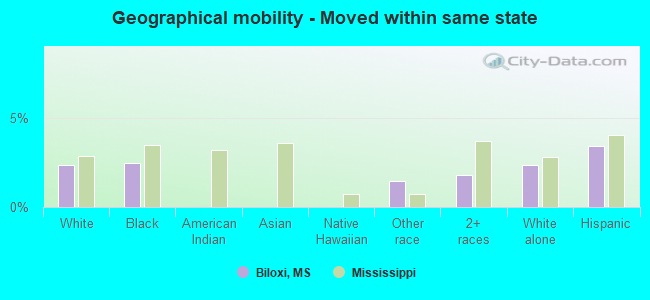
Geographical mobility - Moved from different county within same state (%)
Geographical mobility - Moved from different county within same state (%) - White
Geographical mobility - Moved from different county within same state (%) - Black or African American
Geographical mobility - Moved from different county within same state (%) - Asian
Geographical mobility - Moved from different county within same state (%) - Hispanic or Latino
Geographical mobility - Moved from different county within same state (%) - American Indian and Alaska Native
Geographical mobility - Moved from different county within same state (%) - Multirace
Geographical mobility - Moved from different county within same state (%) - Other Race
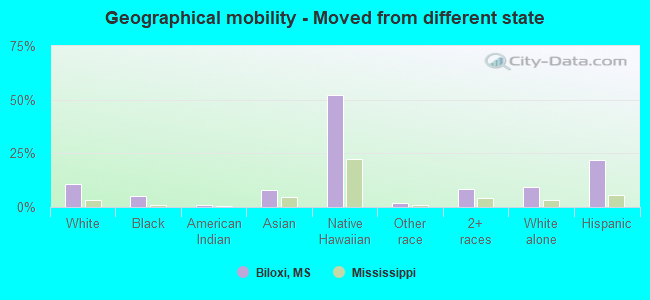
Geographical mobility - Moved from different state (%)
Geographical mobility - Moved from different state (%) - White
Geographical mobility - Moved from different state (%) - Black or African American
Geographical mobility - Moved from different state (%) - Asian
Geographical mobility - Moved from different state (%) - Hispanic or Latino
Geographical mobility - Moved from different state (%) - American Indian and Alaska Native
Geographical mobility - Moved from different state (%) - Multirace
Geographical mobility - Moved from different state (%) - Other Race
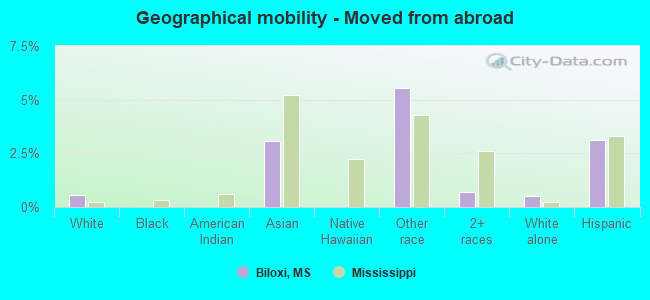
Geographical mobility - Moved from abroad (%)
Geographical mobility - Moved from abroad (%) - White
Geographical mobility - Moved from abroad (%) - Black or African American
Geographical mobility - Moved from abroad (%) - Asian
Geographical mobility - Moved from abroad (%) - Hispanic or Latino
Geographical mobility - Moved from abroad (%) - American Indian and Alaska Native
Geographical mobility - Moved from abroad (%) - Multirace
Geographical mobility - Moved from abroad (%) - Other Race
Place of birth for the foreign-born population - Ireland (%)
Place of birth for the foreign-born population - Denmark (%)
Place of birth for the foreign-born population - Norway (%)
Place of birth for the foreign-born population - Sweden (%)
Place of birth for the foreign-born population - United Kingdom (%)
Place of birth for the foreign-born population - England (%)
Place of birth for the foreign-born population - Scotland (%)
Place of birth for the foreign-born population - Other Northern Europe (%)
Place of birth for the foreign-born population - Austria (%)
Place of birth for the foreign-born population - Belgium (%)
Place of birth for the foreign-born population - France (%)
Place of birth for the foreign-born population - Germany (%)
Place of birth for the foreign-born population - Netherlands (%)
Place of birth for the foreign-born population - Switzerland (%)
Place of birth for the foreign-born population - Other Western Europe (%)
Place of birth for the foreign-born population - Greece (%)
Place of birth for the foreign-born population - Italy (%)
Place of birth for the foreign-born population - Portugal (%)
Place of birth for the foreign-born population - Spain (%)
Place of birth for the foreign-born population - Other Southern Europe (%)
Place of birth for the foreign-born population - Albania (%)
Place of birth for the foreign-born population - Belarus (%)
Place of birth for the foreign-born population - Bosnia and Herzegovina (%)
Place of birth for the foreign-born population - Bulgaria (%)
Place of birth for the foreign-born population - Croatia (%)
Place of birth for the foreign-born population - Czechoslovakia (%)
Place of birth for the foreign-born population - Hungary (%)
Place of birth for the foreign-born population - Latvia (%)
Place of birth for the foreign-born population - Lithuania (%)
Place of birth for the foreign-born population - North Macedonia (Macedonia) (%)
Place of birth for the foreign-born population - Moldova (%)
Place of birth for the foreign-born population - Poland (%)
Place of birth for the foreign-born population - Romania (%)
Place of birth for the foreign-born population - Russia (%)
Place of birth for the foreign-born population - Serbia (%)
Place of birth for the foreign-born population - Ukraine (%)
Place of birth for the foreign-born population - Other Eastern Europe (%)
Place of birth for the foreign-born population - China (%)
Place of birth for the foreign-born population - Hong Kong (%)
Place of birth for the foreign-born population - Taiwan (%)
Place of birth for the foreign-born population - Japan (%)
Place of birth for the foreign-born population - Korea (%)
Place of birth for the foreign-born population - Other Eastern Asia (%)
Place of birth for the foreign-born population - Afghanistan (%)
Place of birth for the foreign-born population - Bangladesh (%)
Place of birth for the foreign-born population - India (%)
Place of birth for the foreign-born population - Iran (%)
Place of birth for the foreign-born population - Kazakhstan (%)
Place of birth for the foreign-born population - Nepal (%)
Place of birth for the foreign-born population - Pakistan (%)
Place of birth for the foreign-born population - Sri Lanka (%)
Place of birth for the foreign-born population - Uzbekistan (%)
Place of birth for the foreign-born population - Other South Central Asia (%)
Place of birth for the foreign-born population - Burma (%)
Place of birth for the foreign-born population - Cambodia (%)
Place of birth for the foreign-born population - Indonesia (%)
Place of birth for the foreign-born population - Laos (%)
Place of birth for the foreign-born population - Malaysia (%)
Place of birth for the foreign-born population - Philippines (%)
Place of birth for the foreign-born population - Singapore (%)
Place of birth for the foreign-born population - Thailand (%)
Place of birth for the foreign-born population - Vietnam (%)
Place of birth for the foreign-born population - Other South Eastern Asia (%)
Place of birth for the foreign-born population - Armenia (%)
Place of birth for the foreign-born population - Iraq (%)
Place of birth for the foreign-born population - Israel (%)
Place of birth for the foreign-born population - Jordan (%)
Place of birth for the foreign-born population - Kuwait (%)
Place of birth for the foreign-born population - Lebanon (%)
Place of birth for the foreign-born population - Saudi Arabia (%)
Place of birth for the foreign-born population - Syria (%)
Place of birth for the foreign-born population - Turkey (%)
Place of birth for the foreign-born population - Yemen (%)
Place of birth for the foreign-born population - Other Western Asia (%)
Place of birth for the foreign-born population - Eritrea (%)
Place of birth for the foreign-born population - Ethiopia (%)
Place of birth for the foreign-born population - Kenya (%)
Place of birth for the foreign-born population - Somalia (%)
Place of birth for the foreign-born population - Uganda (%)
Place of birth for the foreign-born population - Zimbabwe (%)
Place of birth for the foreign-born population - Other Eastern Africa (%)
Place of birth for the foreign-born population - Cameroon (%)
Place of birth for the foreign-born population - Congo (%)
Place of birth for the foreign-born population - Democratic Republic of Congo (Zaire) (%)
Place of birth for the foreign-born population - Other Middle Africa (%)
Place of birth for the foreign-born population - Egypt (%)
Place of birth for the foreign-born population - Morocco (%)
Place of birth for the foreign-born population - Sudan (%)
Place of birth for the foreign-born population - Other Northern Africa (%)
Place of birth for the foreign-born population - South Africa (%)
Place of birth for the foreign-born population - Other Southern Africa (%)
Place of birth for the foreign-born population - Cabo Verde (%)
Place of birth for the foreign-born population - Ghana (%)
Place of birth for the foreign-born population - Liberia (%)
Place of birth for the foreign-born population - Nigeria (%)
Place of birth for the foreign-born population - Senegal (%)
Place of birth for the foreign-born population - Sierra Leone (%)
Place of birth for the foreign-born population - Other Western Africa (%)
Place of birth for the foreign-born population - Australia (%)
Place of birth for the foreign-born population - New Zealand (%)
Place of birth for the foreign-born population - Fiji (%)
Place of birth for the foreign-born population - Micronesia (%)
Place of birth for the foreign-born population - Bahamas (%)
Place of birth for the foreign-born population - Barbados (%)
Place of birth for the foreign-born population - Cuba (%)
Place of birth for the foreign-born population - Dominica (%)
Place of birth for the foreign-born population - Dominican Republic (%)
Place of birth for the foreign-born population - Grenada (%)
Place of birth for the foreign-born population - Haiti (%)
Place of birth for the foreign-born population - Jamaica (%)
Place of birth for the foreign-born population - St. Vincent and the Grenadines (%)
Place of birth for the foreign-born population - Trinidad and Tobago (%)
Place of birth for the foreign-born population - West Indies (%)
Place of birth for the foreign-born population - Other Caribbean (%)
Place of birth for the foreign-born population - Belize (%)
Place of birth for the foreign-born population - Costa Rica (%)
Place of birth for the foreign-born population - El Salvador (%)
Place of birth for the foreign-born population - Guatemala (%)
Place of birth for the foreign-born population - Honduras (%)
Place of birth for the foreign-born population - Mexico (%)
Place of birth for the foreign-born population - Nicaragua (%)
Place of birth for the foreign-born population - Panama (%)
Place of birth for the foreign-born population - Other Central America (%)
Place of birth for the foreign-born population - Argentina (%)
Place of birth for the foreign-born population - Bolivia (%)
Place of birth for the foreign-born population - Brazil (%)
Place of birth for the foreign-born population - Chile (%)
Place of birth for the foreign-born population - Colombia (%)
Place of birth for the foreign-born population - Ecuador (%)
Place of birth for the foreign-born population - Guyana (%)
Place of birth for the foreign-born population - Peru (%)
Place of birth for the foreign-born population - Uruguay (%)
Place of birth for the foreign-born population - Venezuela (%)
Place of birth for the foreign-born population - Other South America (%)
Place of birth for the foreign-born population - Canada (%)
Place of birth for the foreign-born population - Other Northern America (%)
Place of birth for the foreign-born population - Other (%)
Latest news about races in Biloxi, MS collected exclusively by city-data.com from local newspapers, TV, and radio stations
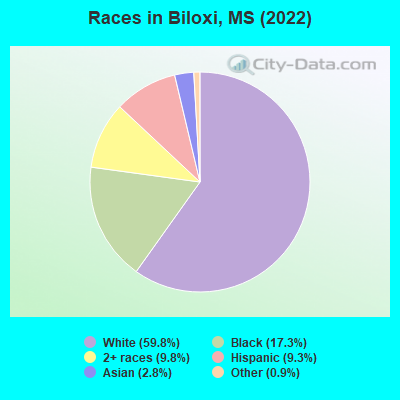
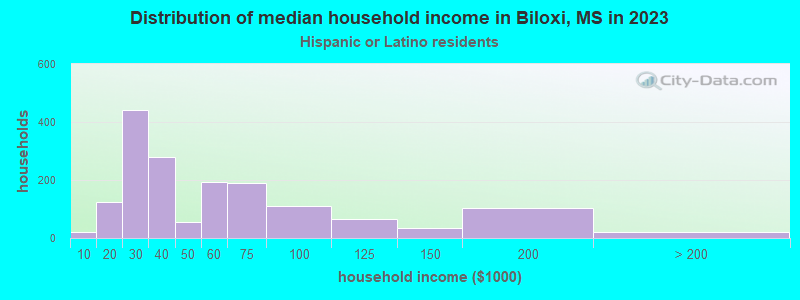
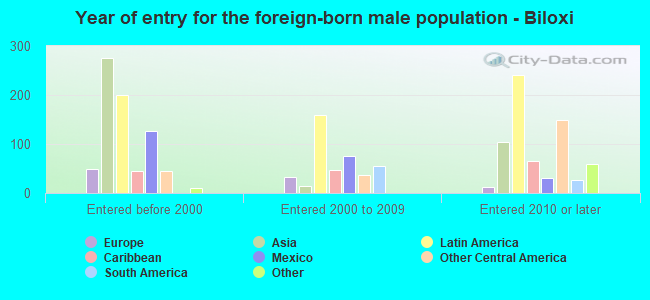
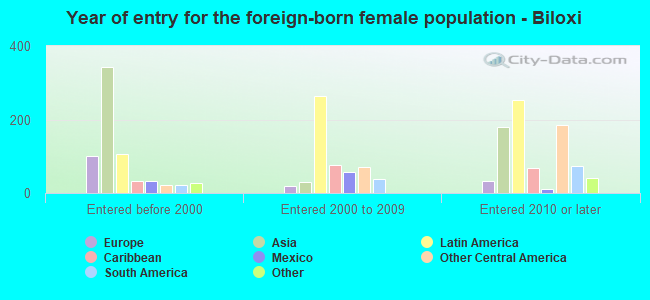
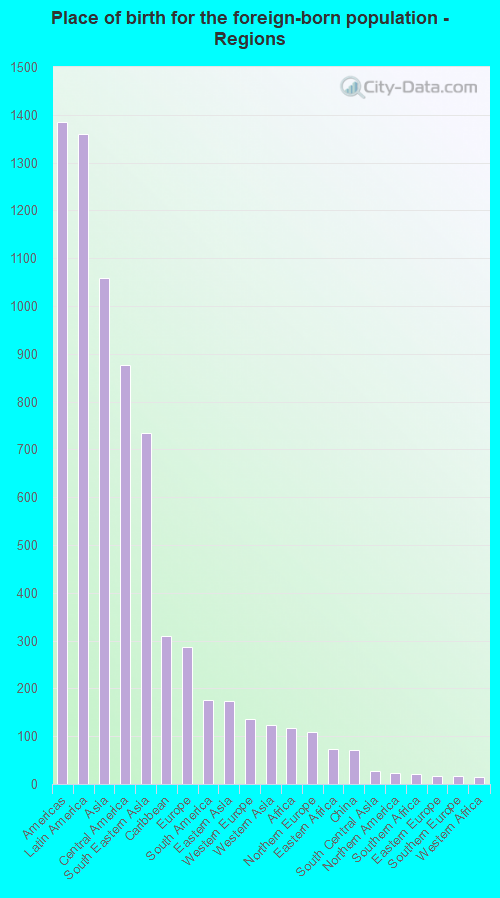
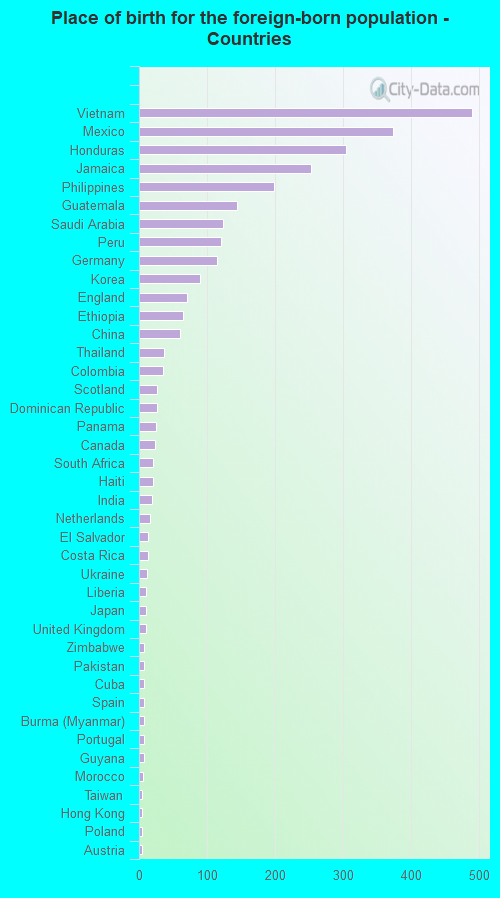
According to 2022 data, the most numerous races in Biloxi, MS are White alone (29,700 residents), Black alone (8,579 residents), and Hispanic (4,627 residents). 90.5% of Biloxi residents speak English at home. 5.7% of Biloxi, MS residents are foreign-born (2.7% born in Latin America, 2.1% born in Asia, 0.6% born in Europe), which is 65.1% greater than the foreign-born rate of 2.0% across the entire state of Mississippi.
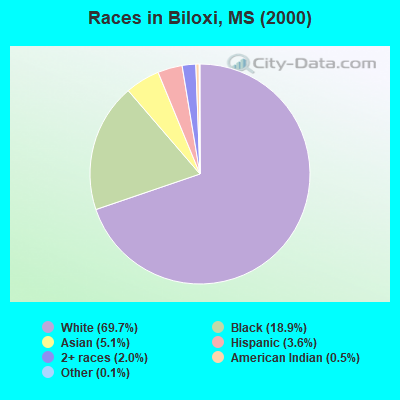
Race distribution in Biloxi
2000 2022
35,292 69.7% White alone 9,569 18.9% Black alone 2,558 5.1% Asian alone 1,848 3.6% Hispanic 1,020 2.0% Two or more races 232 0.5% American Indian alone 75 0.1% Other race alone 50 0.10% Native Hawaiian and Other
29,700 59.8% White alone 8,579 17.3% Black alone 4,881 9.8% Two or more races 4,627 9.3% Hispanic 1,394 2.8% Asian alone 452 0.9% Other race alone 36 0.07% American Indian alone 16 0.03% Native Hawaiian and Other
2000 2022
1,727,908 60.7% White alone 1,028,473 36.2% Black alone 39,569 1.4% Hispanic 17,272 0.6% Two or more races 18,349 0.6% Asian alone 11,224 0.4% American Indian alone 1,294 0.05% Other race alone 569 0.02% Native Hawaiian and Other
1,625,979 55.3% White alone 1,072,962 36.5% Black alone 97,177 3.3% Hispanic 96,367 3.3% Two or more races 25,217 0.9% Asian alone 12,457 0.4% American Indian alone 9,501 0.3% Other race alone 397 0.01% Native Hawaiian and Other
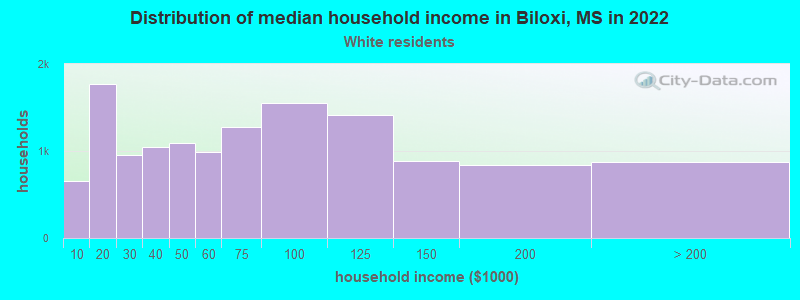
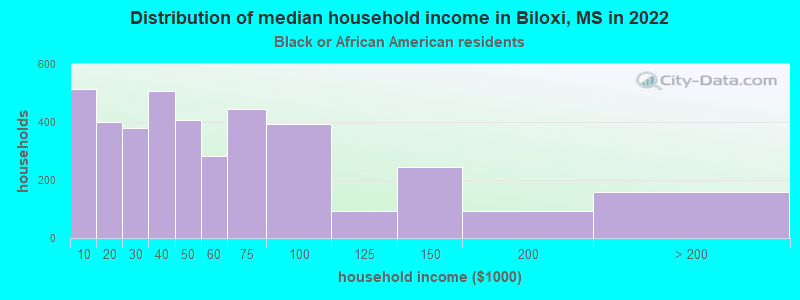
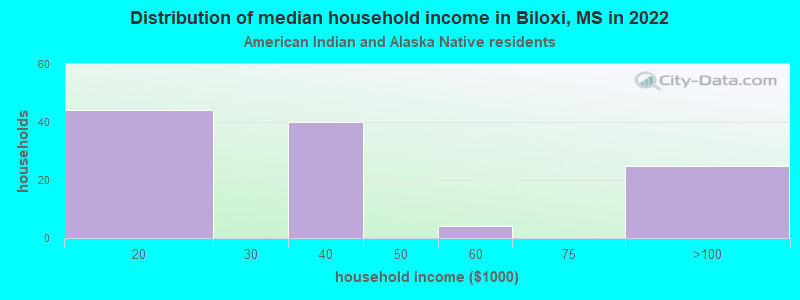
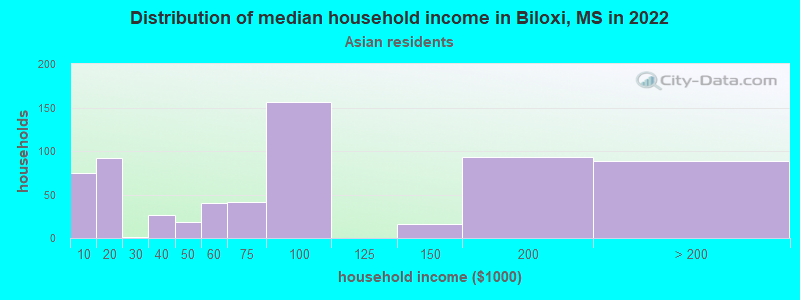
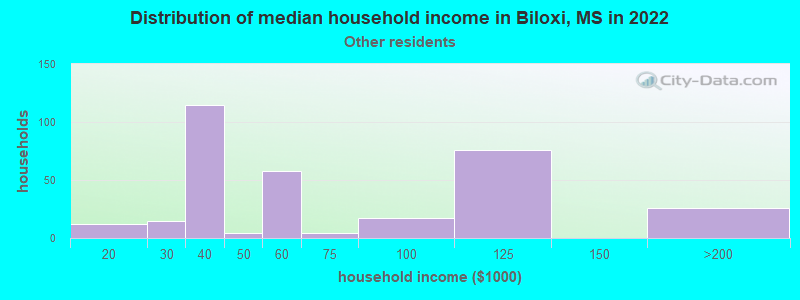
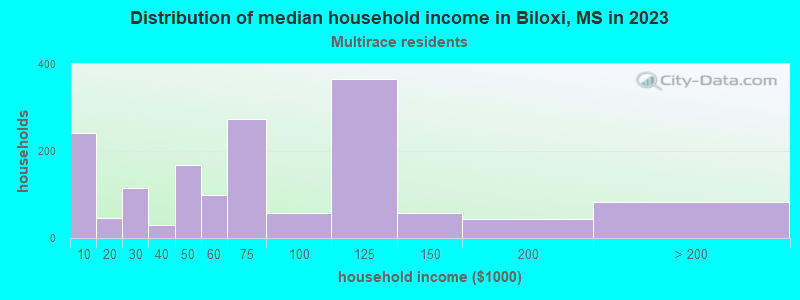
Income and house value in Biloxi Median household income in 2022 $61,819 White non-Hispanic householders$42,943 Black householders$46,320 Asian householders$77,654 Some other race householders$53,113 Two or more races householders$52,399 Hispanic or Latino race householdersMedian 2022 house value $241,100 White Non-Hispanic householders$162,568 Black or African American householders$119,049 American Indian or Alaska Native householders $223,093 Asian householders$251,855 Some other race householders$204,585 Two or more races householders$224,343 Hispanic or Latino householders
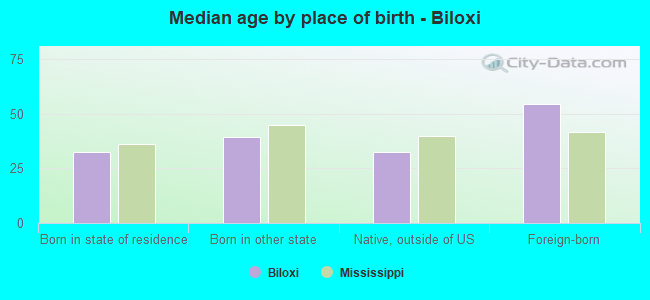
Median age by race in Biloxi
41.4 Median age for White residents41.0 41.3 33.5 Median age for Black or African American residents29.0 35.3 18.4 Median age for American Indian / Alaska Native residents22.5 11.5 40.6 Median age for Asian residents33.3 47.9 20.0 Median age for Native Hawaiian / Pacific Islander residents19.9 -670,599,802.7 26.9 Median age for Other race residents33.5 19.0 29.8 Median age for Two or more races residents27.7 29.7 42.2 Median age for White alone residents41.6 43.2 26.0 Median age for Hispanic or Latino residents27.0 26.3
Owner/renter occupied households by race in Biloxi
House owners and renters - White residents 7,316 55.9% Owner occupied5,783 44.1% Renter occupiedHouse owners and renters - Black or African American residents 1,509 42.5% Owner occupied2,037 57.5% Renter occupiedHouse owners and renters - American Indian / Alaska Native residents 69 100.0% Renter occupiedHouse owners and renters - Asian residents 318 42.0% Owner occupied439 58.0% Renter occupiedHouse owners and renters - Other race residents 160 33.8% Owner occupied314 66.2% Renter occupiedHouse owners and renters - Two or more races residents 1,205 47.6% Owner occupied1,324 52.4% Renter occupiedHouse owners and renters - White alone residents 7,310 57.5% Owner occupied5,413 42.5% Renter occupiedHouse owners and renters - Hispanic or Latino residents 339 28.2% Owner occupied861 71.8% Renter occupied
Language usage in Biloxi
English speakers - Total 90.5% of residents of Biloxi speak English at home.
4.2% of residents speak Spanish at home 1,264 64.3% Speak English very well701 35.7% Speak English less than very well5.2% of residents speak other language at home 1,422 58.4% Speak English very well1,011 41.6% Speak English less than very well
English speakers - Born in the United States 92.2% of residents of Biloxi speak English at home.
3.3% of residents speak Spanish at home 728 91.3% Speak English very well69 8.7% Speak English less than very well2.5% of residents speak other language at home 431 72.8% Speak English very well161 27.2% Speak English less than very well
English speakers - Native, born elsewhere 79.4% of residents of Biloxi speak English at home.
17.3% of residents speak Spanish at home 130 63.1% Speak English very well76 36.9% Speak English less than very well7.9% of residents speak other language at home 94 100.0% Speak English very well
English speakers - Foreign-born 34.0% of residents of Biloxi speak English at home.
29.0% of residents speak Spanish at home 201 31.4% Speak English very well440 68.6% Speak English less than very well34.8% of residents speak other language at home 306 39.8% Speak English very well462 60.2% Speak English less than very well
White (Caucasian) - Speak only English Native:
97.0% (28,499)Foreign-born:
50.1% (260)
White (Caucasian) - Speak another language Native:
2.8% (835)Foreign-born:
51.3% (266)
Black or African American - Speak only English Native:
98.0% (7,428)Foreign-born:
72.2% (180)
Black or African American - Speak another language Native:
2.2% (168)Foreign-born:
88.1% (219)
American Indian / Alaska Native - Speak another language Native:
67.9% (72)Foreign-born:
100.0% (69)
Asian - Speak only English Native:
50.7% (286)Foreign-born:
43.7% (334)
Asian - Speak another language Native:
39.4% (222)Foreign-born:
61.6% (472)
Other race - Speak another language Native:
30.9% (553)Foreign-born:
100.0% (625)
Two or more races - Speak only English Native:
88.8% (4,997)Foreign-born:
12.4% (16)
Two or more races - Speak another language Native:
5.4% (304)Foreign-born:
80.6% (102)
White alone - Speak only English Native:
98.0% (27,328)Foreign-born:
53.2% (235)
White alone - Speak another language Native:
2.0% (547)Foreign-born:
46.7% (206)
Hispanic or Latino - Speak only English Native:
69.4% (2,554)Foreign-born:
5.5% (37)
Hispanic or Latino - Speak another language Native:
30.4% (1,119)Foreign-born:
95.9% (646)
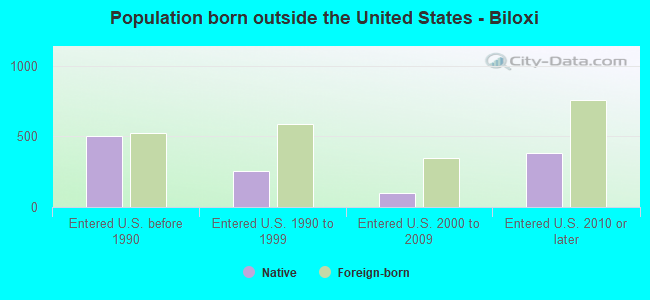
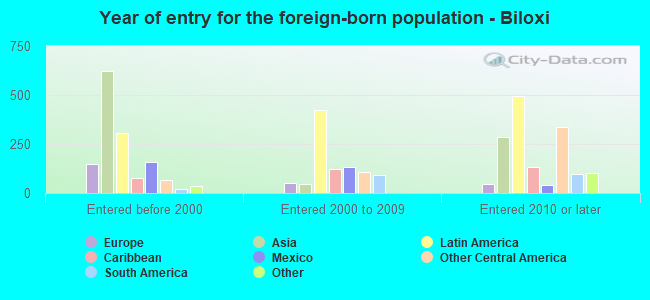
Foreign-born residents in Biloxi 2,849 residents are foreign born (2.7% Latin America , 2.1% Asia , 0.6% Europe ).
This city:
5.7%Mississippi:
2.3%
Marital status for residents in Biloxi Marital status - White (Caucasian) population 15 years and over
Males 30.4% Never married53.8% Now married1.6% Separated2.0% Widowed12.2% DivorcedFemales 22.3% Never married51.8% Now married2.6% Separated12.6% Widowed10.8% DivorcedWomen who gave birth in the past 12 months Now married:
94.1% (433)Unmarried:
5.9% (27)
Women who did not give birth in the past 12 months Now married:
47.8% (2,982)Unmarried:
52.2% (3,261)
Marital status - Black or African American population 15 years and over
Males 47.5% Never married32.5% Now married6.1% Separated3.7% Widowed10.1% DivorcedFemales 40.4% Never married33.3% Now married2.8% Separated4.9% Widowed18.6% DivorcedWomen who gave birth in the past 12 months Now married:
5.7% (10)Unmarried:
94.3% (165)
Women who did not give birth in the past 12 months Now married:
34.4% (698)Unmarried:
65.6% (1,332)
Marital status - American Indian / Alaska Native population 15 years and over
Males 47.7% Never married34.9% Now married0.0% Separated0.0% Widowed17.4% DivorcedFemales 78.9% Never married21.1% Now married0.0% Separated0.0% Widowed0.0% DivorcedWomen who did not give birth in the past 12 months Now married:
21.1% (8)Unmarried:
78.9% (30)
Marital status - Asian population 15 years and over
Males 55.0% Never married35.0% Now married0.0% Separated0.0% Widowed10.0% DivorcedFemales 34.4% Never married49.8% Now married2.0% Separated2.8% Widowed11.0% DivorcedWomen who gave birth in the past 12 months Now married:
100.0% (7)Unmarried:
0.0% (0)
Women who did not give birth in the past 12 months Now married:
41.5% (158)Unmarried:
58.5% (223)
Marital status - Native Hawaiian / Pacific Islander population 15 years and over
Males 38.9% Never married61.1% Now married0.0% Separated0.0% Widowed0.0% DivorcedFemales 100.0% Never married0.0% Now married0.0% Separated0.0% Widowed0.0% DivorcedWomen who did not give birth in the past 12 months Now married:
0.0% (0)Unmarried:
100.0% (3)
Marital status - Other race population 15 years and over
Males 33.5% Never married53.1% Now married0.0% Separated3.7% Widowed9.6% DivorcedFemales 20.3% Never married68.7% Now married0.0% Separated0.0% Widowed11.0% DivorcedWomen who gave birth in the past 12 months Now married:
100.0% (66)Unmarried:
0.0% (0)
Women who did not give birth in the past 12 months Now married:
46.0% (173)Unmarried:
54.0% (204)
Marital status - Two or more races population 15 years and over
Males 35.9% Never married41.8% Now married11.3% Separated3.6% Widowed7.4% DivorcedFemales 48.7% Never married33.2% Now married0.0% Separated8.3% Widowed9.9% DivorcedWomen who gave birth in the past 12 months Now married:
100.0% (10)Unmarried:
0.0% (0)
Women who did not give birth in the past 12 months Now married:
26.9% (528)Unmarried:
73.1% (1,431)
Marital status - White alone, not Hispanic / Latino population 15 years and over
Males 29.3% Never married54.8% Now married1.7% Separated2.1% Widowed12.1% DivorcedFemales 20.1% Never married53.2% Now married2.2% Separated13.2% Widowed11.4% DivorcedWomen who gave birth in the past 12 months Now married:
94.0% (428)Unmarried:
6.0% (28)
Women who did not give birth in the past 12 months Now married:
49.3% (2,778)Unmarried:
50.7% (2,861)
Marital status - Hispanic or Latino population 15 years and over
Males 41.8% Never married46.7% Now married0.9% Separated1.7% Widowed8.8% DivorcedFemales 47.4% Never married43.9% Now married4.6% Separated0.1% Widowed4.0% DivorcedWomen who gave birth in the past 12 months Now married:
100.0% (63)Unmarried:
0.0% (0)
Women who did not give birth in the past 12 months Now married:
36.6% (439)Unmarried:
63.4% (762)
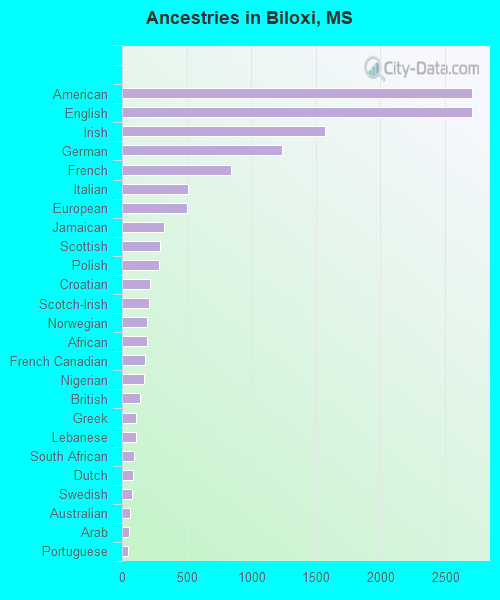
Ancestries in Biloxi
2,705 10.7% American2,705 10.7% English1,574 6.2% Irish1,235 4.9% German844 3.3% French510 2.0% Italian502 2.0% European327 1.3% Jamaican297 1.2% Scottish284 1.1% Polish215 0.9% Croatian206 0.8% Scotch-Irish193 0.8% Norwegian192 0.8% African177 0.7% French Canadian172 0.7% Nigerian138 0.5% British107 0.4% Greek106 0.4% Lebanese89 0.4% South African88 0.3% Dutch74 0.3% Swedish60 0.2% Australian53 0.2% Arab43 0.2% Portuguese34 0.1% Eastern European31 0.1% Scandinavian31 0.1% Barbadian27 0.1% Cajun26 0.1% Danish25 0.10% West Indian21 0.08% Haitian20 0.08% Austrian20 0.08% Lithuanian18 0.07% Welsh17 0.07% Yugoslavian16 0.06% Slavic14 0.06% Czechoslovakian11 0.04% Hungarian9 0.04% Slovak7 0.03% Russian7 0.03% Zimbabwean6 0.02% Armenian5 0.02% Palestinian4 0.02% Guyanese4 0.02% Belizean
Geographical mobility in Biloxi Same house 1 year ago 25,629 82.4% White (Caucasian)7,083 82.1% Black or African American225 98.5% American Indian / Alaska Native1,196 74.1% Asian11 48.1% Native Hawaiian / Pacific Islander1,421 86.9% Other race4,133 68.9% Two or more races24,677 84.0% White alone, not Hispanic / Latino2,765 64.0% Hispanic or LatinoMoved within same county 1,611 5.2% White / Caucasian689 8.0% Black or African American143 8.9% Asian90 5.5% Other race378 6.3% Two or more races1,343 4.6% White alone, not Hispanic / Latino326 7.5% Hispanic or LatinoMoved within same state 724 2.3% White / Caucasian214 2.5% Black or African American24 1.5% Other race107 1.8% Two or more races687 2.3% White alone, not Hispanic / Latino147 3.4% Hispanic or LatinoMoved from different state 3,263 10.5% White / Caucasian454 5.3% Black or African American2 0.9% American Indian / Alaska Native124 7.7% Asian12 52.0% Native Hawaiian / Pacific Islander27 1.6% Other race511 8.5% Two or more races2,789 9.5% White alone, not Hispanic / Latino954 22.1% Hispanic or LatinoMoved from abroad 177 0.6% White50 3.1% Asian91 5.5% Other race41 0.7% Two or more races155 0.5% White alone, not Hispanic / Latino135 3.1% Hispanic or Latino
Children Nativity (place of birth) in Biloxi
Children under 6 years - Living with two parents Both parents native 1,997 100.0% NativeBoth parents foreign-born 62 68.3% Native29 31.7% Foreign-bornOne native, one foreign-born parent 80 100.0% NativeChildren under 6 years - Living with one parent Native parent 1,208 100.0% NativeForeign-born parent 99 100.0% NativeChildren 6 to 17 years - Living with two parents Both parents native 3,912 100.0% NativeBoth parents foreign-born 63 46.6% Native72 53.4% Foreign-bornOne native, one foreign-born parent 442 100.0% NativeChildren 6 to 17 years - Living with one parent Native parent 2,135 100.0% NativeForeign-born parent 283 50.9% Native273 49.1% Foreign-born
Grandparents responsible for own grandchildren in Biloxi
Grandparents (30 to 59 years) White / Caucasian 78 25.2% Responsible for grandchildren231 74.8% Not responsible for grandchildrenBlack or African American 16 23.7% Responsible for grandchildren53 76.3% Not responsible for grandchildrenAsian 11 100.0% Not responsible for grandchildrenOther race 43 100.0% Responsible for grandchildrenWhite alone, not Hispanic / Latino 73 23.9% Responsible for grandchildren233 76.1% Not responsible for grandchildrenHispanic or Latino 39 100.0% Responsible for grandchildrenGrandparents (60 years and over) White / Caucasian 65 31.9% Responsible for grandchildren138 68.1% Not responsible for grandchildrenBlack or African American 21 12.8% Responsible for grandchildren141 87.2% Not responsible for grandchildrenWhite alone, not Hispanic / Latino 65 31.7% Responsible for grandchildren140 68.3% Not responsible for grandchildren