Races in Birmingham, Michigan (MI) Detailed Stats
Data:
Races - White alone (%)
Races - White alone (% change since 2000)
Races - Black alone (%)
Races - Black alone (% change since 2000)
Races - American Indian alone (%)
Races - American Indian alone (% change since 2000)
Races - Asian alone (%)
Races - Asian alone (% change since 2000)
Races - Hispanic (%)
Races - Hispanic (% change since 2000)
Races - Native Hawaiian and Other Pacific Islander alone (%)
Races - Native Hawaiian and Other Pacific Islander alone (% change since 2000)
Races - Two or more races(%)
Races - Two or more races(% change since 2000)
Races - Other race alone (%)
Races - Other race alone (% change since 2000)
Racial diversity
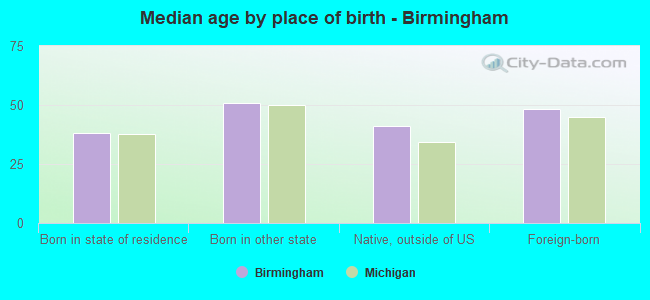
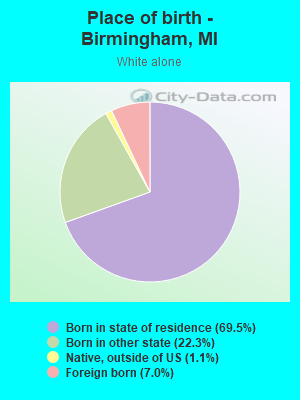
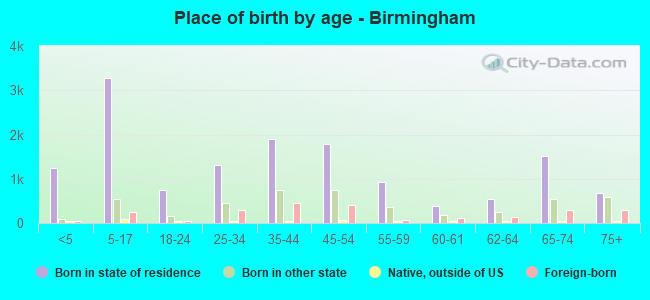
Place of birth - Born in state of residence (%)
Place of birth - Born in state of residence (%) - White
Place of birth - Born in state of residence (%) - Black or African American
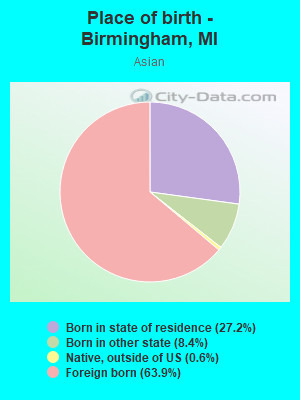
Place of birth - Born in state of residence (%) - Asian
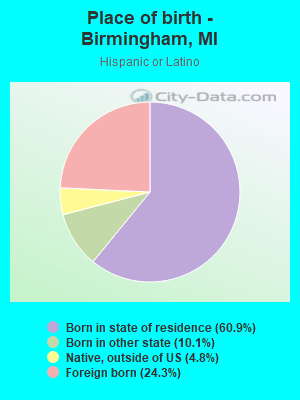
Place of birth - Born in state of residence (%) - Hispanic or Latino
Place of birth - Born in state of residence (%) - American Indian and Alaska Native
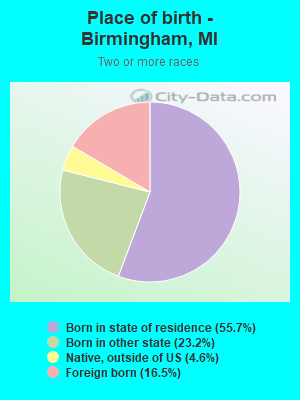
Place of birth - Born in state of residence (%) - Multirace
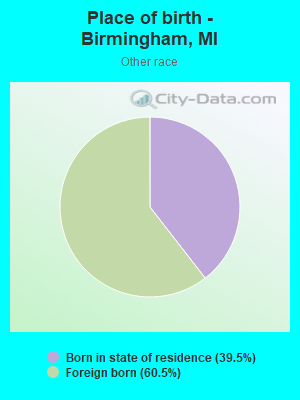
Place of birth - Born in state of residence (%) - Other Race
Place of birth - Born in other state (%)
Place of birth - Born in other state (%) - White
Place of birth - Born in other state (%) - Black or African American
Place of birth - Born in other state (%) - Asian
Place of birth - Born in other state (%) - Hispanic or Latino
Place of birth - Born in other state (%) - American Indian and Alaska Native
Place of birth - Born in other state (%) - Multirace
Place of birth - Born in other state (%) - Other Race
Place of birth - Native, outside of US (%)
Place of birth - Native, outside of US (%) - White
Place of birth - Native, outside of US (%) - Black or African American
Place of birth - Native, outside of US (%) - Asian
Place of birth - Native, outside of US (%) - Hispanic or Latino
Place of birth - Native, outside of US (%) - American Indian and Alaska Native
Place of birth - Native, outside of US (%) - Multirace
Place of birth - Native, outside of US (%) - Other Race
Place of birth - Foreign born (%)
Place of birth - Foreign born (%) - White
Place of birth - Foreign born (%) - Black or African American
Place of birth - Foreign born (%) - Asian
Place of birth - Foreign born (%) - Hispanic or Latino
Place of birth - Foreign born (%) - American Indian and Alaska Native
Place of birth - Foreign born (%) - Multirace
Place of birth - Foreign born (%) - Other Race
Residents speaking English at home (%)
Residents speaking English at home - Born in the United States (%)
Residents speaking English at home - Native, born elsewhere (%)
Residents speaking English at home - Foreign born (%)
Residents speaking Spanish at home (%)
Residents speaking Spanish at home - Born in the United States (%)
Residents speaking Spanish at home - Native, born elsewhere (%)
Residents speaking Spanish at home - Foreign born (%)
Residents speaking other language at home (%)
Residents speaking other language at home - Born in the United States (%)
Residents speaking other language at home - Native, born elsewhere (%)
Residents speaking other language at home - Foreign born (%)
Marital status - Never married (%)
Marital status - Now married (%)
Marital status - Separated (%)
Marital status - Widowed (%)
Marital status - Divorced (%)
Ancestries Reported - Arab (%)
Ancestries Reported - Czech (%)
Ancestries Reported - Danish (%)
Ancestries Reported - Dutch (%)
Ancestries Reported - English (%)
Ancestries Reported - French (%)
Ancestries Reported - French Canadian (%)
Ancestries Reported - German (%)
Ancestries Reported - Greek (%)
Ancestries Reported - Hungarian (%)
Ancestries Reported - Irish (%)
Ancestries Reported - Italian (%)
Ancestries Reported - Lithuanian (%)
Ancestries Reported - Norwegian (%)
Ancestries Reported - Polish (%)
Ancestries Reported - Portuguese (%)
Ancestries Reported - Russian (%)
Ancestries Reported - Scotch-Irish (%)
Ancestries Reported - Scottish (%)
Ancestries Reported - Slovak (%)
Ancestries Reported - Subsaharan African (%)
Ancestries Reported - Swedish (%)
Ancestries Reported - Swiss (%)
Ancestries Reported - Ukrainian (%)
Ancestries Reported - United States (%)
Ancestries Reported - Welsh (%)
Ancestries Reported - West Indian (%)
Ancestries Reported - Other (%)
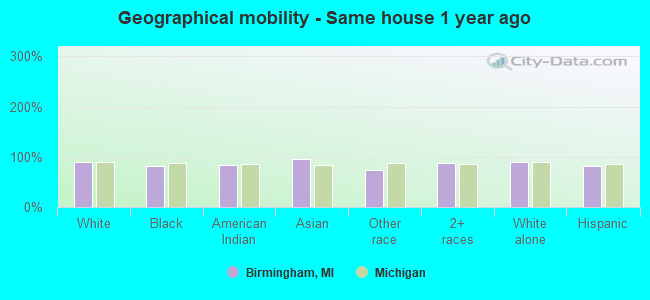
Geographical mobility - Same house 1 year ago (%)
Geographical mobility - Same house 1 year ago (%) - White
Geographical mobility - Same house 1 year ago (%) - Black or African American
Geographical mobility - Same house 1 year ago (%) - Asian
Geographical mobility - Same house 1 year ago (%) - Hispanic or Latino
Geographical mobility - Same house 1 year ago (%) - American Indian and Alaska Native
Geographical mobility - Same house 1 year ago (%) - Multirace
Geographical mobility - Same house 1 year ago (%) - Other Race
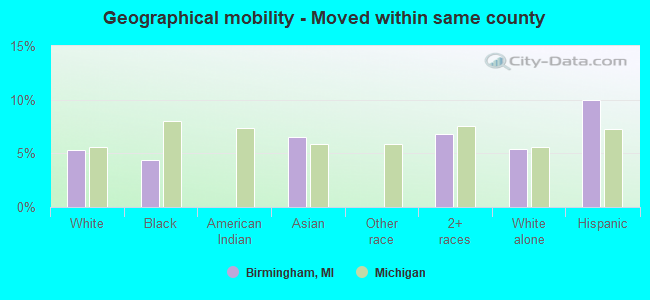
Geographical mobility - Moved within same county (%)
Geographical mobility - Moved within same county (%) - White
Geographical mobility - Moved within same county (%) - Black or African American
Geographical mobility - Moved within same county (%) - Asian
Geographical mobility - Moved within same county (%) - Hispanic or Latino
Geographical mobility - Moved within same county (%) - American Indian and Alaska Native
Geographical mobility - Moved within same county (%) - Multirace
Geographical mobility - Moved within same county (%) - Other Race
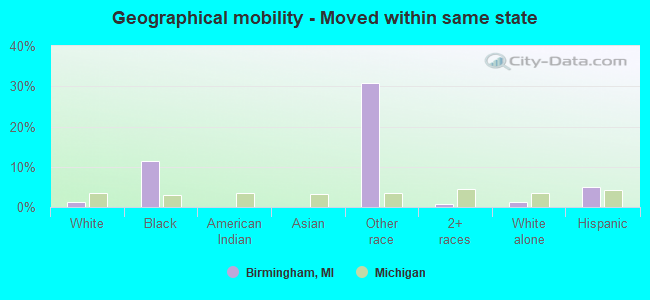
Geographical mobility - Moved from different county within same state (%)
Geographical mobility - Moved from different county within same state (%) - White
Geographical mobility - Moved from different county within same state (%) - Black or African American
Geographical mobility - Moved from different county within same state (%) - Asian
Geographical mobility - Moved from different county within same state (%) - Hispanic or Latino
Geographical mobility - Moved from different county within same state (%) - American Indian and Alaska Native
Geographical mobility - Moved from different county within same state (%) - Multirace
Geographical mobility - Moved from different county within same state (%) - Other Race
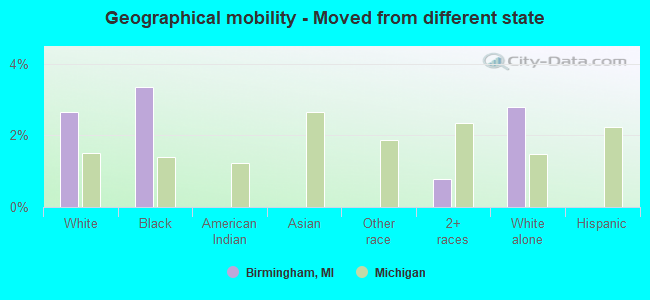
Geographical mobility - Moved from different state (%)
Geographical mobility - Moved from different state (%) - White
Geographical mobility - Moved from different state (%) - Black or African American
Geographical mobility - Moved from different state (%) - Asian
Geographical mobility - Moved from different state (%) - Hispanic or Latino
Geographical mobility - Moved from different state (%) - American Indian and Alaska Native
Geographical mobility - Moved from different state (%) - Multirace
Geographical mobility - Moved from different state (%) - Other Race
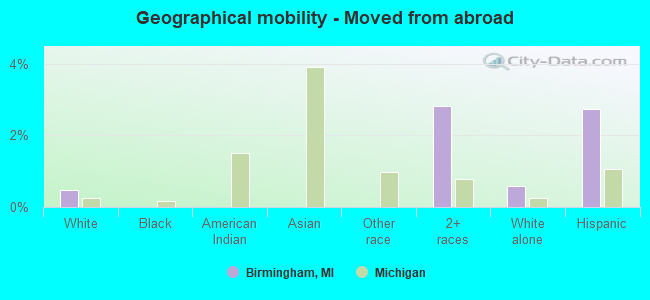
Geographical mobility - Moved from abroad (%)
Geographical mobility - Moved from abroad (%) - White
Geographical mobility - Moved from abroad (%) - Black or African American
Geographical mobility - Moved from abroad (%) - Asian
Geographical mobility - Moved from abroad (%) - Hispanic or Latino
Geographical mobility - Moved from abroad (%) - American Indian and Alaska Native
Geographical mobility - Moved from abroad (%) - Multirace
Geographical mobility - Moved from abroad (%) - Other Race
Place of birth for the foreign-born population - Ireland (%)
Place of birth for the foreign-born population - Denmark (%)
Place of birth for the foreign-born population - Norway (%)
Place of birth for the foreign-born population - Sweden (%)
Place of birth for the foreign-born population - United Kingdom (%)
Place of birth for the foreign-born population - England (%)
Place of birth for the foreign-born population - Scotland (%)
Place of birth for the foreign-born population - Other Northern Europe (%)
Place of birth for the foreign-born population - Austria (%)
Place of birth for the foreign-born population - Belgium (%)
Place of birth for the foreign-born population - France (%)
Place of birth for the foreign-born population - Germany (%)
Place of birth for the foreign-born population - Netherlands (%)
Place of birth for the foreign-born population - Switzerland (%)
Place of birth for the foreign-born population - Other Western Europe (%)
Place of birth for the foreign-born population - Greece (%)
Place of birth for the foreign-born population - Italy (%)
Place of birth for the foreign-born population - Portugal (%)
Place of birth for the foreign-born population - Spain (%)
Place of birth for the foreign-born population - Other Southern Europe (%)
Place of birth for the foreign-born population - Albania (%)
Place of birth for the foreign-born population - Belarus (%)
Place of birth for the foreign-born population - Bosnia and Herzegovina (%)
Place of birth for the foreign-born population - Bulgaria (%)
Place of birth for the foreign-born population - Croatia (%)
Place of birth for the foreign-born population - Czechoslovakia (%)
Place of birth for the foreign-born population - Hungary (%)
Place of birth for the foreign-born population - Latvia (%)
Place of birth for the foreign-born population - Lithuania (%)
Place of birth for the foreign-born population - North Macedonia (Macedonia) (%)
Place of birth for the foreign-born population - Moldova (%)
Place of birth for the foreign-born population - Poland (%)
Place of birth for the foreign-born population - Romania (%)
Place of birth for the foreign-born population - Russia (%)
Place of birth for the foreign-born population - Serbia (%)
Place of birth for the foreign-born population - Ukraine (%)
Place of birth for the foreign-born population - Other Eastern Europe (%)
Place of birth for the foreign-born population - China (%)
Place of birth for the foreign-born population - Hong Kong (%)
Place of birth for the foreign-born population - Taiwan (%)
Place of birth for the foreign-born population - Japan (%)
Place of birth for the foreign-born population - Korea (%)
Place of birth for the foreign-born population - Other Eastern Asia (%)
Place of birth for the foreign-born population - Afghanistan (%)
Place of birth for the foreign-born population - Bangladesh (%)
Place of birth for the foreign-born population - India (%)
Place of birth for the foreign-born population - Iran (%)
Place of birth for the foreign-born population - Kazakhstan (%)
Place of birth for the foreign-born population - Nepal (%)
Place of birth for the foreign-born population - Pakistan (%)
Place of birth for the foreign-born population - Sri Lanka (%)
Place of birth for the foreign-born population - Uzbekistan (%)
Place of birth for the foreign-born population - Other South Central Asia (%)
Place of birth for the foreign-born population - Burma (%)
Place of birth for the foreign-born population - Cambodia (%)
Place of birth for the foreign-born population - Indonesia (%)
Place of birth for the foreign-born population - Laos (%)
Place of birth for the foreign-born population - Malaysia (%)
Place of birth for the foreign-born population - Philippines (%)
Place of birth for the foreign-born population - Singapore (%)
Place of birth for the foreign-born population - Thailand (%)
Place of birth for the foreign-born population - Vietnam (%)
Place of birth for the foreign-born population - Other South Eastern Asia (%)
Place of birth for the foreign-born population - Armenia (%)
Place of birth for the foreign-born population - Iraq (%)
Place of birth for the foreign-born population - Israel (%)
Place of birth for the foreign-born population - Jordan (%)
Place of birth for the foreign-born population - Kuwait (%)
Place of birth for the foreign-born population - Lebanon (%)
Place of birth for the foreign-born population - Saudi Arabia (%)
Place of birth for the foreign-born population - Syria (%)
Place of birth for the foreign-born population - Turkey (%)
Place of birth for the foreign-born population - Yemen (%)
Place of birth for the foreign-born population - Other Western Asia (%)
Place of birth for the foreign-born population - Eritrea (%)
Place of birth for the foreign-born population - Ethiopia (%)
Place of birth for the foreign-born population - Kenya (%)
Place of birth for the foreign-born population - Somalia (%)
Place of birth for the foreign-born population - Uganda (%)
Place of birth for the foreign-born population - Zimbabwe (%)
Place of birth for the foreign-born population - Other Eastern Africa (%)
Place of birth for the foreign-born population - Cameroon (%)
Place of birth for the foreign-born population - Congo (%)
Place of birth for the foreign-born population - Democratic Republic of Congo (Zaire) (%)
Place of birth for the foreign-born population - Other Middle Africa (%)
Place of birth for the foreign-born population - Egypt (%)
Place of birth for the foreign-born population - Morocco (%)
Place of birth for the foreign-born population - Sudan (%)
Place of birth for the foreign-born population - Other Northern Africa (%)
Place of birth for the foreign-born population - South Africa (%)
Place of birth for the foreign-born population - Other Southern Africa (%)
Place of birth for the foreign-born population - Cabo Verde (%)
Place of birth for the foreign-born population - Ghana (%)
Place of birth for the foreign-born population - Liberia (%)
Place of birth for the foreign-born population - Nigeria (%)
Place of birth for the foreign-born population - Senegal (%)
Place of birth for the foreign-born population - Sierra Leone (%)
Place of birth for the foreign-born population - Other Western Africa (%)
Place of birth for the foreign-born population - Australia (%)
Place of birth for the foreign-born population - New Zealand (%)
Place of birth for the foreign-born population - Fiji (%)
Place of birth for the foreign-born population - Micronesia (%)
Place of birth for the foreign-born population - Bahamas (%)
Place of birth for the foreign-born population - Barbados (%)
Place of birth for the foreign-born population - Cuba (%)
Place of birth for the foreign-born population - Dominica (%)
Place of birth for the foreign-born population - Dominican Republic (%)
Place of birth for the foreign-born population - Grenada (%)
Place of birth for the foreign-born population - Haiti (%)
Place of birth for the foreign-born population - Jamaica (%)
Place of birth for the foreign-born population - St. Vincent and the Grenadines (%)
Place of birth for the foreign-born population - Trinidad and Tobago (%)
Place of birth for the foreign-born population - West Indies (%)
Place of birth for the foreign-born population - Other Caribbean (%)
Place of birth for the foreign-born population - Belize (%)
Place of birth for the foreign-born population - Costa Rica (%)
Place of birth for the foreign-born population - El Salvador (%)
Place of birth for the foreign-born population - Guatemala (%)
Place of birth for the foreign-born population - Honduras (%)
Place of birth for the foreign-born population - Mexico (%)
Place of birth for the foreign-born population - Nicaragua (%)
Place of birth for the foreign-born population - Panama (%)
Place of birth for the foreign-born population - Other Central America (%)
Place of birth for the foreign-born population - Argentina (%)
Place of birth for the foreign-born population - Bolivia (%)
Place of birth for the foreign-born population - Brazil (%)
Place of birth for the foreign-born population - Chile (%)
Place of birth for the foreign-born population - Colombia (%)
Place of birth for the foreign-born population - Ecuador (%)
Place of birth for the foreign-born population - Guyana (%)
Place of birth for the foreign-born population - Peru (%)
Place of birth for the foreign-born population - Uruguay (%)
Place of birth for the foreign-born population - Venezuela (%)
Place of birth for the foreign-born population - Other South America (%)
Place of birth for the foreign-born population - Canada (%)
Place of birth for the foreign-born population - Other Northern America (%)
Place of birth for the foreign-born population - Other (%)
Latest news about races in Birmingham, MI collected exclusively by city-data.com from local newspapers, TV, and radio stations
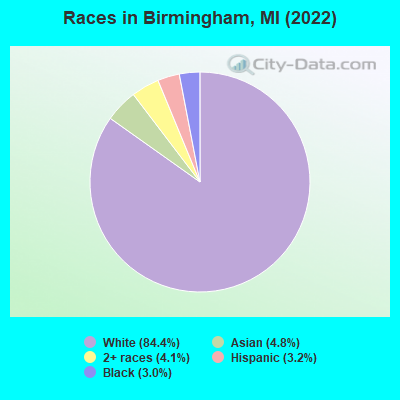
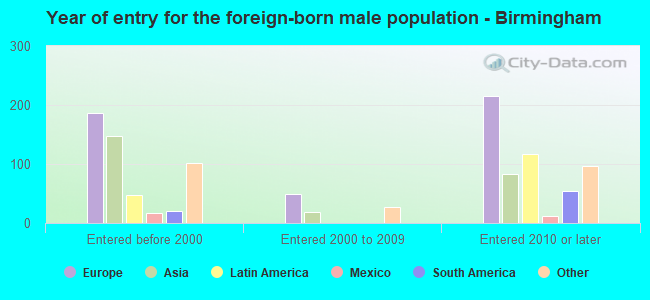
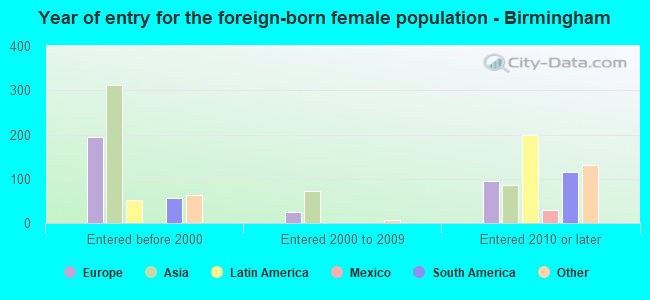
According to 2022 data, the most numerous races in Birmingham, MI are White alone (18,313 residents), Black alone (660 residents), and Hispanic (689 residents). 89.3% of Birmingham residents speak English at home. 10.8% of Birmingham, MI residents are foreign-born (4.0% born in Europe, 3.3% born in Asia, 1.6% born in Latin America, 1.1% born in North America), which is 44.4% greater than the foreign-born rate of 6.0% across the entire state of Michigan.
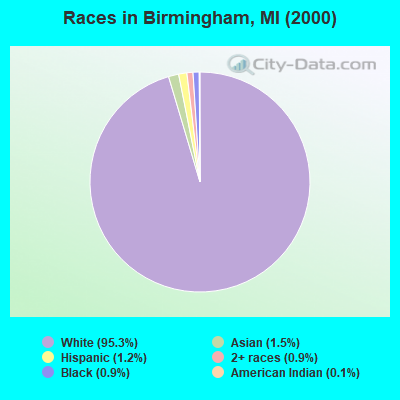
Race distribution in Birmingham
2000 2022
7,806,691 78.6% White alone 1,402,047 14.1% Black alone 323,877 3.3% Hispanic 175,311 1.8% Asian alone 163,487 1.6% Two or more races 53,421 0.5% American Indian alone 11,465 0.1% Other race alone 2,145 0.02% Native Hawaiian and Other
7,289,051 72.6% White alone 1,310,464 13.1% Black alone 572,405 5.7% Hispanic 450,031 4.5% Two or more races 335,732 3.3% Asian alone 45,217 0.5% Other race alone 29,011 0.3% American Indian alone 2,207 0.02% Native Hawaiian and Other
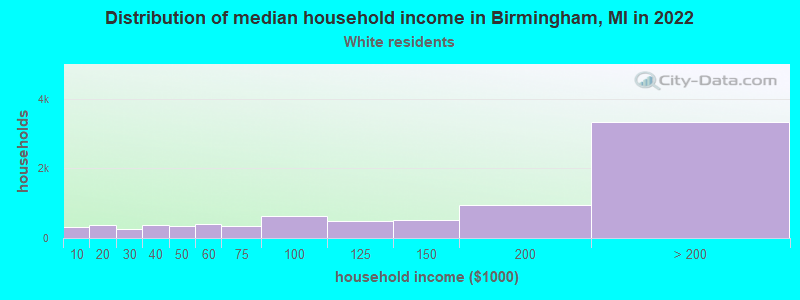
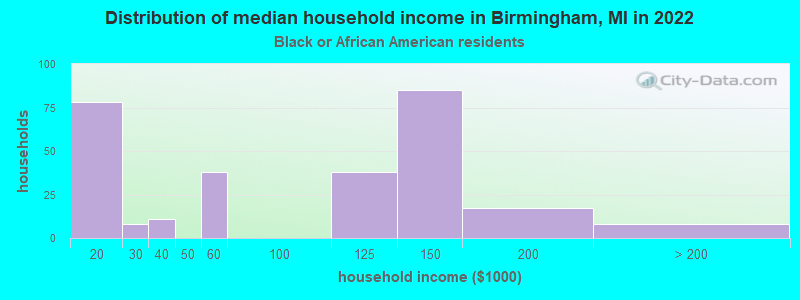
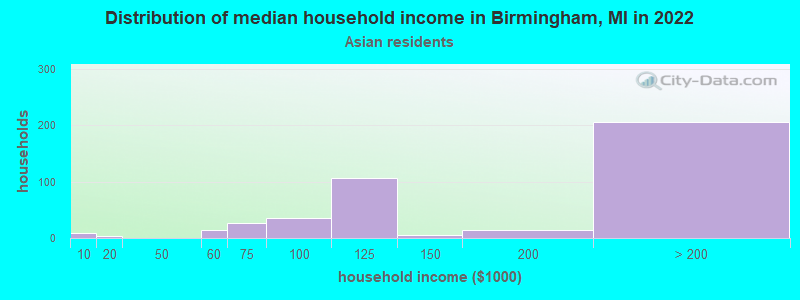
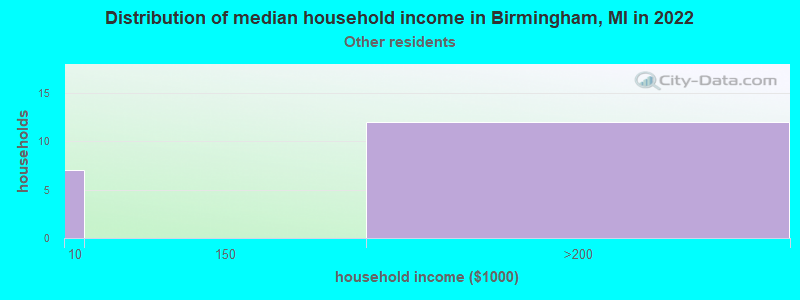
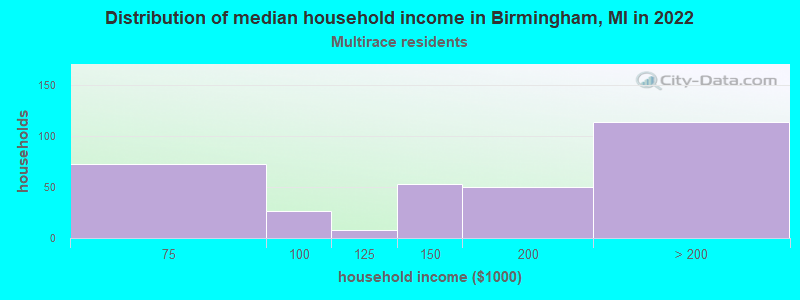
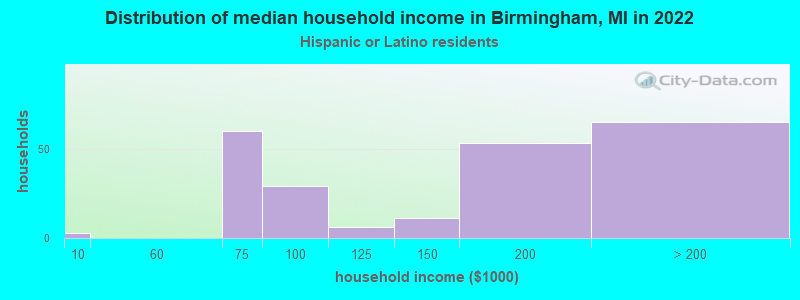
Income and house value in Birmingham Median household income in 2022 $152,311 White non-Hispanic householders$149,178 Two or more races householders$163,094 Hispanic or Latino race householdersMedian 2022 house value $801,817 White Non-Hispanic householders$472,398 Black or African American householders$679,088 American Indian or Alaska Native householders $530,923 Asian householders$384,487 Two or more races householders$574,138 Hispanic or Latino householders
Median age by race in Birmingham
45.0 Median age for White residents42.8 47.1 21.9 Median age for Black or African American residents27.1 21.9 -718,321,226.1 Median age for American Indian / Alaska Native residents-505,050,504.5 -728,395,061.0 42.2 Median age for Asian residents46.2 38.0 -670,531,400.3 Median age for Native Hawaiian / Pacific Islander residents-674,772,035.8 -699,588,476.7 16.4 Median age for Other race residents-685,416,666.0 54.5 19.6 Median age for Two or more races residents25.0 15.5 44.8 Median age for White alone residents42.7 47.1 39.9 Median age for Hispanic or Latino residents48.2 37.7
Owner/renter occupied households by race in Birmingham
House owners and renters - White residents 6,692 80.8% Owner occupied1,595 19.2% Renter occupiedHouse owners and renters - Black or African American residents 63 23.9% Owner occupied200 76.1% Renter occupiedHouse owners and renters - American Indian / Alaska Native residents 5 100.0% Owner occupiedHouse owners and renters - Asian residents 244 56.5% Owner occupied188 43.5% Renter occupiedHouse owners and renters - Other race residents 22 79.0% Owner occupied6 21.0% Renter occupiedHouse owners and renters - Two or more races residents 160 46.6% Owner occupied184 53.4% Renter occupiedHouse owners and renters - White alone residents 6,700 80.8% Owner occupied1,588 19.2% Renter occupiedHouse owners and renters - Hispanic or Latino residents 122 53.4% Owner occupied106 46.6% Renter occupied
Language usage in Birmingham
English speakers - Total 89.3% of residents of Birmingham speak English at home.
1.6% of residents speak Spanish at home 272 84.7% Speak English very well49 15.3% Speak English less than very well9.0% of residents speak other language at home 1,576 86.5% Speak English very well245 13.5% Speak English less than very well
English speakers - Born in the United States 95.8% of residents of Birmingham speak English at home.
3.5% of residents speak other language at home 154 95.7% Speak English very well7 4.3% Speak English less than very well
English speakers - Native, born elsewhere 93.5% of residents of Birmingham speak English at home.
8.7% of residents speak Spanish at home 24 100.0% Speak English very well6.2% of residents speak other language at home 17 100.0% Speak English very well
English speakers - Foreign-born 37.6% of residents of Birmingham speak English at home.
6.7% of residents speak Spanish at home 106 68.8% Speak English very well48 31.2% Speak English less than very well55.2% of residents speak other language at home 1,055 82.7% Speak English very well221 17.3% Speak English less than very well
White (Caucasian) - Speak only English Native:
97.1% (15,377)Foreign-born:
42.3% (512)
White (Caucasian) - Speak another language Native:
3.0% (469)Foreign-born:
59.0% (715)
Black or African American - Speak only English Native:
98.7% (624)Foreign-born:
39.2% (17)
Black or African American - Speak another language Native:
1.4% (9)Foreign-born:
51.5% (23)
Asian - Speak only English Native:
81.1% (264)Foreign-born:
34.5% (238)
Asian - Speak another language Native:
20.5% (67)Foreign-born:
66.4% (457)
Other race - Speak only English Native:
73.2% (24)Foreign-born:
29.7% (14)
Other race - Speak another language Native:
23.4% (8)Foreign-born:
31.5% (15)
Two or more races - Speak only English Native:
87.7% (937)Foreign-born:
39.6% (94)
Two or more races - Speak another language Native:
12.3% (132)Foreign-born:
56.2% (133)
White alone - Speak only English Native:
96.9% (15,352)Foreign-born:
41.6% (513)
White alone - Speak another language Native:
3.1% (491)Foreign-born:
59.1% (730)
Hispanic or Latino - Speak only English Native:
74.2% (353)Foreign-born:
19.2% (31)
Hispanic or Latino - Speak another language Native:
24.4% (116)Foreign-born:
75.6% (121)
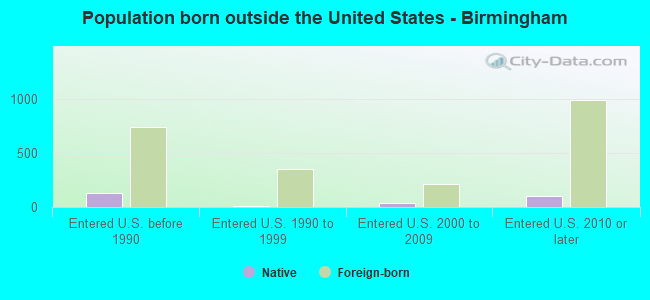
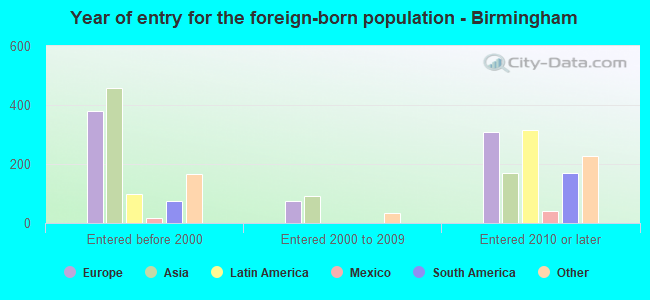
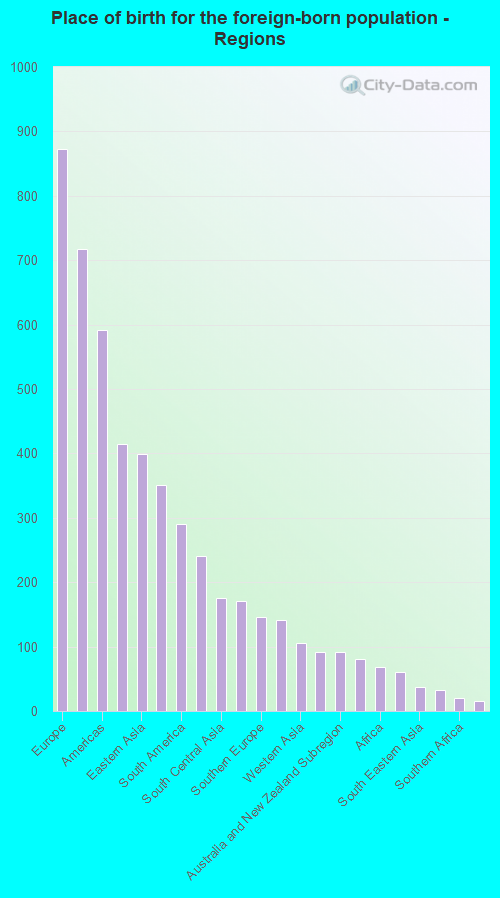
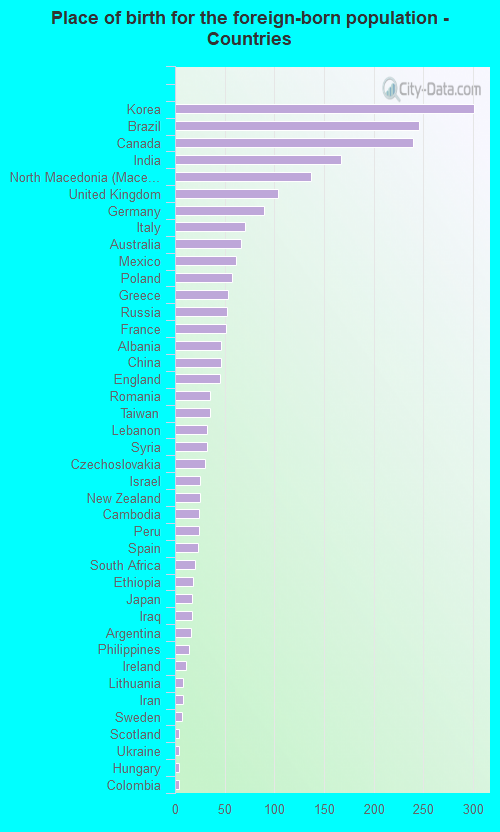
Foreign-born residents in Birmingham 2,341 residents are foreign born (4.0% Europe , 3.3% Asia , 1.6% Latin America , 1.1% North America ).
This city:
10.8%Michigan:
6.9%
Marital status for residents in Birmingham Marital status - White (Caucasian) population 15 years and over
Males 25.4% Never married62.5% Now married0.4% Separated2.6% Widowed9.1% DivorcedFemales 23.6% Never married55.1% Now married0.4% Separated7.7% Widowed13.2% DivorcedWomen who gave birth in the past 12 months Now married:
90.0% (103)Unmarried:
10.0% (11)
Women who did not give birth in the past 12 months Now married:
54.7% (1,843)Unmarried:
45.3% (1,524)
Marital status - Black or African American population 15 years and over
Males 81.6% Never married18.4% Now married0.0% Separated0.0% Widowed0.0% DivorcedFemales 71.3% Never married8.9% Now married0.0% Separated0.0% Widowed19.8% DivorcedWomen who did not give birth in the past 12 months Now married:
4.1% (13)Unmarried:
95.9% (305)
Marital status - Asian population 15 years and over
Males 14.4% Never married82.0% Now married0.0% Separated3.6% Widowed0.0% DivorcedFemales 8.8% Never married59.3% Now married0.0% Separated5.3% Widowed26.6% DivorcedWomen who gave birth in the past 12 months Now married:
100.0% (16)Unmarried:
0.0% (0)
Women who did not give birth in the past 12 months Now married:
50.8% (154)Unmarried:
49.2% (149)
Marital status - Other race population 15 years and over
Males 100.0% Never married0.0% Now married0.0% Separated0.0% Widowed0.0% DivorcedFemales 0.0% Never married86.2% Now married0.0% Separated0.0% Widowed13.8% DivorcedWomen who did not give birth in the past 12 months Now married:
60.0% (9)Unmarried:
40.0% (6)
Marital status - Two or more races population 15 years and over
Males 35.5% Never married44.2% Now married0.0% Separated0.0% Widowed20.2% DivorcedFemales 46.6% Never married49.1% Now married0.0% Separated0.0% Widowed4.3% DivorcedWomen who gave birth in the past 12 months Now married:
100.0% (7)Unmarried:
0.0% (0)
Women who did not give birth in the past 12 months Now married:
51.5% (169)Unmarried:
48.5% (159)
Marital status - White alone, not Hispanic / Latino population 15 years and over
Males 25.5% Never married62.6% Now married0.4% Separated2.7% Widowed8.9% DivorcedFemales 23.6% Never married54.9% Now married0.5% Separated7.8% Widowed13.3% DivorcedWomen who gave birth in the past 12 months Now married:
90.0% (105)Unmarried:
10.0% (12)
Women who did not give birth in the past 12 months Now married:
54.5% (1,831)Unmarried:
45.5% (1,529)
Marital status - Hispanic or Latino population 15 years and over
Males 27.4% Never married55.7% Now married0.0% Separated0.0% Widowed16.9% DivorcedFemales 25.1% Never married72.9% Now married0.0% Separated0.0% Widowed1.9% DivorcedWomen who did not give birth in the past 12 months Now married:
74.2% (125)Unmarried:
25.8% (43)
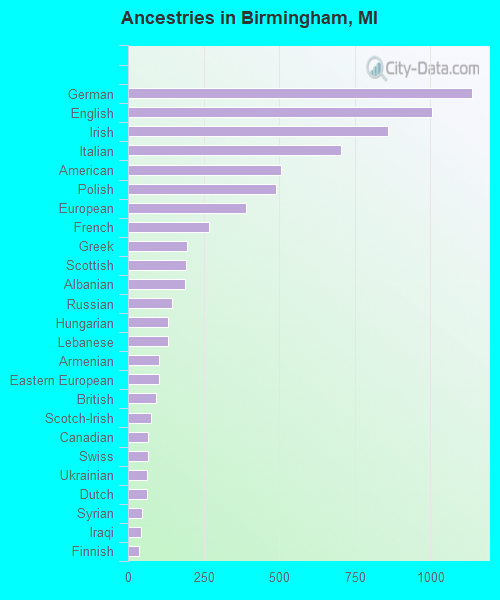
Ancestries in Birmingham
1,137 11.5% German1,005 10.2% English860 8.7% Irish705 7.1% Italian506 5.1% American490 5.0% Polish391 4.0% European268 2.7% French195 2.0% Greek193 2.0% Scottish189 1.9% Albanian144 1.5% Russian132 1.3% Hungarian131 1.3% Lebanese103 1.0% Armenian102 1.0% Eastern European91 0.9% British77 0.8% Scotch-Irish66 0.7% Canadian66 0.7% Swiss64 0.6% Ukrainian62 0.6% Dutch47 0.5% Syrian44 0.4% Iraqi38 0.4% Finnish36 0.4% Iranian35 0.4% Northern European31 0.3% Czech31 0.3% Swedish27 0.3% Assyrian26 0.3% Welsh25 0.3% Croatian24 0.2% French Canadian22 0.2% African21 0.2% Slovak18 0.2% Norwegian16 0.2% Romanian15 0.2% Danish13 0.1% Austrian11 0.1% Israeli11 0.1% Serbian10 0.1% Lithuanian9 0.09% Portuguese7 0.07% Czechoslovakian
Children Nativity (place of birth) in Birmingham
Children under 6 years - Living with two parents Both parents native 1,329 99.8% Native2 0.2% Foreign-bornBoth parents foreign-born 37 42.0% Native52 58.0% Foreign-bornOne native, one foreign-born parent 123 100.0% NativeChildren under 6 years - Living with one parent Native parent 74 100.0% NativeForeign-born parent 30 100.0% NativeChildren 6 to 17 years - Living with two parents Both parents native 2,288 98.8% Native27 1.2% Foreign-bornBoth parents foreign-born 127 42.8% Native169 57.2% Foreign-bornOne native, one foreign-born parent 248 87.5% Native35 12.5% Foreign-bornChildren 6 to 17 years - Living with one parent Native parent 942 100.0% NativeForeign-born parent 24 46.9% Native27 53.1% Foreign-born