Races in Bithlo, Florida (FL) Detailed Stats
Data:
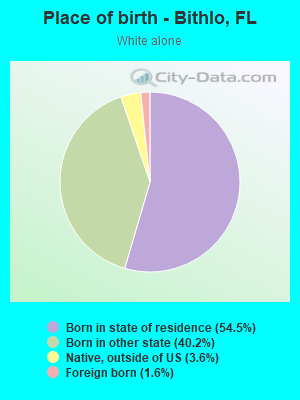
Races - White alone (%)
Races - White alone (% change since 2000)
Races - Black alone (%)
Races - Black alone (% change since 2000)
Races - American Indian alone (%)
Races - American Indian alone (% change since 2000)
Races - Asian alone (%)
Races - Asian alone (% change since 2000)
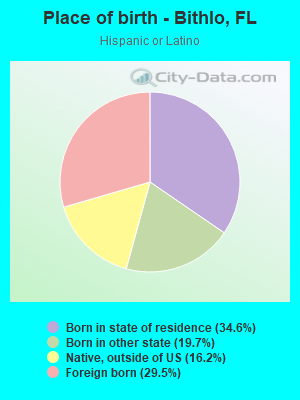
Races - Hispanic (%)
Races - Hispanic (% change since 2000)
Races - Native Hawaiian and Other Pacific Islander alone (%)
Races - Native Hawaiian and Other Pacific Islander alone (% change since 2000)
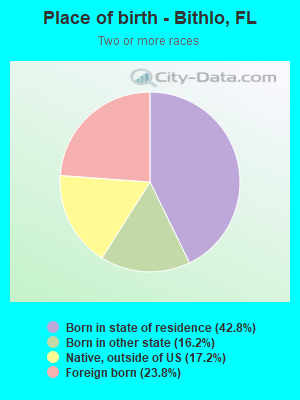
Races - Two or more races(%)
Races - Two or more races(% change since 2000)
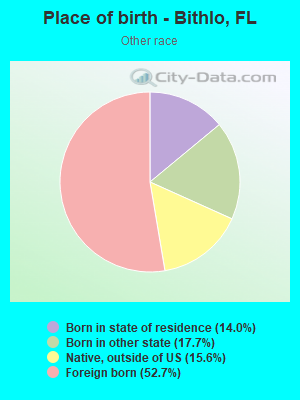
Races - Other race alone (%)
Races - Other race alone (% change since 2000)
Racial diversity
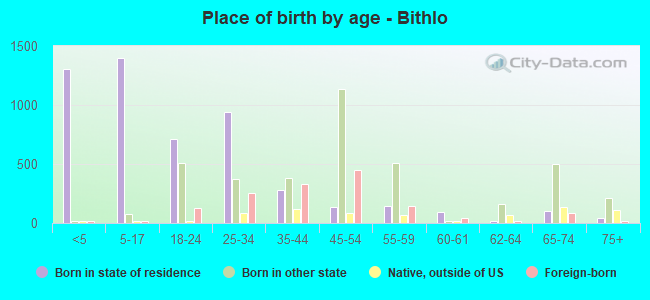
Place of birth - Born in state of residence (%)
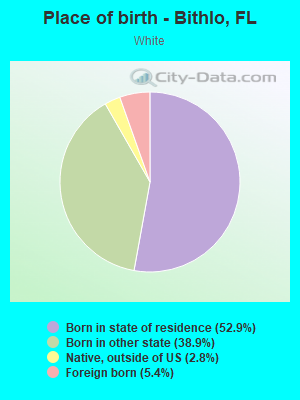
Place of birth - Born in state of residence (%) - White
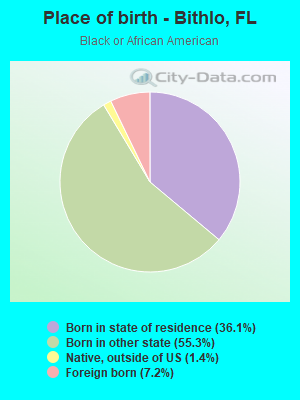
Place of birth - Born in state of residence (%) - Black or African American
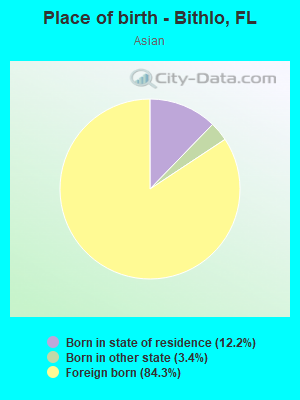
Place of birth - Born in state of residence (%) - Asian
Place of birth - Born in state of residence (%) - Hispanic or Latino
Place of birth - Born in state of residence (%) - American Indian and Alaska Native
Place of birth - Born in state of residence (%) - Multirace
Place of birth - Born in state of residence (%) - Other Race
Place of birth - Born in other state (%)
Place of birth - Born in other state (%) - White
Place of birth - Born in other state (%) - Black or African American
Place of birth - Born in other state (%) - Asian
Place of birth - Born in other state (%) - Hispanic or Latino
Place of birth - Born in other state (%) - American Indian and Alaska Native
Place of birth - Born in other state (%) - Multirace
Place of birth - Born in other state (%) - Other Race
Place of birth - Native, outside of US (%)
Place of birth - Native, outside of US (%) - White
Place of birth - Native, outside of US (%) - Black or African American
Place of birth - Native, outside of US (%) - Asian
Place of birth - Native, outside of US (%) - Hispanic or Latino
Place of birth - Native, outside of US (%) - American Indian and Alaska Native
Place of birth - Native, outside of US (%) - Multirace
Place of birth - Native, outside of US (%) - Other Race
Place of birth - Foreign born (%)
Place of birth - Foreign born (%) - White
Place of birth - Foreign born (%) - Black or African American
Place of birth - Foreign born (%) - Asian
Place of birth - Foreign born (%) - Hispanic or Latino
Place of birth - Foreign born (%) - American Indian and Alaska Native
Place of birth - Foreign born (%) - Multirace
Place of birth - Foreign born (%) - Other Race
Residents speaking English at home (%)
Residents speaking English at home - Born in the United States (%)
Residents speaking English at home - Native, born elsewhere (%)
Residents speaking English at home - Foreign born (%)
Residents speaking Spanish at home (%)
Residents speaking Spanish at home - Born in the United States (%)
Residents speaking Spanish at home - Native, born elsewhere (%)
Residents speaking Spanish at home - Foreign born (%)
Residents speaking other language at home (%)
Residents speaking other language at home - Born in the United States (%)
Residents speaking other language at home - Native, born elsewhere (%)
Residents speaking other language at home - Foreign born (%)
Marital status - Never married (%)
Marital status - Now married (%)
Marital status - Separated (%)
Marital status - Widowed (%)
Marital status - Divorced (%)
Ancestries Reported - Arab (%)
Ancestries Reported - Czech (%)
Ancestries Reported - Danish (%)
Ancestries Reported - Dutch (%)
Ancestries Reported - English (%)
Ancestries Reported - French (%)
Ancestries Reported - French Canadian (%)
Ancestries Reported - German (%)
Ancestries Reported - Greek (%)
Ancestries Reported - Hungarian (%)
Ancestries Reported - Irish (%)
Ancestries Reported - Italian (%)
Ancestries Reported - Lithuanian (%)
Ancestries Reported - Norwegian (%)
Ancestries Reported - Polish (%)
Ancestries Reported - Portuguese (%)
Ancestries Reported - Russian (%)
Ancestries Reported - Scotch-Irish (%)
Ancestries Reported - Scottish (%)
Ancestries Reported - Slovak (%)
Ancestries Reported - Subsaharan African (%)
Ancestries Reported - Swedish (%)
Ancestries Reported - Swiss (%)
Ancestries Reported - Ukrainian (%)
Ancestries Reported - United States (%)
Ancestries Reported - Welsh (%)
Ancestries Reported - West Indian (%)
Ancestries Reported - Other (%)
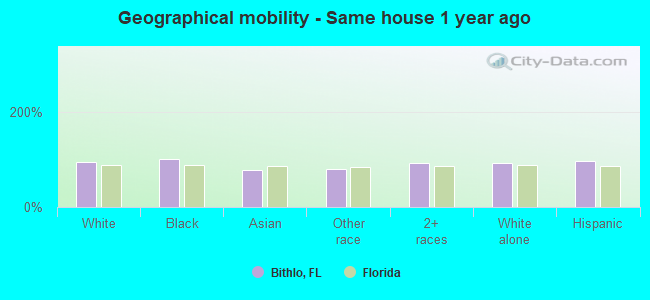
Geographical mobility - Same house 1 year ago (%)
Geographical mobility - Same house 1 year ago (%) - White
Geographical mobility - Same house 1 year ago (%) - Black or African American
Geographical mobility - Same house 1 year ago (%) - Asian
Geographical mobility - Same house 1 year ago (%) - Hispanic or Latino
Geographical mobility - Same house 1 year ago (%) - American Indian and Alaska Native
Geographical mobility - Same house 1 year ago (%) - Multirace
Geographical mobility - Same house 1 year ago (%) - Other Race
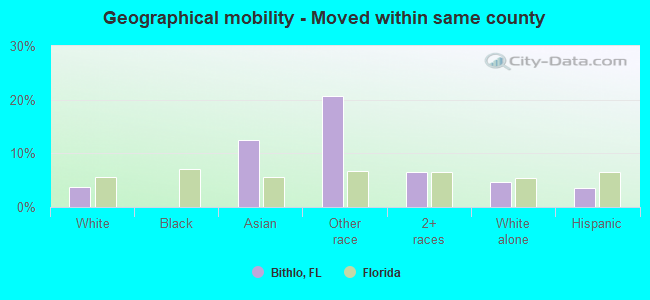
Geographical mobility - Moved within same county (%)
Geographical mobility - Moved within same county (%) - White
Geographical mobility - Moved within same county (%) - Black or African American
Geographical mobility - Moved within same county (%) - Asian
Geographical mobility - Moved within same county (%) - Hispanic or Latino
Geographical mobility - Moved within same county (%) - American Indian and Alaska Native
Geographical mobility - Moved within same county (%) - Multirace
Geographical mobility - Moved within same county (%) - Other Race
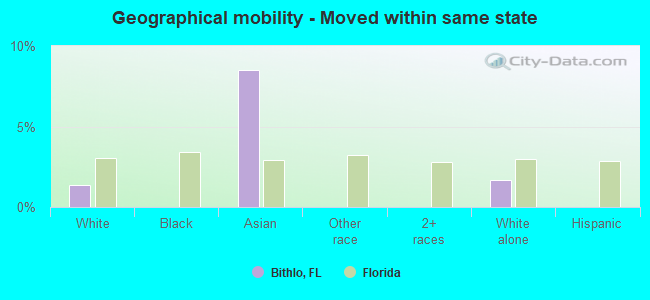
Geographical mobility - Moved from different county within same state (%)
Geographical mobility - Moved from different county within same state (%) - White
Geographical mobility - Moved from different county within same state (%) - Black or African American
Geographical mobility - Moved from different county within same state (%) - Asian
Geographical mobility - Moved from different county within same state (%) - Hispanic or Latino
Geographical mobility - Moved from different county within same state (%) - American Indian and Alaska Native
Geographical mobility - Moved from different county within same state (%) - Multirace
Geographical mobility - Moved from different county within same state (%) - Other Race
Geographical mobility - Moved from different state (%)
Geographical mobility - Moved from different state (%) - White
Geographical mobility - Moved from different state (%) - Black or African American
Geographical mobility - Moved from different state (%) - Asian
Geographical mobility - Moved from different state (%) - Hispanic or Latino
Geographical mobility - Moved from different state (%) - American Indian and Alaska Native
Geographical mobility - Moved from different state (%) - Multirace
Geographical mobility - Moved from different state (%) - Other Race
Geographical mobility - Moved from abroad (%)
Geographical mobility - Moved from abroad (%) - White
Geographical mobility - Moved from abroad (%) - Black or African American
Geographical mobility - Moved from abroad (%) - Asian
Geographical mobility - Moved from abroad (%) - Hispanic or Latino
Geographical mobility - Moved from abroad (%) - American Indian and Alaska Native
Geographical mobility - Moved from abroad (%) - Multirace
Geographical mobility - Moved from abroad (%) - Other Race
Place of birth for the foreign-born population - Ireland (%)
Place of birth for the foreign-born population - Denmark (%)
Place of birth for the foreign-born population - Norway (%)
Place of birth for the foreign-born population - Sweden (%)
Place of birth for the foreign-born population - United Kingdom (%)
Place of birth for the foreign-born population - England (%)
Place of birth for the foreign-born population - Scotland (%)
Place of birth for the foreign-born population - Other Northern Europe (%)
Place of birth for the foreign-born population - Austria (%)
Place of birth for the foreign-born population - Belgium (%)
Place of birth for the foreign-born population - France (%)
Place of birth for the foreign-born population - Germany (%)
Place of birth for the foreign-born population - Netherlands (%)
Place of birth for the foreign-born population - Switzerland (%)
Place of birth for the foreign-born population - Other Western Europe (%)
Place of birth for the foreign-born population - Greece (%)
Place of birth for the foreign-born population - Italy (%)
Place of birth for the foreign-born population - Portugal (%)
Place of birth for the foreign-born population - Spain (%)
Place of birth for the foreign-born population - Other Southern Europe (%)
Place of birth for the foreign-born population - Albania (%)
Place of birth for the foreign-born population - Belarus (%)
Place of birth for the foreign-born population - Bosnia and Herzegovina (%)
Place of birth for the foreign-born population - Bulgaria (%)
Place of birth for the foreign-born population - Croatia (%)
Place of birth for the foreign-born population - Czechoslovakia (%)
Place of birth for the foreign-born population - Hungary (%)
Place of birth for the foreign-born population - Latvia (%)
Place of birth for the foreign-born population - Lithuania (%)
Place of birth for the foreign-born population - North Macedonia (Macedonia) (%)
Place of birth for the foreign-born population - Moldova (%)
Place of birth for the foreign-born population - Poland (%)
Place of birth for the foreign-born population - Romania (%)
Place of birth for the foreign-born population - Russia (%)
Place of birth for the foreign-born population - Serbia (%)
Place of birth for the foreign-born population - Ukraine (%)
Place of birth for the foreign-born population - Other Eastern Europe (%)
Place of birth for the foreign-born population - China (%)
Place of birth for the foreign-born population - Hong Kong (%)
Place of birth for the foreign-born population - Taiwan (%)
Place of birth for the foreign-born population - Japan (%)
Place of birth for the foreign-born population - Korea (%)
Place of birth for the foreign-born population - Other Eastern Asia (%)
Place of birth for the foreign-born population - Afghanistan (%)
Place of birth for the foreign-born population - Bangladesh (%)
Place of birth for the foreign-born population - India (%)
Place of birth for the foreign-born population - Iran (%)
Place of birth for the foreign-born population - Kazakhstan (%)
Place of birth for the foreign-born population - Nepal (%)
Place of birth for the foreign-born population - Pakistan (%)
Place of birth for the foreign-born population - Sri Lanka (%)
Place of birth for the foreign-born population - Uzbekistan (%)
Place of birth for the foreign-born population - Other South Central Asia (%)
Place of birth for the foreign-born population - Burma (%)
Place of birth for the foreign-born population - Cambodia (%)
Place of birth for the foreign-born population - Indonesia (%)
Place of birth for the foreign-born population - Laos (%)
Place of birth for the foreign-born population - Malaysia (%)
Place of birth for the foreign-born population - Philippines (%)
Place of birth for the foreign-born population - Singapore (%)
Place of birth for the foreign-born population - Thailand (%)
Place of birth for the foreign-born population - Vietnam (%)
Place of birth for the foreign-born population - Other South Eastern Asia (%)
Place of birth for the foreign-born population - Armenia (%)
Place of birth for the foreign-born population - Iraq (%)
Place of birth for the foreign-born population - Israel (%)
Place of birth for the foreign-born population - Jordan (%)
Place of birth for the foreign-born population - Kuwait (%)
Place of birth for the foreign-born population - Lebanon (%)
Place of birth for the foreign-born population - Saudi Arabia (%)
Place of birth for the foreign-born population - Syria (%)
Place of birth for the foreign-born population - Turkey (%)
Place of birth for the foreign-born population - Yemen (%)
Place of birth for the foreign-born population - Other Western Asia (%)
Place of birth for the foreign-born population - Eritrea (%)
Place of birth for the foreign-born population - Ethiopia (%)
Place of birth for the foreign-born population - Kenya (%)
Place of birth for the foreign-born population - Somalia (%)
Place of birth for the foreign-born population - Uganda (%)
Place of birth for the foreign-born population - Zimbabwe (%)
Place of birth for the foreign-born population - Other Eastern Africa (%)
Place of birth for the foreign-born population - Cameroon (%)
Place of birth for the foreign-born population - Congo (%)
Place of birth for the foreign-born population - Democratic Republic of Congo (Zaire) (%)
Place of birth for the foreign-born population - Other Middle Africa (%)
Place of birth for the foreign-born population - Egypt (%)
Place of birth for the foreign-born population - Morocco (%)
Place of birth for the foreign-born population - Sudan (%)
Place of birth for the foreign-born population - Other Northern Africa (%)
Place of birth for the foreign-born population - South Africa (%)
Place of birth for the foreign-born population - Other Southern Africa (%)
Place of birth for the foreign-born population - Cabo Verde (%)
Place of birth for the foreign-born population - Ghana (%)
Place of birth for the foreign-born population - Liberia (%)
Place of birth for the foreign-born population - Nigeria (%)
Place of birth for the foreign-born population - Senegal (%)
Place of birth for the foreign-born population - Sierra Leone (%)
Place of birth for the foreign-born population - Other Western Africa (%)
Place of birth for the foreign-born population - Australia (%)
Place of birth for the foreign-born population - New Zealand (%)
Place of birth for the foreign-born population - Fiji (%)
Place of birth for the foreign-born population - Micronesia (%)
Place of birth for the foreign-born population - Bahamas (%)
Place of birth for the foreign-born population - Barbados (%)
Place of birth for the foreign-born population - Cuba (%)
Place of birth for the foreign-born population - Dominica (%)
Place of birth for the foreign-born population - Dominican Republic (%)
Place of birth for the foreign-born population - Grenada (%)
Place of birth for the foreign-born population - Haiti (%)
Place of birth for the foreign-born population - Jamaica (%)
Place of birth for the foreign-born population - St. Vincent and the Grenadines (%)
Place of birth for the foreign-born population - Trinidad and Tobago (%)
Place of birth for the foreign-born population - West Indies (%)
Place of birth for the foreign-born population - Other Caribbean (%)
Place of birth for the foreign-born population - Belize (%)
Place of birth for the foreign-born population - Costa Rica (%)
Place of birth for the foreign-born population - El Salvador (%)
Place of birth for the foreign-born population - Guatemala (%)
Place of birth for the foreign-born population - Honduras (%)
Place of birth for the foreign-born population - Mexico (%)
Place of birth for the foreign-born population - Nicaragua (%)
Place of birth for the foreign-born population - Panama (%)
Place of birth for the foreign-born population - Other Central America (%)
Place of birth for the foreign-born population - Argentina (%)
Place of birth for the foreign-born population - Bolivia (%)
Place of birth for the foreign-born population - Brazil (%)
Place of birth for the foreign-born population - Chile (%)
Place of birth for the foreign-born population - Colombia (%)
Place of birth for the foreign-born population - Ecuador (%)
Place of birth for the foreign-born population - Guyana (%)
Place of birth for the foreign-born population - Peru (%)
Place of birth for the foreign-born population - Uruguay (%)
Place of birth for the foreign-born population - Venezuela (%)
Place of birth for the foreign-born population - Other South America (%)
Place of birth for the foreign-born population - Canada (%)
Place of birth for the foreign-born population - Other Northern America (%)
Place of birth for the foreign-born population - Other (%)
Latest news about races in Bithlo, FL collected exclusively by city-data.com from local newspapers, TV, and radio stations
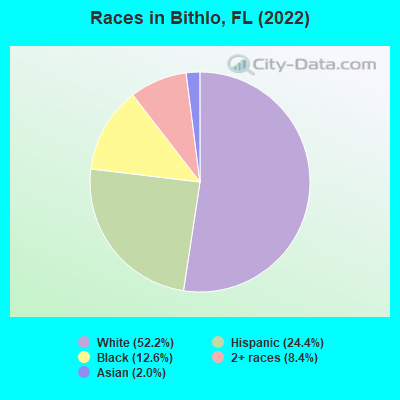
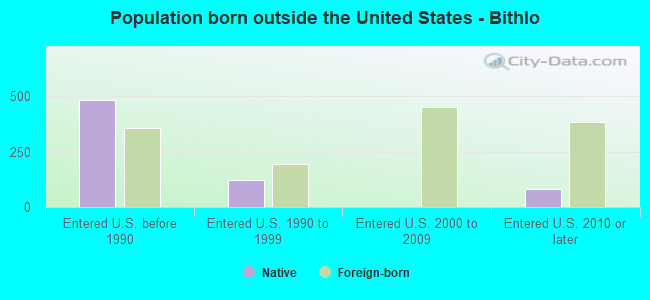
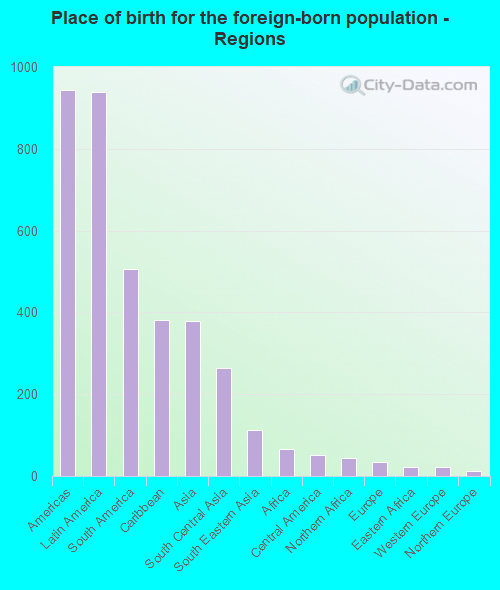
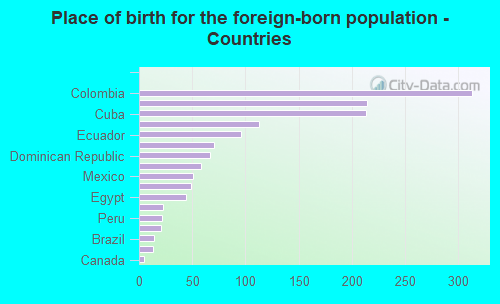
According to 2022 data, the most numerous races in Bithlo, FL are White alone (5,862 residents), Hispanic (2,747 residents), and Black alone (1,418 residents). 80.4% of Bithlo residents speak English at home. 12.7% of Bithlo, FL residents are foreign-born (8.1% born in Latin America, 3.2% born in Asia), which is 65.7% less than the foreign-born rate of 21.0% across the entire state of Florida.
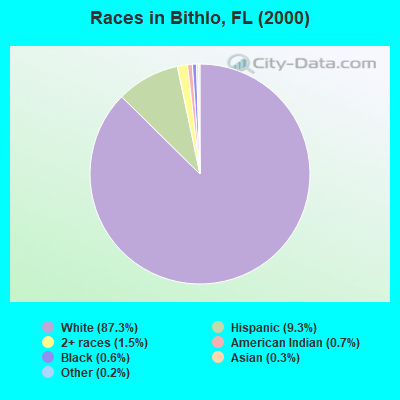
Race distribution in Bithlo
2000 2022
10,458,509 65.4% White alone 2,682,715 16.8% Hispanic 2,264,268 14.2% Black alone 261,693 1.6% Asian alone 236,954 1.5% Two or more races 42,358 0.3% American Indian alone 28,994 0.2% Other race alone 6,887 0.04% Native Hawaiian and Other
11,309,403 50.8% White alone 6,025,039 27.1% Hispanic 3,241,015 14.6% Black alone 861,630 3.9% Two or more races 623,692 2.8% Asian alone 152,054 0.7% Other race alone 22,504 0.1% American Indian alone 9,486 0.04% Native Hawaiian and Other
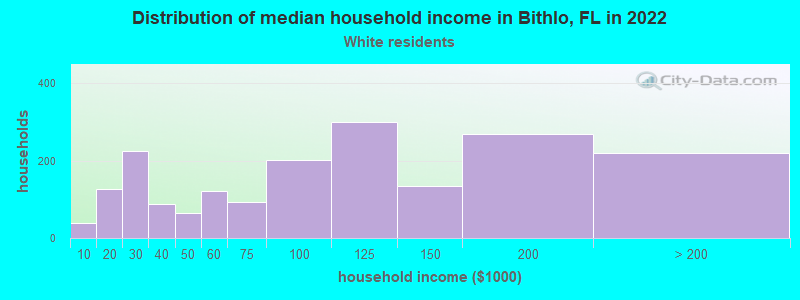
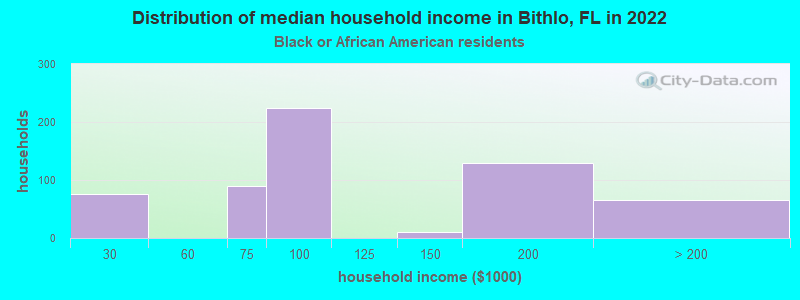
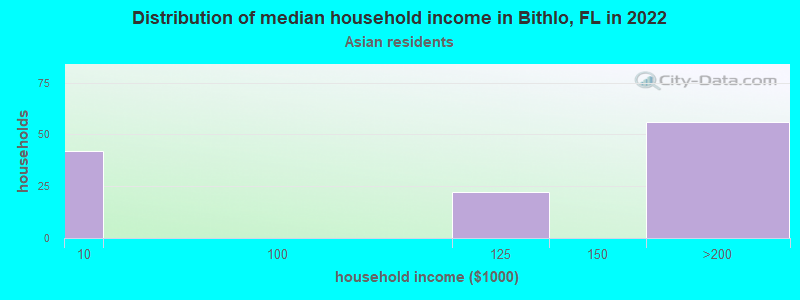
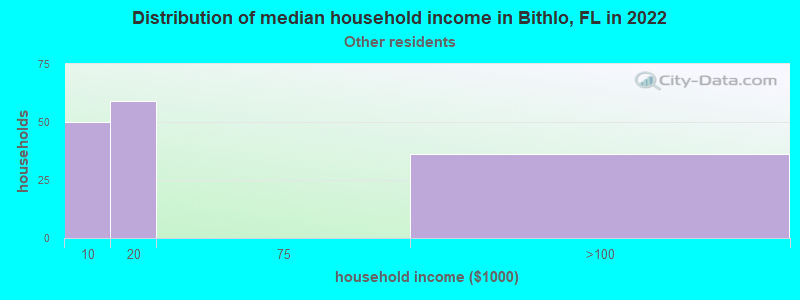
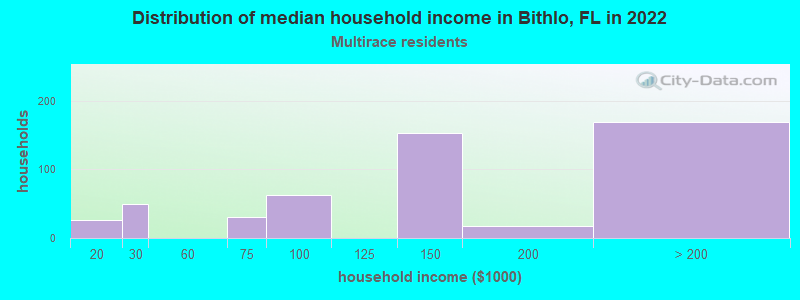
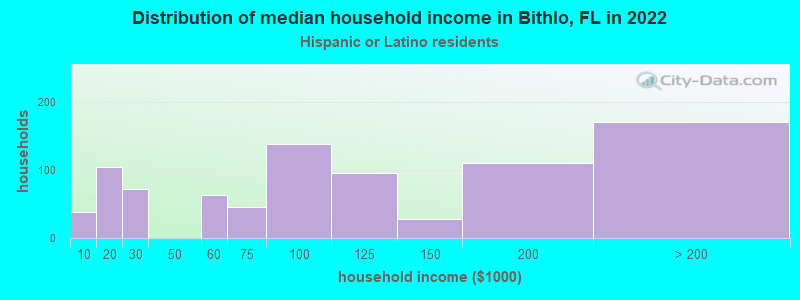
Income and house value in Bithlo Median household income in 2022 $78,661 White non-Hispanic householders$101,954 Black householders$148,344 Two or more races householders$89,882 Hispanic or Latino race householdersMedian 2022 house value $767,205 White Non-Hispanic householders$468,247 Two or more races householders$684,361 Hispanic or Latino householders
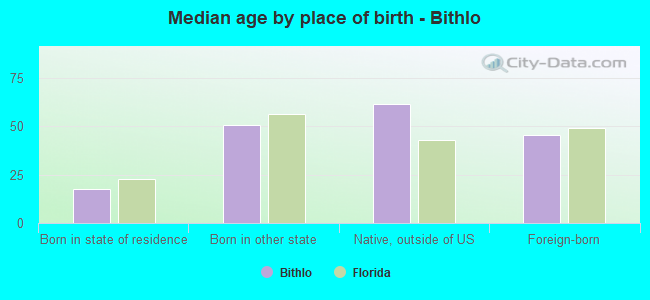
Median age by race in Bithlo
35.7 Median age for White residents35.6 35.6 48.1 Median age for Black or African American residents47.1 48.6 -614,300,100.1 Median age for American Indian / Alaska Native residents-735,632,183.2 -529,680,364.8 54.0 Median age for Asian residents44.1 55.5 -679,790,025.6 Median age for Native Hawaiian / Pacific Islander residents-1,327,635,326.3 -611,111,110.5 50.2 Median age for Other race residents55.5 26.6 31.0 Median age for Two or more races residents12.3 39.0 35.4 Median age for White alone residents35.1 36.1 35.3 Median age for Hispanic or Latino residents33.1 43.5
Owner/renter occupied households by race in Bithlo
House owners and renters - White residents 1,348 69.3% Owner occupied597 30.7% Renter occupiedHouse owners and renters - Black or African American residents 422 67.5% Owner occupied203 32.5% Renter occupiedHouse owners and renters - Asian residents 114 100.0% Owner occupiedHouse owners and renters - Other race residents 85 53.3% Owner occupied75 46.7% Renter occupiedHouse owners and renters - Two or more races residents 363 76.4% Owner occupied112 23.6% Renter occupiedHouse owners and renters - White alone residents 1,187 68.0% Owner occupied560 32.0% Renter occupiedHouse owners and renters - Hispanic or Latino residents 535 64.3% Owner occupied297 35.7% Renter occupied
Language usage in Bithlo
English speakers - Total 80.4% of residents of Bithlo speak English at home.
15.6% of residents speak Spanish at home 1,218 78.9% Speak English very well325 21.1% Speak English less than very well3.7% of residents speak other language at home 275 75.3% Speak English very well90 24.7% Speak English less than very well
English speakers - Born in the United States 92.2% of residents of Bithlo speak English at home.
6.4% of residents speak Spanish at home 251 100.0% Speak English very well1.3% of residents speak other language at home 49 100.0% Speak English very well
English speakers - Native, born elsewhere 70.8% of residents of Bithlo speak English at home.
29.1% of residents speak Spanish at home 118 60.5% Speak English very well77 39.5% Speak English less than very well
English speakers - Foreign-born 19.9% of residents of Bithlo speak English at home.
58.1% of residents speak Spanish at home 650 77.2% Speak English very well192 22.8% Speak English less than very well20.7% of residents speak other language at home 210 70.0% Speak English very well90 30.0% Speak English less than very well
White (Caucasian) - Speak only English Native:
99.8% (5,471)Foreign-born:
5.2% (19)
White (Caucasian) - Speak another language Native:
5.1% (279)Foreign-born:
91.9% (335)
Black or African American - Speak only English Native:
98.6% (1,034)Foreign-born:
100.0% (100)
Asian - Speak only English Native:
82.2% (31)Foreign-born:
12.7% (26)
Asian - Speak another language Native:
21.1% (8)Foreign-born:
85.9% (173)
Other race - Speak another language Native:
51.2% (131)Foreign-born:
100.0% (290)
Two or more races - Speak only English Native:
84.1% (906)Foreign-born:
50.1% (191)
Two or more races - Speak another language Native:
13.5% (145)Foreign-born:
48.9% (186)
White alone - Speak only English Native:
95.4% (4,949)Foreign-born:
23.7% (23)
White alone - Speak another language Native:
4.6% (237)Foreign-born:
76.4% (73)
Hispanic or Latino - Speak another language Native:
32.3% (499)Foreign-born:
100.0% (824)
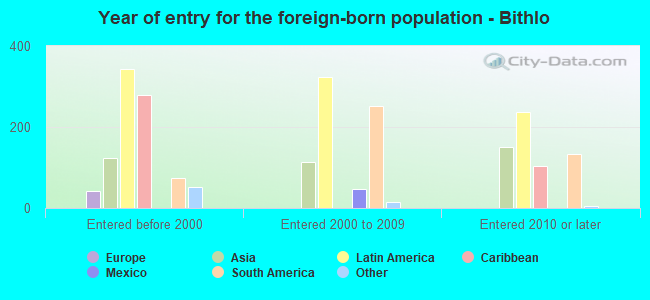
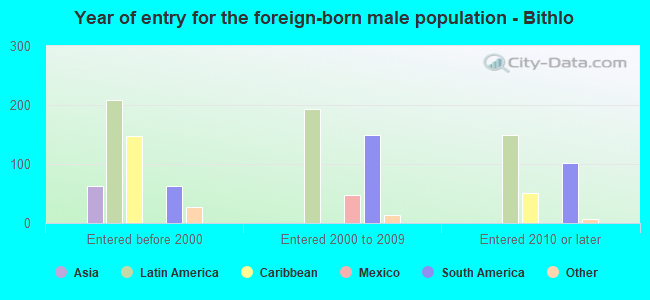
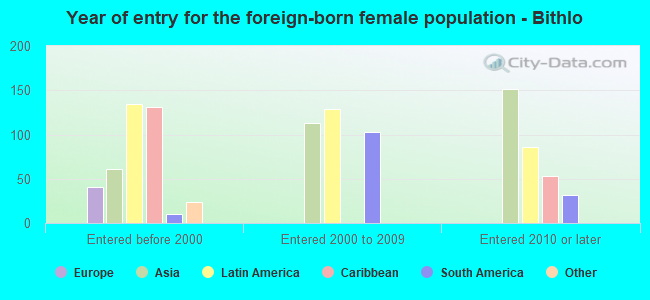
Foreign-born residents in Bithlo 1,424 residents are foreign born (8.1% Latin America , 3.2% Asia ).
This city:
12.7%Florida:
21.1%
Marital status for residents in Bithlo Marital status - White (Caucasian) population 15 years and over
Males 38.4% Never married44.8% Now married0.4% Separated1.1% Widowed15.3% DivorcedFemales 35.9% Never married50.1% Now married1.3% Separated6.5% Widowed6.3% DivorcedWomen who gave birth in the past 12 months Now married:
24.8% (42)Unmarried:
75.2% (128)
Women who did not give birth in the past 12 months Now married:
42.8% (460)Unmarried:
57.2% (615)
Marital status - Black or African American population 15 years and over
Males 16.1% Never married75.7% Now married0.0% Separated2.6% Widowed5.6% DivorcedFemales 30.8% Never married69.2% Now married0.0% Separated0.0% Widowed0.0% DivorcedWomen who gave birth in the past 12 months Now married:
0.0% (0)Unmarried:
100.0% (110)
Women who did not give birth in the past 12 months Now married:
85.1% (319)Unmarried:
14.9% (56)
Marital status - Asian population 15 years and over
Males 42.5% Never married38.1% Now married0.0% Separated0.0% Widowed19.5% DivorcedFemales 0.0% Never married52.7% Now married31.8% Separated15.5% Widowed0.0% DivorcedWomen who did not give birth in the past 12 months Now married:
100.0% (44)Unmarried:
0.0% (0)
Marital status - Other race population 15 years and over
Males 20.6% Never married50.5% Now married22.5% Separated6.4% Widowed0.0% DivorcedFemales 49.0% Never married51.0% Now married0.0% Separated0.0% Widowed0.0% DivorcedWomen who did not give birth in the past 12 months Now married:
25.0% (33)Unmarried:
75.0% (99)
Marital status - Two or more races population 15 years and over
Males 30.3% Never married69.7% Now married0.0% Separated0.0% Widowed0.0% DivorcedFemales 45.8% Never married32.8% Now married0.0% Separated12.4% Widowed9.0% DivorcedWomen who did not give birth in the past 12 months Now married:
25.8% (136)Unmarried:
74.2% (391)
Marital status - White alone, not Hispanic / Latino population 15 years and over
Males 33.7% Never married45.9% Now married0.6% Separated1.5% Widowed18.4% DivorcedFemales 36.5% Never married45.6% Now married1.6% Separated8.2% Widowed8.0% DivorcedWomen who gave birth in the past 12 months Now married:
24.8% (50)Unmarried:
75.2% (152)
Women who did not give birth in the past 12 months Now married:
46.5% (481)Unmarried:
53.5% (555)
Marital status - Hispanic or Latino population 15 years and over
Males 44.0% Never married45.4% Now married4.2% Separated1.2% Widowed5.2% DivorcedFemales 32.5% Never married54.2% Now married0.0% Separated7.7% Widowed5.6% DivorcedWomen who did not give birth in the past 12 months Now married:
23.2% (95)Unmarried:
76.8% (316)
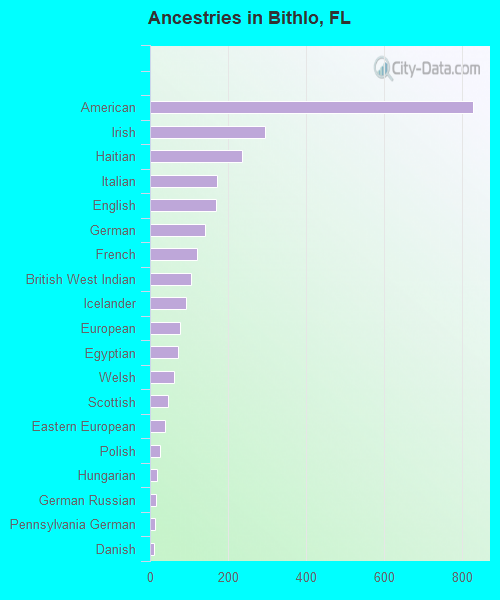
Ancestries in Bithlo
827 16.8% American294 6.0% Irish236 4.8% Haitian171 3.5% Italian169 3.4% English141 2.9% German121 2.5% French105 2.1% British West Indian91 1.8% Icelander77 1.6% European72 1.5% Egyptian61 1.2% Welsh45 0.9% Scottish38 0.8% Eastern European25 0.5% Polish17 0.3% Hungarian15 0.3% German Russian12 0.2% Pennsylvania German11 0.2% Danish
Children Nativity (place of birth) in Bithlo
Children under 6 years - Living with two parents Both parents native 320 100.0% NativeBoth parents foreign-born 45 100.0% NativeOne native, one foreign-born parent 163 100.0% NativeChildren under 6 years - Living with one parent Native parent 711 100.0% NativeForeign-born parent 43 100.0% Native
Children 6 to 17 years - Living with two parents Both parents native 592 100.0% NativeBoth parents foreign-born 44 100.0% NativeOne native, one foreign-born parent 321 100.0% NativeChildren 6 to 17 years - Living with one parent Native parent 348 100.0% Native
Grandparents responsible for own grandchildren in Bithlo
Grandparents (30 to 59 years) White / Caucasian 17 100.0% Not responsible for grandchildrenWhite alone, not Hispanic / Latino 25 100.0% Not responsible for grandchildrenGrandparents (60 years and over) White / Caucasian 8 9.2% Responsible for grandchildren83 90.8% Not responsible for grandchildrenWhite alone, not Hispanic / Latino 12 9.7% Responsible for grandchildren113 90.3% Not responsible for grandchildren