Races in Blackfoot, Idaho (ID) Detailed Stats
Data:
Races - White alone (%)
Races - White alone (% change since 2000)
Races - Black alone (%)
Races - Black alone (% change since 2000)
Races - American Indian alone (%)
Races - American Indian alone (% change since 2000)
Races - Asian alone (%)
Races - Asian alone (% change since 2000)
Races - Hispanic (%)
Races - Hispanic (% change since 2000)
Races - Native Hawaiian and Other Pacific Islander alone (%)
Races - Native Hawaiian and Other Pacific Islander alone (% change since 2000)
Races - Two or more races(%)
Races - Two or more races(% change since 2000)
Races - Other race alone (%)
Races - Other race alone (% change since 2000)
Racial diversity
Place of birth - Born in state of residence (%)
Place of birth - Born in state of residence (%) - White
Place of birth - Born in state of residence (%) - Black or African American
Place of birth - Born in state of residence (%) - Asian
Place of birth - Born in state of residence (%) - Hispanic or Latino
Place of birth - Born in state of residence (%) - American Indian and Alaska Native
Place of birth - Born in state of residence (%) - Multirace
Place of birth - Born in state of residence (%) - Other Race
Place of birth - Born in other state (%)
Place of birth - Born in other state (%) - White
Place of birth - Born in other state (%) - Black or African American
Place of birth - Born in other state (%) - Asian
Place of birth - Born in other state (%) - Hispanic or Latino
Place of birth - Born in other state (%) - American Indian and Alaska Native
Place of birth - Born in other state (%) - Multirace
Place of birth - Born in other state (%) - Other Race
Place of birth - Native, outside of US (%)
Place of birth - Native, outside of US (%) - White
Place of birth - Native, outside of US (%) - Black or African American
Place of birth - Native, outside of US (%) - Asian
Place of birth - Native, outside of US (%) - Hispanic or Latino
Place of birth - Native, outside of US (%) - American Indian and Alaska Native
Place of birth - Native, outside of US (%) - Multirace
Place of birth - Native, outside of US (%) - Other Race
Place of birth - Foreign born (%)
Place of birth - Foreign born (%) - White
Place of birth - Foreign born (%) - Black or African American
Place of birth - Foreign born (%) - Asian
Place of birth - Foreign born (%) - Hispanic or Latino
Place of birth - Foreign born (%) - American Indian and Alaska Native
Place of birth - Foreign born (%) - Multirace
Place of birth - Foreign born (%) - Other Race
Residents speaking English at home (%)
Residents speaking English at home - Born in the United States (%)
Residents speaking English at home - Native, born elsewhere (%)
Residents speaking English at home - Foreign born (%)
Residents speaking Spanish at home (%)
Residents speaking Spanish at home - Born in the United States (%)
Residents speaking Spanish at home - Native, born elsewhere (%)
Residents speaking Spanish at home - Foreign born (%)
Residents speaking other language at home (%)
Residents speaking other language at home - Born in the United States (%)
Residents speaking other language at home - Native, born elsewhere (%)
Residents speaking other language at home - Foreign born (%)
Marital status - Never married (%)
Marital status - Now married (%)
Marital status - Separated (%)
Marital status - Widowed (%)
Marital status - Divorced (%)
Ancestries Reported - Arab (%)
Ancestries Reported - Czech (%)
Ancestries Reported - Danish (%)
Ancestries Reported - Dutch (%)
Ancestries Reported - English (%)
Ancestries Reported - French (%)
Ancestries Reported - French Canadian (%)
Ancestries Reported - German (%)
Ancestries Reported - Greek (%)
Ancestries Reported - Hungarian (%)
Ancestries Reported - Irish (%)
Ancestries Reported - Italian (%)
Ancestries Reported - Lithuanian (%)
Ancestries Reported - Norwegian (%)
Ancestries Reported - Polish (%)
Ancestries Reported - Portuguese (%)
Ancestries Reported - Russian (%)
Ancestries Reported - Scotch-Irish (%)
Ancestries Reported - Scottish (%)
Ancestries Reported - Slovak (%)
Ancestries Reported - Subsaharan African (%)
Ancestries Reported - Swedish (%)
Ancestries Reported - Swiss (%)
Ancestries Reported - Ukrainian (%)
Ancestries Reported - United States (%)
Ancestries Reported - Welsh (%)
Ancestries Reported - West Indian (%)
Ancestries Reported - Other (%)
Geographical mobility - Same house 1 year ago (%)
Geographical mobility - Same house 1 year ago (%) - White
Geographical mobility - Same house 1 year ago (%) - Black or African American
Geographical mobility - Same house 1 year ago (%) - Asian
Geographical mobility - Same house 1 year ago (%) - Hispanic or Latino
Geographical mobility - Same house 1 year ago (%) - American Indian and Alaska Native
Geographical mobility - Same house 1 year ago (%) - Multirace
Geographical mobility - Same house 1 year ago (%) - Other Race
Geographical mobility - Moved within same county (%)
Geographical mobility - Moved within same county (%) - White
Geographical mobility - Moved within same county (%) - Black or African American
Geographical mobility - Moved within same county (%) - Asian
Geographical mobility - Moved within same county (%) - Hispanic or Latino
Geographical mobility - Moved within same county (%) - American Indian and Alaska Native
Geographical mobility - Moved within same county (%) - Multirace
Geographical mobility - Moved within same county (%) - Other Race
Geographical mobility - Moved from different county within same state (%)
Geographical mobility - Moved from different county within same state (%) - White
Geographical mobility - Moved from different county within same state (%) - Black or African American
Geographical mobility - Moved from different county within same state (%) - Asian
Geographical mobility - Moved from different county within same state (%) - Hispanic or Latino
Geographical mobility - Moved from different county within same state (%) - American Indian and Alaska Native
Geographical mobility - Moved from different county within same state (%) - Multirace
Geographical mobility - Moved from different county within same state (%) - Other Race
Geographical mobility - Moved from different state (%)
Geographical mobility - Moved from different state (%) - White
Geographical mobility - Moved from different state (%) - Black or African American
Geographical mobility - Moved from different state (%) - Asian
Geographical mobility - Moved from different state (%) - Hispanic or Latino
Geographical mobility - Moved from different state (%) - American Indian and Alaska Native
Geographical mobility - Moved from different state (%) - Multirace
Geographical mobility - Moved from different state (%) - Other Race
Geographical mobility - Moved from abroad (%)
Geographical mobility - Moved from abroad (%) - White
Geographical mobility - Moved from abroad (%) - Black or African American
Geographical mobility - Moved from abroad (%) - Asian
Geographical mobility - Moved from abroad (%) - Hispanic or Latino
Geographical mobility - Moved from abroad (%) - American Indian and Alaska Native
Geographical mobility - Moved from abroad (%) - Multirace
Geographical mobility - Moved from abroad (%) - Other Race
Place of birth for the foreign-born population - Ireland (%)
Place of birth for the foreign-born population - Denmark (%)
Place of birth for the foreign-born population - Norway (%)
Place of birth for the foreign-born population - Sweden (%)
Place of birth for the foreign-born population - United Kingdom (%)
Place of birth for the foreign-born population - England (%)
Place of birth for the foreign-born population - Scotland (%)
Place of birth for the foreign-born population - Other Northern Europe (%)
Place of birth for the foreign-born population - Austria (%)
Place of birth for the foreign-born population - Belgium (%)
Place of birth for the foreign-born population - France (%)
Place of birth for the foreign-born population - Germany (%)
Place of birth for the foreign-born population - Netherlands (%)
Place of birth for the foreign-born population - Switzerland (%)
Place of birth for the foreign-born population - Other Western Europe (%)
Place of birth for the foreign-born population - Greece (%)
Place of birth for the foreign-born population - Italy (%)
Place of birth for the foreign-born population - Portugal (%)
Place of birth for the foreign-born population - Spain (%)
Place of birth for the foreign-born population - Other Southern Europe (%)
Place of birth for the foreign-born population - Albania (%)
Place of birth for the foreign-born population - Belarus (%)
Place of birth for the foreign-born population - Bosnia and Herzegovina (%)
Place of birth for the foreign-born population - Bulgaria (%)
Place of birth for the foreign-born population - Croatia (%)
Place of birth for the foreign-born population - Czechoslovakia (%)
Place of birth for the foreign-born population - Hungary (%)
Place of birth for the foreign-born population - Latvia (%)
Place of birth for the foreign-born population - Lithuania (%)
Place of birth for the foreign-born population - North Macedonia (Macedonia) (%)
Place of birth for the foreign-born population - Moldova (%)
Place of birth for the foreign-born population - Poland (%)
Place of birth for the foreign-born population - Romania (%)
Place of birth for the foreign-born population - Russia (%)
Place of birth for the foreign-born population - Serbia (%)
Place of birth for the foreign-born population - Ukraine (%)
Place of birth for the foreign-born population - Other Eastern Europe (%)
Place of birth for the foreign-born population - China (%)
Place of birth for the foreign-born population - Hong Kong (%)
Place of birth for the foreign-born population - Taiwan (%)
Place of birth for the foreign-born population - Japan (%)
Place of birth for the foreign-born population - Korea (%)
Place of birth for the foreign-born population - Other Eastern Asia (%)
Place of birth for the foreign-born population - Afghanistan (%)
Place of birth for the foreign-born population - Bangladesh (%)
Place of birth for the foreign-born population - India (%)
Place of birth for the foreign-born population - Iran (%)
Place of birth for the foreign-born population - Kazakhstan (%)
Place of birth for the foreign-born population - Nepal (%)
Place of birth for the foreign-born population - Pakistan (%)
Place of birth for the foreign-born population - Sri Lanka (%)
Place of birth for the foreign-born population - Uzbekistan (%)
Place of birth for the foreign-born population - Other South Central Asia (%)
Place of birth for the foreign-born population - Burma (%)
Place of birth for the foreign-born population - Cambodia (%)
Place of birth for the foreign-born population - Indonesia (%)
Place of birth for the foreign-born population - Laos (%)
Place of birth for the foreign-born population - Malaysia (%)
Place of birth for the foreign-born population - Philippines (%)
Place of birth for the foreign-born population - Singapore (%)
Place of birth for the foreign-born population - Thailand (%)
Place of birth for the foreign-born population - Vietnam (%)
Place of birth for the foreign-born population - Other South Eastern Asia (%)
Place of birth for the foreign-born population - Armenia (%)
Place of birth for the foreign-born population - Iraq (%)
Place of birth for the foreign-born population - Israel (%)
Place of birth for the foreign-born population - Jordan (%)
Place of birth for the foreign-born population - Kuwait (%)
Place of birth for the foreign-born population - Lebanon (%)
Place of birth for the foreign-born population - Saudi Arabia (%)
Place of birth for the foreign-born population - Syria (%)
Place of birth for the foreign-born population - Turkey (%)
Place of birth for the foreign-born population - Yemen (%)
Place of birth for the foreign-born population - Other Western Asia (%)
Place of birth for the foreign-born population - Eritrea (%)
Place of birth for the foreign-born population - Ethiopia (%)
Place of birth for the foreign-born population - Kenya (%)
Place of birth for the foreign-born population - Somalia (%)
Place of birth for the foreign-born population - Uganda (%)
Place of birth for the foreign-born population - Zimbabwe (%)
Place of birth for the foreign-born population - Other Eastern Africa (%)
Place of birth for the foreign-born population - Cameroon (%)
Place of birth for the foreign-born population - Congo (%)
Place of birth for the foreign-born population - Democratic Republic of Congo (Zaire) (%)
Place of birth for the foreign-born population - Other Middle Africa (%)
Place of birth for the foreign-born population - Egypt (%)
Place of birth for the foreign-born population - Morocco (%)
Place of birth for the foreign-born population - Sudan (%)
Place of birth for the foreign-born population - Other Northern Africa (%)
Place of birth for the foreign-born population - South Africa (%)
Place of birth for the foreign-born population - Other Southern Africa (%)
Place of birth for the foreign-born population - Cabo Verde (%)
Place of birth for the foreign-born population - Ghana (%)
Place of birth for the foreign-born population - Liberia (%)
Place of birth for the foreign-born population - Nigeria (%)
Place of birth for the foreign-born population - Senegal (%)
Place of birth for the foreign-born population - Sierra Leone (%)
Place of birth for the foreign-born population - Other Western Africa (%)
Place of birth for the foreign-born population - Australia (%)
Place of birth for the foreign-born population - New Zealand (%)
Place of birth for the foreign-born population - Fiji (%)
Place of birth for the foreign-born population - Micronesia (%)
Place of birth for the foreign-born population - Bahamas (%)
Place of birth for the foreign-born population - Barbados (%)
Place of birth for the foreign-born population - Cuba (%)
Place of birth for the foreign-born population - Dominica (%)
Place of birth for the foreign-born population - Dominican Republic (%)
Place of birth for the foreign-born population - Grenada (%)
Place of birth for the foreign-born population - Haiti (%)
Place of birth for the foreign-born population - Jamaica (%)
Place of birth for the foreign-born population - St. Vincent and the Grenadines (%)
Place of birth for the foreign-born population - Trinidad and Tobago (%)
Place of birth for the foreign-born population - West Indies (%)
Place of birth for the foreign-born population - Other Caribbean (%)
Place of birth for the foreign-born population - Belize (%)
Place of birth for the foreign-born population - Costa Rica (%)
Place of birth for the foreign-born population - El Salvador (%)
Place of birth for the foreign-born population - Guatemala (%)
Place of birth for the foreign-born population - Honduras (%)
Place of birth for the foreign-born population - Mexico (%)
Place of birth for the foreign-born population - Nicaragua (%)
Place of birth for the foreign-born population - Panama (%)
Place of birth for the foreign-born population - Other Central America (%)
Place of birth for the foreign-born population - Argentina (%)
Place of birth for the foreign-born population - Bolivia (%)
Place of birth for the foreign-born population - Brazil (%)
Place of birth for the foreign-born population - Chile (%)
Place of birth for the foreign-born population - Colombia (%)
Place of birth for the foreign-born population - Ecuador (%)
Place of birth for the foreign-born population - Guyana (%)
Place of birth for the foreign-born population - Peru (%)
Place of birth for the foreign-born population - Uruguay (%)
Place of birth for the foreign-born population - Venezuela (%)
Place of birth for the foreign-born population - Other South America (%)
Place of birth for the foreign-born population - Canada (%)
Place of birth for the foreign-born population - Other Northern America (%)
Place of birth for the foreign-born population - Other (%)
Latest news about races in Blackfoot, ID collected exclusively by city-data.com from local newspapers, TV, and radio stations
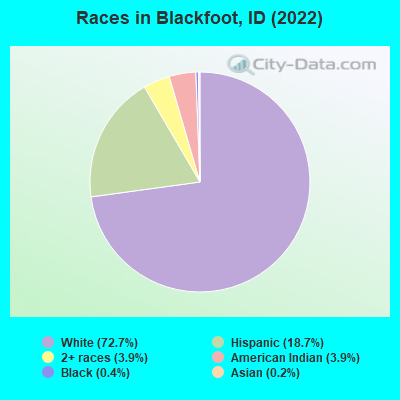
According to 2022 data, the most numerous races in Blackfoot, ID are White alone (9,388 residents), Hispanic (2,417 residents), and Two or more races (505 residents). 88.6% of Blackfoot residents speak English at home. 4.9% of Blackfoot, ID residents are foreign-born (4.0% born in Latin America, 0.5% born in North America), which is 2.8% less than the foreign-born rate of 5.0% across the entire state of Idaho.
Race distribution in Blackfoot
2000 2022
1,139,291 88.0% White alone 101,690 7.9% Hispanic 18,261 1.4% Two or more races 15,789 1.2% American Indian alone 11,641 0.9% Asian alone 4,889 0.4% Black alone 1,192 0.09% Other race alone 1,200 0.09% Native Hawaiian and Other
1,531,219 79.0% White alone 261,921 13.5% Hispanic 81,112 4.2% Two or more races 25,174 1.3% Asian alone 15,825 0.8% American Indian alone 11,868 0.6% Black alone 8,752 0.5% Other race alone 3,162 0.2% Native Hawaiian and Other
Income and house value in Blackfoot Median household income in 2022 $63,142 White non-Hispanic householders$40,574 American Indian and Alaska Native householders$40,594 Two or more races householders$50,361 Hispanic or Latino race householdersMedian 2022 house value $282,064 White Non-Hispanic householders$300,719 American Indian or Alaska Native householders $317,136 Asian householders$246,247 Some other race householders$263,409 Two or more races householders$248,112 Hispanic or Latino householders
Median age by race in Blackfoot
40.1 Median age for White residents37.6 43.1 14.2 Median age for Black or African American residents-680,851,063.1 -869,696,968.8 21.9 Median age for American Indian / Alaska Native residents38.4 18.6 -687,208,215.9 Median age for Asian residents-720,720,720.0 -642,796,248.3 -393,939,393.5 Median age for Native Hawaiian / Pacific Islander residents-355,119,825.4 -679,245,282.3 29.7 Median age for Other race residents40.3 26.1 18.6 Median age for Two or more races residents22.2 12.7 40.7 Median age for White alone residents38.4 42.9 25.3 Median age for Hispanic or Latino residents31.7 16.5
Owner/renter occupied households by race in Blackfoot
House owners and renters - White residents 2,584 72.4% Owner occupied986 27.6% Renter occupiedHouse owners and renters - American Indian / Alaska Native residents 52 24.2% Owner occupied162 75.8% Renter occupiedHouse owners and renters - Asian residents 11 100.0% Owner occupiedHouse owners and renters - Other race residents 203 80.7% Owner occupied49 19.3% Renter occupiedHouse owners and renters - Two or more races residents 189 52.7% Owner occupied169 47.3% Renter occupiedHouse owners and renters - White alone residents 2,597 72.5% Owner occupied984 27.5% Renter occupiedHouse owners and renters - Hispanic or Latino residents 258 80.0% Owner occupied65 20.0% Renter occupied
Language usage in Blackfoot
English speakers - Total 88.6% of residents of Blackfoot speak English at home.
10.2% of residents speak Spanish at home 799 65.8% Speak English very well415 34.2% Speak English less than very well0.9% of residents speak other language at home 98 87.5% Speak English very well14 12.5% Speak English less than very well
English speakers - Born in the United States 93.0% of residents of Blackfoot speak English at home.
6.6% of residents speak Spanish at home 270 91.5% Speak English very well25 8.5% Speak English less than very well0.6% of residents speak other language at home 27 100.0% Speak English very well
English speakers - Native, born elsewhere 97.2% of residents of Blackfoot speak English at home.
English speakers - Foreign-born 14.2% of residents of Blackfoot speak English at home.
73.6% of residents speak Spanish at home 150 30.4% Speak English very well343 69.6% Speak English less than very well7.9% of residents speak other language at home 45 84.9% Speak English very well8 15.1% Speak English less than very well
White (Caucasian) - Speak only English Native:
97.2% (8,879)Foreign-born:
53.6% (69)
White (Caucasian) - Speak another language Native:
2.8% (253)Foreign-born:
45.0% (58)
American Indian / Alaska Native - Speak another language Native:
9.1% (46)Foreign-born:
98.9% (20)
Asian - Speak only English Native:
100.0% (20)Foreign-born:
100.0% (10)
Other race - Speak another language Native:
55.5% (365)Foreign-born:
99.1% (436)
Two or more races - Speak another language Native:
10.0% (91)Foreign-born:
97.2% (78)
White alone - Speak only English Native:
98.3% (8,620)Foreign-born:
44.3% (57)
White alone - Speak another language Native:
1.7% (151)Foreign-born:
52.9% (68)
Hispanic or Latino - Speak only English Native:
60.0% (900)Foreign-born:
4.6% (24)
Hispanic or Latino - Speak another language Native:
40.0% (600)Foreign-born:
94.8% (499)
Foreign-born residents in Blackfoot 628 residents are foreign born (4.0% Latin America , 0.5% North America ).
Marital status for residents in Blackfoot Marital status - White (Caucasian) population 15 years and over
Males 31.6% Never married52.4% Now married0.3% Separated2.7% Widowed13.0% DivorcedFemales 21.3% Never married49.3% Now married0.0% Separated10.1% Widowed19.2% DivorcedWomen who gave birth in the past 12 months Now married:
47.5% (104)Unmarried:
52.5% (115)
Women who did not give birth in the past 12 months Now married:
44.0% (819)Unmarried:
56.0% (1,045)
Marital status - American Indian / Alaska Native population 15 years and over
Males 50.6% Never married0.0% Now married3.2% Separated0.0% Widowed46.1% DivorcedFemales 61.2% Never married8.7% Now married0.0% Separated6.6% Widowed23.5% DivorcedWomen who gave birth in the past 12 months Now married:
0.0% (0)Unmarried:
100.0% (58)
Women who did not give birth in the past 12 months Now married:
11.6% (15)Unmarried:
88.4% (113)
Marital status - Other race population 15 years and over
Males 31.3% Never married59.5% Now married0.0% Separated0.0% Widowed9.1% DivorcedFemales 49.1% Never married29.9% Now married0.0% Separated5.8% Widowed15.2% DivorcedWomen who gave birth in the past 12 months Now married:
100.0% (28)Unmarried:
0.0% (0)
Women who did not give birth in the past 12 months Now married:
23.2% (61)Unmarried:
76.8% (204)
Marital status - Two or more races population 15 years and over
Males 33.8% Never married36.4% Now married0.0% Separated0.0% Widowed29.8% DivorcedFemales 22.4% Never married59.9% Now married0.0% Separated10.1% Widowed7.6% DivorcedWomen who gave birth in the past 12 months Now married:
0.0% (0)Unmarried:
100.0% (17)
Women who did not give birth in the past 12 months Now married:
62.6% (156)Unmarried:
37.4% (93)
Marital status - White alone, not Hispanic / Latino population 15 years and over
Males 31.7% Never married51.5% Now married0.4% Separated2.8% Widowed13.7% DivorcedFemales 20.5% Never married48.9% Now married0.0% Separated10.6% Widowed20.1% DivorcedWomen who gave birth in the past 12 months Now married:
47.5% (107)Unmarried:
52.5% (118)
Women who did not give birth in the past 12 months Now married:
43.9% (782)Unmarried:
56.1% (1,000)
Marital status - Hispanic or Latino population 15 years and over
Males 32.8% Never married60.6% Now married0.6% Separated0.0% Widowed6.0% DivorcedFemales 39.3% Never married43.1% Now married0.0% Separated5.7% Widowed11.8% DivorcedWomen who gave birth in the past 12 months Now married:
100.0% (27)Unmarried:
0.0% (0)
Women who did not give birth in the past 12 months Now married:
36.9% (163)Unmarried:
63.1% (278)
Ancestries in Blackfoot
1,172 23.4% English620 12.4% American281 5.6% European274 5.5% Irish232 4.6% German107 2.1% Danish88 1.8% Swedish85 1.7% Italian72 1.4% Scottish59 1.2% Norwegian50 1.0% Northern European38 0.8% Portuguese34 0.7% French Canadian20 0.4% British20 0.4% Hungarian20 0.4% Welsh16 0.3% Basque12 0.2% Czechoslovakian9 0.2% Scotch-Irish7 0.1% Dutch
Children Nativity (place of birth) in Blackfoot
Children under 6 years - Living with two parents Both parents native 677 100.0% NativeBoth parents foreign-born 100 100.0% NativeOne native, one foreign-born parent 15 100.0% NativeChildren under 6 years - Living with one parent Native parent 372 100.0% NativeChildren 6 to 17 years - Living with two parents Both parents native 1,185 100.0% NativeBoth parents foreign-born 84 100.0% NativeOne native, one foreign-born parent 98 100.0% NativeChildren 6 to 17 years - Living with one parent Native parent 676 100.0% NativeForeign-born parent 66 51.1% Native63 48.9% Foreign-born
Grandparents responsible for own grandchildren in Blackfoot
Grandparents (30 to 59 years) White / Caucasian 11 21.4% Responsible for grandchildren42 78.6% Not responsible for grandchildrenWhite alone, not Hispanic / Latino 12 28.2% Responsible for grandchildren31 71.8% Not responsible for grandchildrenHispanic or Latino 15 100.0% Not responsible for grandchildrenGrandparents (60 years and over) White / Caucasian 55 46.0% Responsible for grandchildren64 54.0% Not responsible for grandchildrenWhite alone, not Hispanic / Latino 55 45.1% Responsible for grandchildren66 54.9% Not responsible for grandchildrenHispanic or Latino 22 100.0% Responsible for grandchildren