Races in Blaine, Washington (WA) Detailed Stats
Ancestries, Foreign-born residents, place of birth
Settings
X


Recent posts about races in Blaine, Washington on our local forum with over 2,400,000 registered users:
 | Retirees moving to Washington (62 replies) |
| Asian Giant Hornets in Washington, OMG what next? (23 replies) |
| Considering a move to Seattle - will our budget work for what we want? (16 replies) |
| Blaine, WA. (17 replies) |
| African-Americans in Lynden, Bellingham, Blaine, Ferndale …? (16 replies) |
| Anyone from Point Roberts, WA? (65 replies) |
Latest news about races in Blaine, WA collected exclusively by city-data.com from local newspapers, TV, and radio stations
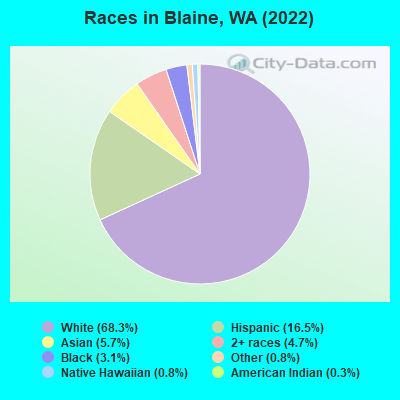
According to 2022 data, the most numerous races in Blaine, WA are White alone (4,078 residents), Hispanic (985 residents), and Asian alone (342 residents). 86.4% of Blaine residents speak English at home. 17.4% of Blaine, WA residents are foreign-born (7.3% born in North America, 4.6% born in Asia, 3.2% born in Latin America), which is 13.8% greater than the foreign-born rate of 15.0% across the entire state of Washington.
Race distribution in Blaine
2000
2022

- 3,23085.7%White alone
- 1644.4%Hispanic
- 1574.2%Asian alone
- 1062.8%Two or more races
- 451.2%Black alone
- 361.0%American Indian alone
- 250.7%Native Hawaiian and Other
Pacific Islander alone - 70.2%Other race alone

-
- 4,07868.3%White alone
- 98516.5%Hispanic
- 3425.7%Asian alone
- 2784.7%Two or more races
- 1833.1%Black alone
- 470.8%Native Hawaiian and Other
Pacific Islander alone - 490.8%Other race alone
- 180.3%American Indian alone
2000
2022
-
- 4,652,49078.9%White alone
- 441,5097.5%Hispanic
- 319,4015.4%Asian alone
- 184,6313.1%Black alone
- 175,9263.0%Two or more races
- 85,3961.4%American Indian alone
- 22,7790.4%Native Hawaiian and Other
Pacific Islander alone - 11,9890.2%Other race alone

-
- 4,941,45663.5%White alone
- 1,093,31314.0%Hispanic
- 755,8329.7%Asian alone
- 523,4486.7%Two or more races
- 299,5373.8%Black alone
- 69,0240.9%American Indian alone
- 52,2310.7%Native Hawaiian and Other
Pacific Islander alone - 50,9450.7%Other race alone

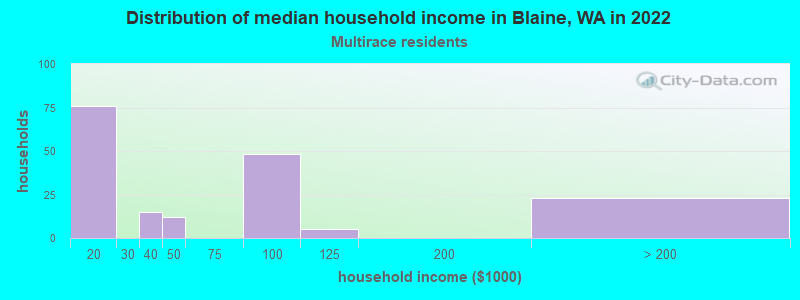
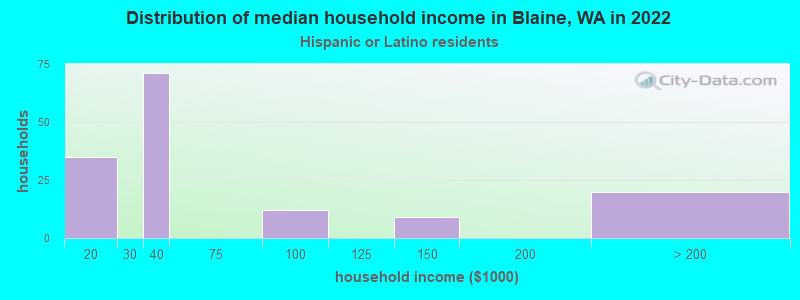
Income and house value in Blaine
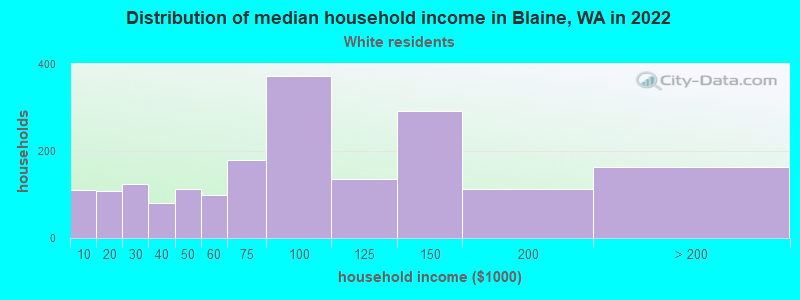
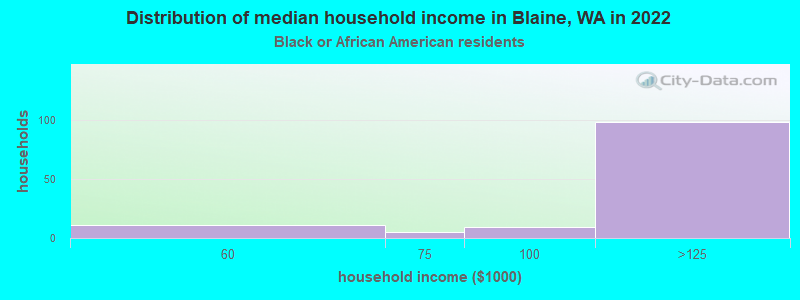
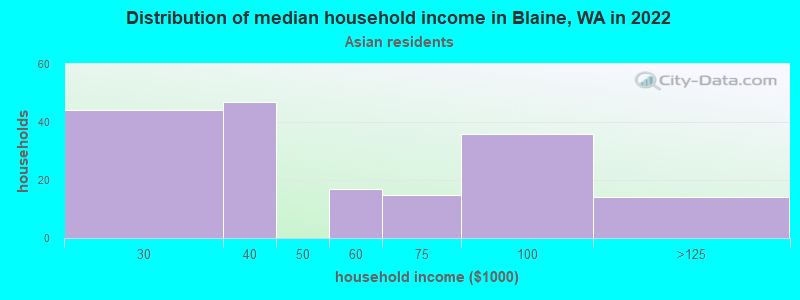
- Median household income in 2022
- $79,164White non-Hispanic householders
- $107,209Black householders
- Median 2022 house value
- $597,262White Non-Hispanic householders
- $475,863American Indian or Alaska Native householders
- $687,359Asian householders
- $401,840Some other race householders
- $581,611Two or more races householders
- $401,840Hispanic or Latino householders
Household income for White non-Hispanic householders
Household income for Black householders
Household income for Asian householders
Household income for Native Hawaiian and other Pacific Islander householders

Household income for Two or more races householders
Household income for Hispanic or Latino race householders
Median age by race in Blaine
- 41.6Median age for White residents
- 41.4Males
- 41.8Females
- 36.7Median age for Black or African American residents
- 43.6Males
- -887,198,985.2Females
- -713,963,963.2Median age for American Indian / Alaska Native residents
- -555,555,555.0Males
- -782,894,736.1Females
- 46.3Median age for Asian residents
- 58.5Males
- 44.9Females
- 23.6Median age for Native Hawaiian / Pacific Islander residents
- -696,774,192.9Males
- 52.4Females
- 8.0Median age for Other race residents
- 7.0Males
- 10.8Females
- 23.4Median age for Two or more races residents
- 10.6Males
- 29.8Females
- 42.4Median age for White alone residents
- 44.1Males
- 42.0Females
- 24.2Median age for Hispanic or Latino residents
- 17.2Males
- 23.2Females
Owner/renter occupied households by race in Blaine
- House owners and renters - White residents
- 1,24966.7%Owner occupied
- 62433.3%Renter occupied
- House owners and renters - Black or African American residents
- 224100.0%Owner occupied
- House owners and renters - American Indian / Alaska Native residents
- 20100.0%Owner occupied
- House owners and renters - Asian residents
- 17282.6%Owner occupied
- 3617.4%Renter occupied
- House owners and renters - Native Hawaiian / Pacific Islander residents
- 20100.0%Owner occupied
- House owners and renters - Other race residents
- 6100.0%Renter occupied
- House owners and renters - Two or more races residents
- 6129.6%Owner occupied
- 14570.4%Renter occupied
- House owners and renters - White alone residents
- 1,21666.5%Owner occupied
- 61333.5%Renter occupied
- House owners and renters - Hispanic or Latino residents
- 10861.8%Owner occupied
- 6738.2%Renter occupied
Language usage in Blaine
- English speakers - Total
- 86.4% of residents of Blaine speak English at home.
- 7.0% of residents speak Spanish at home
- 18045.6%Speak English very well
- 21554.4%Speak English less than very well
- 6.8% of residents speak other language at home
- 27169.8%Speak English very well
- 11730.2%Speak English less than very well
- English speakers - Born in the United States
- 90.7% of residents of Blaine speak English at home.
- 7.6% of residents speak Spanish at home
- 10057.5%Speak English very well
- 7442.5%Speak English less than very well
- 2.6% of residents speak other language at home
- 59100.0%Speak English very well
- English speakers - Native, born elsewhere
- 84.3% of residents of Blaine speak English at home.
- 7.8% of residents speak Spanish at home
- 21100.0%Speak English very well
- English speakers - Foreign-born
- 47.2% of residents of Blaine speak English at home.
- 18.0% of residents speak Spanish at home
- 3317.0%Speak English very well
- 16183.0%Speak English less than very well
- 30.4% of residents speak other language at home
- 22067.1%Speak English very well
- 10832.9%Speak English less than very well
White (Caucasian) - Speak only English
| Native: | 96.4% (3,559) |
| Foreign-born: | 75.8% (345) |
White (Caucasian) - Speak another language
| Native: | 3.6% (132) |
| Foreign-born: | 20.2% (92) |
Asian - Speak only English
| Native: | 88.9% (27) |
| Foreign-born: | 35.4% (108) |
Native Hawaiian / Pacific Islander - Speak only English
| Native: | 90.8% (32) |
| Foreign-born: | 100.0% (13) |
Other race - Speak another language
| Native: | 30.3% (22) |
| Foreign-born: | 100.0% (14) |
Two or more races - Speak only English
| Native: | 73.0% (491) |
| Foreign-born: | 33.4% (101) |
Two or more races - Speak another language
| Native: | 28.2% (190) |
| Foreign-born: | 68.1% (206) |
White alone - Speak only English
| Native: | 96.7% (3,365) |
| Foreign-born: | 82.8% (344) |
White alone - Speak another language
| Native: | 3.0% (106) |
| Foreign-born: | 12.9% (54) |
Hispanic or Latino - Speak another language
| Native: | 19.5% (124) |
| Foreign-born: | 100.0% (250) |
Foreign-born residents in Blaine
1,039 residents are foreign born (7.3% North America, 4.6% Asia, 3.2% Latin America).
| This city: | 17.4% |
| Washington: | 14.9% |


Marital status for residents in Blaine
Marital status - White (Caucasian) population 15 years and over
- Males
- 35.2%Never married
- 41.7%Now married
- 3.8%Separated
- 1.8%Widowed
- 17.5%Divorced
- Females
- 24.3%Never married
- 47.4%Now married
- 4.0%Separated
- 12.5%Widowed
- 11.7%Divorced
Women who gave birth in the past 12 months
| Now married: | 100.0% (38) |
| Unmarried: | 0.0% (0) |
Women who did not give birth in the past 12 months
| Now married: | 45.9% (370) |
| Unmarried: | 54.1% (436) |
Marital status - Black or African American population 15 years and over
- Males
- 25.7%Never married
- 74.3%Now married
- 0.0%Separated
- 0.0%Widowed
- 0.0%Divorced
- Females
- 94.9%Never married
- 5.1%Now married
- 0.0%Separated
- 0.0%Widowed
- 0.0%Divorced
Women who did not give birth in the past 12 months
| Now married: | 0.0% (0) |
| Unmarried: | 100.0% (112) |
Marital status - Asian population 15 years and over
- Males
- 27.5%Never married
- 60.0%Now married
- 12.5%Separated
- 0.0%Widowed
- 0.0%Divorced
- Females
- 0.0%Never married
- 76.9%Now married
- 0.0%Separated
- 23.1%Widowed
- 0.0%Divorced
Women who gave birth in the past 12 months
| Now married: | 100.0% (25) |
| Unmarried: | 0.0% (0) |
Women who did not give birth in the past 12 months
| Now married: | 55.0% (47) |
| Unmarried: | 45.0% (39) |
Marital status - Native Hawaiian / Pacific Islander population 15 years and over
- Males
- 0.0%Never married
- 100.0%Now married
- 0.0%Separated
- 0.0%Widowed
- 0.0%Divorced
- Females
- 0.0%Never married
- 51.9%Now married
- 0.0%Separated
- 0.0%Widowed
- 48.1%Divorced
Women who did not give birth in the past 12 months
| Now married: | 100.0% (4) |
| Unmarried: | 0.0% (0) |
Marital status - Other race population 15 years and over
- Males
- 11.1%Never married
- 88.9%Now married
- 0.0%Separated
- 0.0%Widowed
- 0.0%Divorced
- Females
- 0.0%Never married
- 100.0%Now married
- 0.0%Separated
- 0.0%Widowed
- 0.0%Divorced
Marital status - Two or more races population 15 years and over
- Males
- 60.0%Never married
- 31.7%Now married
- 0.0%Separated
- 0.0%Widowed
- 8.3%Divorced
- Females
- 36.4%Never married
- 22.8%Now married
- 17.9%Separated
- 5.4%Widowed
- 17.6%Divorced
Women who did not give birth in the past 12 months
| Now married: | 19.3% (70) |
| Unmarried: | 80.7% (292) |
Marital status - White alone, not Hispanic / Latino population 15 years and over
- Males
- 33.9%Never married
- 42.9%Now married
- 4.0%Separated
- 1.9%Widowed
- 17.4%Divorced
- Females
- 24.0%Never married
- 46.8%Now married
- 4.2%Separated
- 12.9%Widowed
- 12.1%Divorced
Women who gave birth in the past 12 months
| Now married: | 100.0% (38) |
| Unmarried: | 0.0% (0) |
Women who did not give birth in the past 12 months
| Now married: | 46.9% (371) |
| Unmarried: | 53.1% (420) |
Marital status - Hispanic or Latino population 15 years and over
- Males
- 64.5%Never married
- 25.3%Now married
- 0.0%Separated
- 0.0%Widowed
- 10.2%Divorced
- Females
- 28.6%Never married
- 24.7%Now married
- 18.4%Separated
- 13.8%Widowed
- 14.5%Divorced
Women who did not give birth in the past 12 months
| Now married: | 17.7% (50) |
| Unmarried: | 82.3% (234) |
Ancestries in Blaine

- 29011.3%Irish
- 27310.7%English
- 25610.0%American
- 2228.7%Canadian
- 2037.9%German
- 1395.4%Norwegian
- 1335.2%Dutch
- 652.5%Serbian
- 642.5%British
- 632.5%Italian
- 622.4%Scottish
- 582.3%European
- 461.8%Hungarian
- 281.1%Icelander
- 271.1%Russian
- 271.1%Ukrainian
- 220.9%Brazilian
- 170.7%Egyptian
- 150.6%Lithuanian
- 130.5%Scandinavian
- 100.4%Austrian
- 80.3%Welsh
- 70.3%Polish
- 50.2%African
- 40.2%Czechoslovakian

Geographical mobility in Blaine

- Same house 1 year ago
- 3,73187.4%White (Caucasian)
- 4327.3%Black or African American
- 2377.4%American Indian / Alaska Native
- 27375.6%Asian
- 50100.0%Native Hawaiian / Pacific Islander
- 82100.0%Other race
- 78771.7%Two or more races
- 3,44885.5%White alone, not Hispanic / Latino
- 86487.1%Hispanic or Latino

-
- Moved within same county
- 2596.1%White / Caucasian
- 9258.6%Black or African American
- 328.9%Asian
- 11.0%Other race
- 32229.4%Two or more races
- 2786.9%White alone, not Hispanic / Latino
- 818.1%Hispanic or Latino

-
- Moved within same state
- 2084.9%White / Caucasian
- 723.9%American Indian / Alaska Native
- 164.5%Asian
- 2165.4%White alone, not Hispanic / Latino
- 50.5%Hispanic or Latino

-
- Moved from different state
- 300.7%White / Caucasian
- 256.9%Asian
- 310.8%White alone, not Hispanic / Latino

-
- Moved from abroad
- 531.2%White
- 431.1%White alone, not Hispanic / Latino

Children Nativity (place of birth) in Blaine
Place of birth for residents in Blaine
![Place of birth for the foreign-born population - Regions]()
- 640Americas
- 446Northern America
- 281Asia
- 193Latin America
- 179Eastern Asia
- 179China
- 146Central America
- 89South Eastern Asia
- 69Europe
- 69Eastern Europe
- 46South America
- 34Africa
- 21Eastern Africa
- 13Oceania
- 12South Central Asia
- 12Northern Africa

![Place of birth for the foreign-born population - Countries]()
- 446Canada
- 157China
- 83El Salvador
- 73Philippines
- 63Mexico
- 32Peru
- 30Serbia
- 28Ukraine
- 21Ethiopia
- 14Cambodia
- 14Brazil
- 13Fiji
- 12India
- 12Egypt
- 11Bosnia and Herzegovina
- 11Hong Kong
- 10Taiwan
- 1Vietnam

Grandparents responsible for own grandchildren in Blaine
Zip codes: 98230.