Races in Bloomfield, Connecticut (CT) Detailed Stats
Ancestries, Foreign-born residents, place of birth

Discuss Bloomfield, Connecticut races on our local forum with over 2,400,000 registered users
Latest news about races in Bloomfield, CT collected exclusively by city-data.com from local newspapers, TV, and radio stations
17.9% of Bloomfield, CT residents are foreign-born (14.2% born in Latin America), which is 16.4% greater than the foreign-born rate of 15.0% across the entire state of Connecticut.
Race distribution in Bloomfield

- 10,44553.3%Black alone
- 7,59938.8%White alone
- 7183.7%Hispanic
- 4962.5%Two or more races
- 2501.3%Asian alone
- 430.2%Other race alone
- 330.2%American Indian alone
- 30.02%Native Hawaiian and Other
Pacific Islander alone

2000
2022
-
- 2,638,84577.5%White alone
- 320,3239.4%Hispanic
- 295,5718.7%Black alone
- 81,5642.4%Asian alone
- 52,8961.6%Two or more races
- 8,1410.2%Other race alone
- 7,2670.2%American Indian alone
- 9580.03%Native Hawaiian and Other
Pacific Islander alone

-
- 2,246,91362.0%White alone
- 658,97818.2%Hispanic
- 353,9739.8%Black alone
- 172,9294.8%Asian alone
- 159,6314.4%Two or more races
- 29,7610.8%Other race alone
- 3,4280.09%American Indian alone
- 5920.02%Native Hawaiian and Other
Pacific Islander alone

Income and house value in Bloomfield
- Median household income in 2022
- $89,594White non-Hispanic householders
- $95,710Black householders
- $21,162American Indian and Alaska Native householders
- $36,706Asian householders
- $113,016Some other race householders
- $80,090Two or more races householders
- $85,267Hispanic or Latino race householders
- Median 2022 house value
- $310,231White Non-Hispanic householders
- $272,614Black or African American householders
- $162,141American Indian or Alaska Native householders
- $305,475Asian householders
- $259,210Some other race householders
- $290,774Two or more races householders
- $299,638Hispanic or Latino householders
Household income for White non-Hispanic householders

Household income for Black householders

Household income for American Indian and Alaska Native householders

Household income for Asian householders

Household income for Two or more races householders

Household income for Hispanic or Latino race householders

Foreign-born residents in Bloomfield
3,513 residents are foreign born (14.2% Latin America).
| This city: | 17.9% |
| Connecticut: | 10.9% |
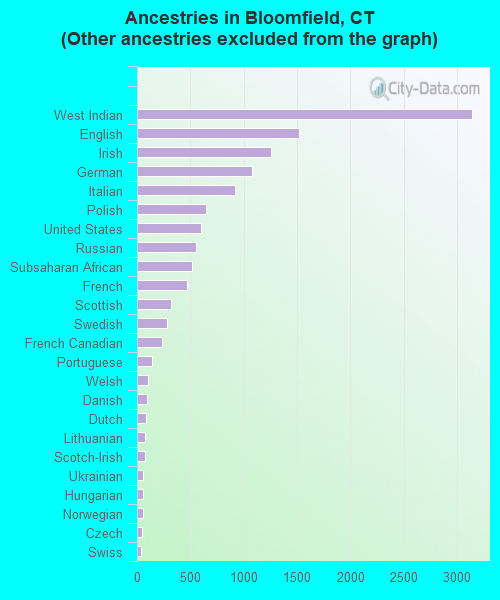
Ancestries in Bloomfield

- 7,63738.1%Other
- 3,14315.7%West Indian
- 1,5157.6%English
- 1,2526.2%Irish
- 1,0825.4%German
- 9234.6%Italian
- 6493.2%Polish
- 6043.0%United States
- 5492.7%Russian
- 5132.6%Subsaharan African
- 4662.3%French
- 3151.6%Scottish
- 2821.4%Swedish
- 2301.1%French Canadian
- 1370.7%Portuguese
- 990.5%Welsh
- 960.5%Danish
- 840.4%Dutch
- 770.4%Lithuanian
- 770.4%Scotch-Irish
- 600.3%Ukrainian
- 580.3%Hungarian
- 580.3%Norwegian
- 480.2%Czech
- 380.2%Swiss
- 220.1%Greek
- 160.08%Arab
- 40.02%Slovak
Zip codes: 06002.