Races in Bloomfield, New Jersey (NJ) Detailed Stats
Ancestries, Foreign-born residents, place of birth

Recent posts about races in Bloomfield, New Jersey on our local forum with over 2,400,000 registered users:
 | Contractor suggestions for a house in Bloomfield (2 replies) |
| Lead in the Water: Bloomfield (1 reply) |
| Bloomfield, NJ in 2020 (9 replies) |
| Bloomfield, NJ - what's it like in 2019? (7 replies) |
| Looking to buy and invest in Bloomfield NJ? (32 replies) |
| Essex County Advice Needed (48 replies) |
22.8% of Bloomfield, NJ residents are foreign-born (9.1% born in Latin America, 6.7% born in Asia, 5.9% born in Europe), which is about the same as the foreign-born rate of 23.0% across the entire state of New Jersey.
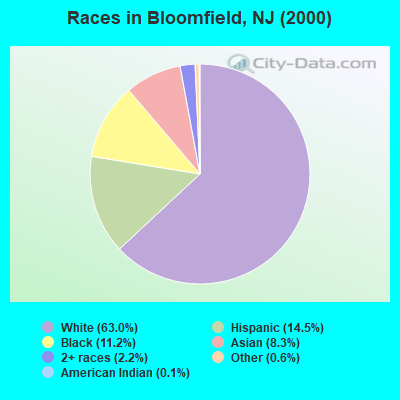
Race distribution in Bloomfield

- 30,03663.0%White alone
- 6,90114.5%Hispanic
- 5,33211.2%Black alone
- 3,9808.3%Asian alone
- 1,0572.2%Two or more races
- 2960.6%Other race alone
- 510.1%American Indian alone
- 300.06%Native Hawaiian and Other
Pacific Islander alone
2000
2022
-
- 5,557,20966.0%White alone
- 1,117,19113.3%Hispanic
- 1,096,17113.0%Black alone
- 477,0125.7%Asian alone
- 133,6891.6%Two or more races
- 19,5650.2%Other race alone
- 11,3380.1%American Indian alone
- 2,1750.03%Native Hawaiian and Other
Pacific Islander alone

-
- 4,766,47651.5%White alone
- 2,028,47021.9%Hispanic
- 1,111,63212.0%Black alone
- 923,54610.0%Asian alone
- 332,2373.6%Two or more races
- 89,8471.0%Other race alone
- 8,5570.09%American Indian alone
- 9340.01%Native Hawaiian and Other
Pacific Islander alone

Income and house value in Bloomfield
- Median household income in 2022
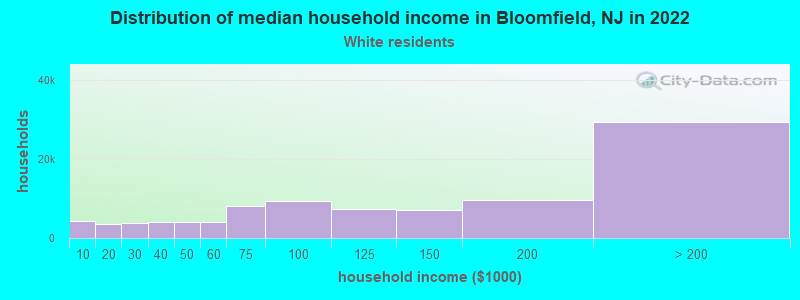
- $97,534White non-Hispanic householders
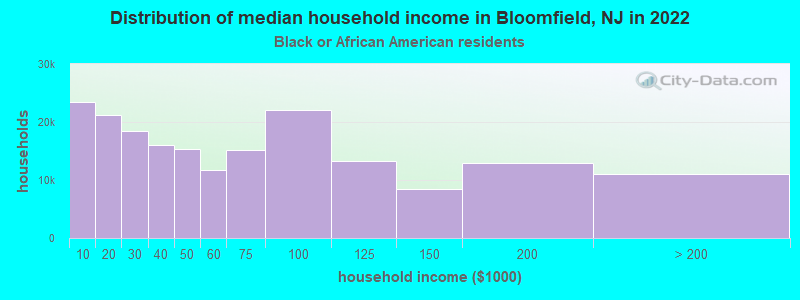
- $79,423Black householders
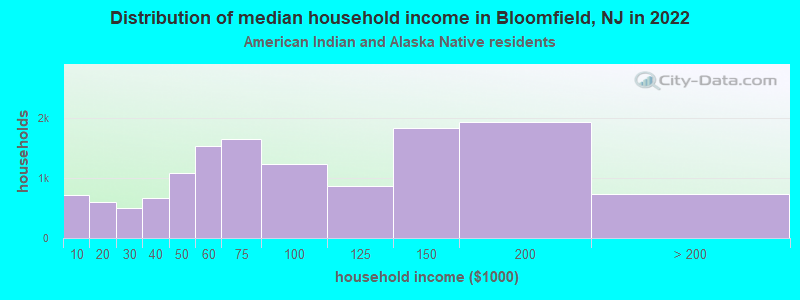
- $71,760American Indian and Alaska Native householders
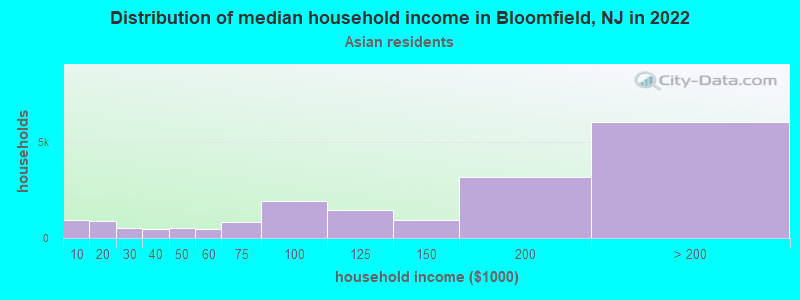
- $150,331Asian householders
- $78,860Some other race householders
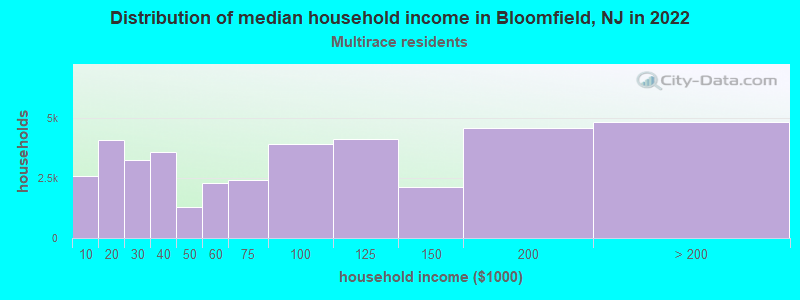
- $91,629Two or more races householders
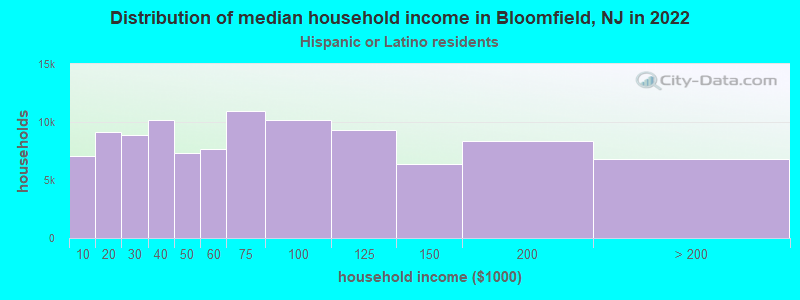
- $96,124Hispanic or Latino race householders
- Median 2022 house value
- $435,091White Non-Hispanic householders
- $395,489Black or African American householders
- $426,174American Indian or Alaska Native householders
- $452,662Asian householders
- $415,421Some other race householders
- $383,950Two or more races householders
- $416,995Hispanic or Latino householders
Household income for White non-Hispanic householders
Household income for Black householders
Household income for American Indian and Alaska Native householders
Household income for Asian householders
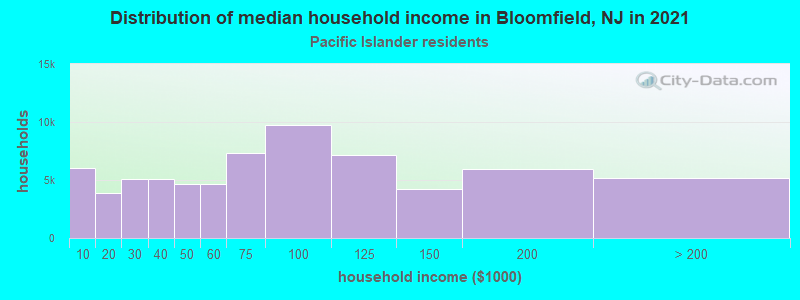
Household income for Native Hawaiian and other Pacific Islander householders
Household income for Two or more races householders
Household income for Hispanic or Latino race householders
Foreign-born residents in Bloomfield
10,892 residents are foreign born (9.1% Latin America, 6.7% Asia, 5.9% Europe).
| This city: | 22.8% |
| New Jersey: | 17.5% |
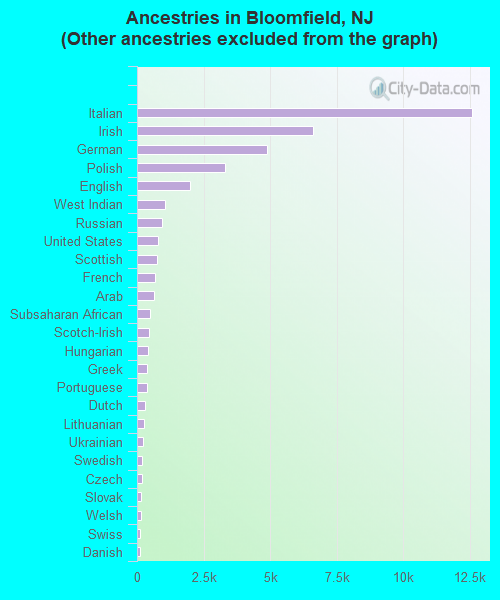
Ancestries in Bloomfield

- 16,25129.8%Other
- 12,59023.1%Italian
- 6,61612.1%Irish
- 4,8658.9%German
- 3,3156.1%Polish
- 1,9823.6%English
- 1,0692.0%West Indian
- 9391.7%Russian
- 7901.4%United States
- 7451.4%Scottish
- 6631.2%French
- 6201.1%Arab
- 4960.9%Subsaharan African
- 4670.9%Scotch-Irish
- 4010.7%Hungarian
- 3800.7%Greek
- 3680.7%Portuguese
- 3060.6%Dutch
- 2800.5%Lithuanian
- 2250.4%Ukrainian
- 1980.4%Swedish
- 1840.3%Czech
- 1660.3%Slovak
- 1600.3%Welsh
- 1230.2%Swiss
- 1200.2%Danish
- 1120.2%French Canadian
- 770.1%Norwegian
Zip codes: 07003.