Races in Bloomfield, New Mexico (NM) Detailed Stats
Data:
Races - White alone (%)
Races - White alone (% change since 2000)
Races - Black alone (%)
Races - Black alone (% change since 2000)
Races - American Indian alone (%)
Races - American Indian alone (% change since 2000)
Races - Asian alone (%)
Races - Asian alone (% change since 2000)
Races - Hispanic (%)
Races - Hispanic (% change since 2000)
Races - Native Hawaiian and Other Pacific Islander alone (%)
Races - Native Hawaiian and Other Pacific Islander alone (% change since 2000)
Races - Two or more races(%)
Races - Two or more races(% change since 2000)
Races - Other race alone (%)
Races - Other race alone (% change since 2000)
Racial diversity
Place of birth - Born in state of residence (%)
Place of birth - Born in state of residence (%) - White
Place of birth - Born in state of residence (%) - Black or African American
Place of birth - Born in state of residence (%) - Asian
Place of birth - Born in state of residence (%) - Hispanic or Latino
Place of birth - Born in state of residence (%) - American Indian and Alaska Native
Place of birth - Born in state of residence (%) - Multirace
Place of birth - Born in state of residence (%) - Other Race
Place of birth - Born in other state (%)
Place of birth - Born in other state (%) - White
Place of birth - Born in other state (%) - Black or African American
Place of birth - Born in other state (%) - Asian
Place of birth - Born in other state (%) - Hispanic or Latino
Place of birth - Born in other state (%) - American Indian and Alaska Native
Place of birth - Born in other state (%) - Multirace
Place of birth - Born in other state (%) - Other Race
Place of birth - Native, outside of US (%)
Place of birth - Native, outside of US (%) - White
Place of birth - Native, outside of US (%) - Black or African American
Place of birth - Native, outside of US (%) - Asian
Place of birth - Native, outside of US (%) - Hispanic or Latino
Place of birth - Native, outside of US (%) - American Indian and Alaska Native
Place of birth - Native, outside of US (%) - Multirace
Place of birth - Native, outside of US (%) - Other Race
Place of birth - Foreign born (%)
Place of birth - Foreign born (%) - White
Place of birth - Foreign born (%) - Black or African American
Place of birth - Foreign born (%) - Asian
Place of birth - Foreign born (%) - Hispanic or Latino
Place of birth - Foreign born (%) - American Indian and Alaska Native
Place of birth - Foreign born (%) - Multirace
Place of birth - Foreign born (%) - Other Race
Residents speaking English at home (%)
Residents speaking English at home - Born in the United States (%)
Residents speaking English at home - Native, born elsewhere (%)
Residents speaking English at home - Foreign born (%)
Residents speaking Spanish at home (%)
Residents speaking Spanish at home - Born in the United States (%)
Residents speaking Spanish at home - Native, born elsewhere (%)
Residents speaking Spanish at home - Foreign born (%)
Residents speaking other language at home (%)
Residents speaking other language at home - Born in the United States (%)
Residents speaking other language at home - Native, born elsewhere (%)
Residents speaking other language at home - Foreign born (%)
Marital status - Never married (%)
Marital status - Now married (%)
Marital status - Separated (%)
Marital status - Widowed (%)
Marital status - Divorced (%)
Ancestries Reported - Arab (%)
Ancestries Reported - Czech (%)
Ancestries Reported - Danish (%)
Ancestries Reported - Dutch (%)
Ancestries Reported - English (%)
Ancestries Reported - French (%)
Ancestries Reported - French Canadian (%)
Ancestries Reported - German (%)
Ancestries Reported - Greek (%)
Ancestries Reported - Hungarian (%)
Ancestries Reported - Irish (%)
Ancestries Reported - Italian (%)
Ancestries Reported - Lithuanian (%)
Ancestries Reported - Norwegian (%)
Ancestries Reported - Polish (%)
Ancestries Reported - Portuguese (%)
Ancestries Reported - Russian (%)
Ancestries Reported - Scotch-Irish (%)
Ancestries Reported - Scottish (%)
Ancestries Reported - Slovak (%)
Ancestries Reported - Subsaharan African (%)
Ancestries Reported - Swedish (%)
Ancestries Reported - Swiss (%)
Ancestries Reported - Ukrainian (%)
Ancestries Reported - United States (%)
Ancestries Reported - Welsh (%)
Ancestries Reported - West Indian (%)
Ancestries Reported - Other (%)
Geographical mobility - Same house 1 year ago (%)
Geographical mobility - Same house 1 year ago (%) - White
Geographical mobility - Same house 1 year ago (%) - Black or African American
Geographical mobility - Same house 1 year ago (%) - Asian
Geographical mobility - Same house 1 year ago (%) - Hispanic or Latino
Geographical mobility - Same house 1 year ago (%) - American Indian and Alaska Native
Geographical mobility - Same house 1 year ago (%) - Multirace
Geographical mobility - Same house 1 year ago (%) - Other Race
Geographical mobility - Moved within same county (%)
Geographical mobility - Moved within same county (%) - White
Geographical mobility - Moved within same county (%) - Black or African American
Geographical mobility - Moved within same county (%) - Asian
Geographical mobility - Moved within same county (%) - Hispanic or Latino
Geographical mobility - Moved within same county (%) - American Indian and Alaska Native
Geographical mobility - Moved within same county (%) - Multirace
Geographical mobility - Moved within same county (%) - Other Race
Geographical mobility - Moved from different county within same state (%)
Geographical mobility - Moved from different county within same state (%) - White
Geographical mobility - Moved from different county within same state (%) - Black or African American
Geographical mobility - Moved from different county within same state (%) - Asian
Geographical mobility - Moved from different county within same state (%) - Hispanic or Latino
Geographical mobility - Moved from different county within same state (%) - American Indian and Alaska Native
Geographical mobility - Moved from different county within same state (%) - Multirace
Geographical mobility - Moved from different county within same state (%) - Other Race
Geographical mobility - Moved from different state (%)
Geographical mobility - Moved from different state (%) - White
Geographical mobility - Moved from different state (%) - Black or African American
Geographical mobility - Moved from different state (%) - Asian
Geographical mobility - Moved from different state (%) - Hispanic or Latino
Geographical mobility - Moved from different state (%) - American Indian and Alaska Native
Geographical mobility - Moved from different state (%) - Multirace
Geographical mobility - Moved from different state (%) - Other Race
Geographical mobility - Moved from abroad (%)
Geographical mobility - Moved from abroad (%) - White
Geographical mobility - Moved from abroad (%) - Black or African American
Geographical mobility - Moved from abroad (%) - Asian
Geographical mobility - Moved from abroad (%) - Hispanic or Latino
Geographical mobility - Moved from abroad (%) - American Indian and Alaska Native
Geographical mobility - Moved from abroad (%) - Multirace
Geographical mobility - Moved from abroad (%) - Other Race
Place of birth for the foreign-born population - Ireland (%)
Place of birth for the foreign-born population - Denmark (%)
Place of birth for the foreign-born population - Norway (%)
Place of birth for the foreign-born population - Sweden (%)
Place of birth for the foreign-born population - United Kingdom (%)
Place of birth for the foreign-born population - England (%)
Place of birth for the foreign-born population - Scotland (%)
Place of birth for the foreign-born population - Other Northern Europe (%)
Place of birth for the foreign-born population - Austria (%)
Place of birth for the foreign-born population - Belgium (%)
Place of birth for the foreign-born population - France (%)
Place of birth for the foreign-born population - Germany (%)
Place of birth for the foreign-born population - Netherlands (%)
Place of birth for the foreign-born population - Switzerland (%)
Place of birth for the foreign-born population - Other Western Europe (%)
Place of birth for the foreign-born population - Greece (%)
Place of birth for the foreign-born population - Italy (%)
Place of birth for the foreign-born population - Portugal (%)
Place of birth for the foreign-born population - Spain (%)
Place of birth for the foreign-born population - Other Southern Europe (%)
Place of birth for the foreign-born population - Albania (%)
Place of birth for the foreign-born population - Belarus (%)
Place of birth for the foreign-born population - Bosnia and Herzegovina (%)
Place of birth for the foreign-born population - Bulgaria (%)
Place of birth for the foreign-born population - Croatia (%)
Place of birth for the foreign-born population - Czechoslovakia (%)
Place of birth for the foreign-born population - Hungary (%)
Place of birth for the foreign-born population - Latvia (%)
Place of birth for the foreign-born population - Lithuania (%)
Place of birth for the foreign-born population - North Macedonia (Macedonia) (%)
Place of birth for the foreign-born population - Moldova (%)
Place of birth for the foreign-born population - Poland (%)
Place of birth for the foreign-born population - Romania (%)
Place of birth for the foreign-born population - Russia (%)
Place of birth for the foreign-born population - Serbia (%)
Place of birth for the foreign-born population - Ukraine (%)
Place of birth for the foreign-born population - Other Eastern Europe (%)
Place of birth for the foreign-born population - China (%)
Place of birth for the foreign-born population - Hong Kong (%)
Place of birth for the foreign-born population - Taiwan (%)
Place of birth for the foreign-born population - Japan (%)
Place of birth for the foreign-born population - Korea (%)
Place of birth for the foreign-born population - Other Eastern Asia (%)
Place of birth for the foreign-born population - Afghanistan (%)
Place of birth for the foreign-born population - Bangladesh (%)
Place of birth for the foreign-born population - India (%)
Place of birth for the foreign-born population - Iran (%)
Place of birth for the foreign-born population - Kazakhstan (%)
Place of birth for the foreign-born population - Nepal (%)
Place of birth for the foreign-born population - Pakistan (%)
Place of birth for the foreign-born population - Sri Lanka (%)
Place of birth for the foreign-born population - Uzbekistan (%)
Place of birth for the foreign-born population - Other South Central Asia (%)
Place of birth for the foreign-born population - Burma (%)
Place of birth for the foreign-born population - Cambodia (%)
Place of birth for the foreign-born population - Indonesia (%)
Place of birth for the foreign-born population - Laos (%)
Place of birth for the foreign-born population - Malaysia (%)
Place of birth for the foreign-born population - Philippines (%)
Place of birth for the foreign-born population - Singapore (%)
Place of birth for the foreign-born population - Thailand (%)
Place of birth for the foreign-born population - Vietnam (%)
Place of birth for the foreign-born population - Other South Eastern Asia (%)
Place of birth for the foreign-born population - Armenia (%)
Place of birth for the foreign-born population - Iraq (%)
Place of birth for the foreign-born population - Israel (%)
Place of birth for the foreign-born population - Jordan (%)
Place of birth for the foreign-born population - Kuwait (%)
Place of birth for the foreign-born population - Lebanon (%)
Place of birth for the foreign-born population - Saudi Arabia (%)
Place of birth for the foreign-born population - Syria (%)
Place of birth for the foreign-born population - Turkey (%)
Place of birth for the foreign-born population - Yemen (%)
Place of birth for the foreign-born population - Other Western Asia (%)
Place of birth for the foreign-born population - Eritrea (%)
Place of birth for the foreign-born population - Ethiopia (%)
Place of birth for the foreign-born population - Kenya (%)
Place of birth for the foreign-born population - Somalia (%)
Place of birth for the foreign-born population - Uganda (%)
Place of birth for the foreign-born population - Zimbabwe (%)
Place of birth for the foreign-born population - Other Eastern Africa (%)
Place of birth for the foreign-born population - Cameroon (%)
Place of birth for the foreign-born population - Congo (%)
Place of birth for the foreign-born population - Democratic Republic of Congo (Zaire) (%)
Place of birth for the foreign-born population - Other Middle Africa (%)
Place of birth for the foreign-born population - Egypt (%)
Place of birth for the foreign-born population - Morocco (%)
Place of birth for the foreign-born population - Sudan (%)
Place of birth for the foreign-born population - Other Northern Africa (%)
Place of birth for the foreign-born population - South Africa (%)
Place of birth for the foreign-born population - Other Southern Africa (%)
Place of birth for the foreign-born population - Cabo Verde (%)
Place of birth for the foreign-born population - Ghana (%)
Place of birth for the foreign-born population - Liberia (%)
Place of birth for the foreign-born population - Nigeria (%)
Place of birth for the foreign-born population - Senegal (%)
Place of birth for the foreign-born population - Sierra Leone (%)
Place of birth for the foreign-born population - Other Western Africa (%)
Place of birth for the foreign-born population - Australia (%)
Place of birth for the foreign-born population - New Zealand (%)
Place of birth for the foreign-born population - Fiji (%)
Place of birth for the foreign-born population - Micronesia (%)
Place of birth for the foreign-born population - Bahamas (%)
Place of birth for the foreign-born population - Barbados (%)
Place of birth for the foreign-born population - Cuba (%)
Place of birth for the foreign-born population - Dominica (%)
Place of birth for the foreign-born population - Dominican Republic (%)
Place of birth for the foreign-born population - Grenada (%)
Place of birth for the foreign-born population - Haiti (%)
Place of birth for the foreign-born population - Jamaica (%)
Place of birth for the foreign-born population - St. Vincent and the Grenadines (%)
Place of birth for the foreign-born population - Trinidad and Tobago (%)
Place of birth for the foreign-born population - West Indies (%)
Place of birth for the foreign-born population - Other Caribbean (%)
Place of birth for the foreign-born population - Belize (%)
Place of birth for the foreign-born population - Costa Rica (%)
Place of birth for the foreign-born population - El Salvador (%)
Place of birth for the foreign-born population - Guatemala (%)
Place of birth for the foreign-born population - Honduras (%)
Place of birth for the foreign-born population - Mexico (%)
Place of birth for the foreign-born population - Nicaragua (%)
Place of birth for the foreign-born population - Panama (%)
Place of birth for the foreign-born population - Other Central America (%)
Place of birth for the foreign-born population - Argentina (%)
Place of birth for the foreign-born population - Bolivia (%)
Place of birth for the foreign-born population - Brazil (%)
Place of birth for the foreign-born population - Chile (%)
Place of birth for the foreign-born population - Colombia (%)
Place of birth for the foreign-born population - Ecuador (%)
Place of birth for the foreign-born population - Guyana (%)
Place of birth for the foreign-born population - Peru (%)
Place of birth for the foreign-born population - Uruguay (%)
Place of birth for the foreign-born population - Venezuela (%)
Place of birth for the foreign-born population - Other South America (%)
Place of birth for the foreign-born population - Canada (%)
Place of birth for the foreign-born population - Other Northern America (%)
Place of birth for the foreign-born population - Other (%)
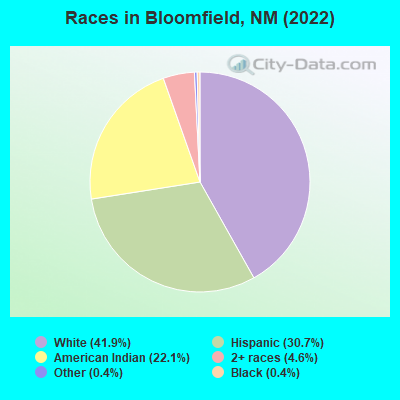
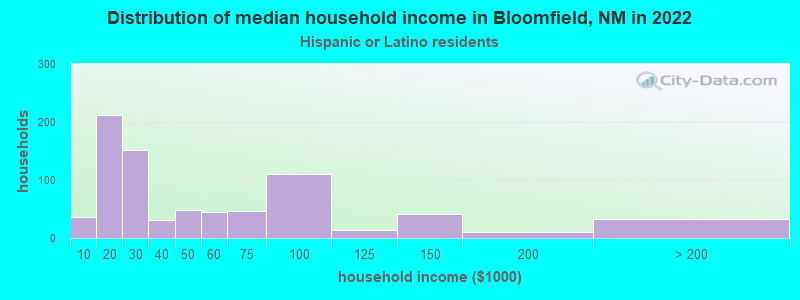
According to 2022 data, the most numerous races in Bloomfield, NM are Hispanic (2,256 residents), White alone (3,080 residents), and American Indian alone (1,626 residents). 77.6% of Bloomfield residents speak English at home. 2.0% of Bloomfield, NM residents are foreign-born (1.9% born in Latin America), which is 349.8% less than the foreign-born rate of 9.0% across the entire state of New Mexico.
Race distribution in Bloomfield
2000 2022
813,495 44.7% White alone 765,386 42.1% Hispanic 161,460 8.9% American Indian alone 30,654 1.7% Black alone 25,793 1.4% Two or more races 18,257 1.0% Asian alone 3,009 0.2% Other race alone 992 0.05% Native Hawaiian and Other
1,059,867 50.2% Hispanic 735,478 34.8% White alone 171,808 8.1% American Indian alone 65,084 3.1% Two or more races 36,870 1.7% Black alone 35,870 1.7% Asian alone 7,582 0.4% Other race alone 785 0.04% Native Hawaiian and Other
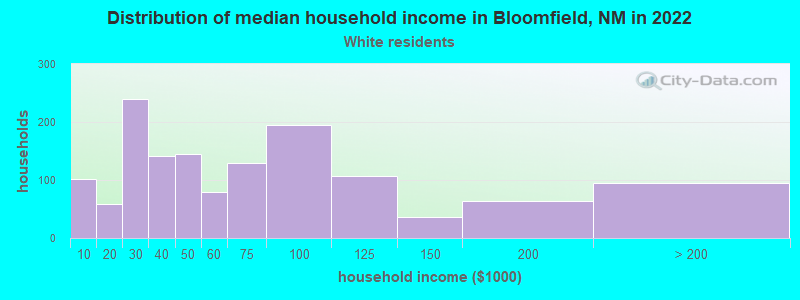
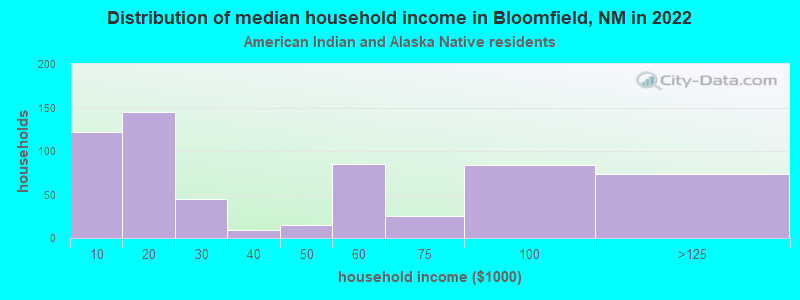
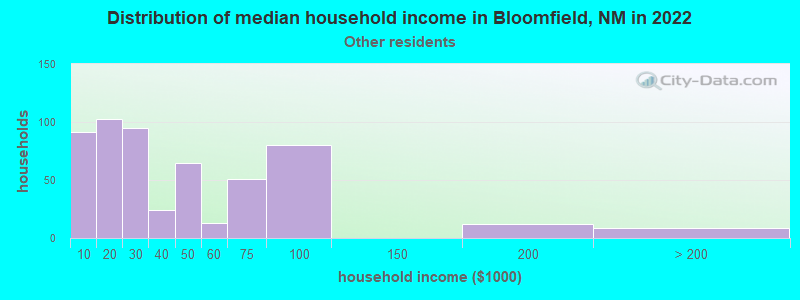
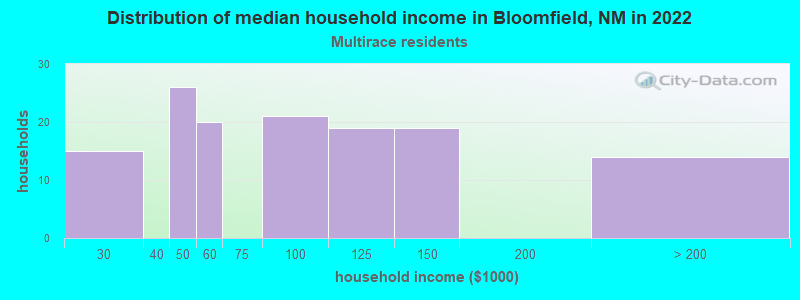
Income and house value in Bloomfield Median household income in 2022 $55,454 White non-Hispanic householders$27,027 Some other race householders$74,882 Two or more races householders$39,337 Hispanic or Latino race householdersMedian 2022 house value $214,583 White Non-Hispanic householders$205,400 American Indian or Alaska Native householders$182,444 Some other race householders$178,819 Hispanic or Latino householders
Median age by race in Bloomfield
39.6 Median age for White residents42.6 37.3 65.2 Median age for Black or African American residents-648,594,376.9 62.6 28.7 Median age for American Indian / Alaska Native residents14.1 33.6 -675,675,675.0 Median age for Asian residents-687,619,046.9 -661,512,026.8 -658,511,722.1 Median age for Native Hawaiian / Pacific Islander residents-666,666,666.0 -659,380,691.5 33.8 Median age for Other race residents30.9 38.5 21.7 Median age for Two or more races residents42.7 11.5 49.5 Median age for White alone residents50.9 43.0 30.3 Median age for Hispanic or Latino residents28.7 30.3
Owner/renter occupied households by race in Bloomfield
House owners and renters - White residents 1,070 78.9% Owner occupied286 21.1% Renter occupiedHouse owners and renters - Black or African American residents 6 100.0% Renter occupiedHouse owners and renters - American Indian / Alaska Native residents 211 35.9% Owner occupied376 64.1% Renter occupiedHouse owners and renters - Other race residents 637 95.3% Owner occupied32 4.7% Renter occupiedHouse owners and renters - Two or more races residents 152 100.0% Owner occupiedHouse owners and renters - White alone residents 1,040 81.8% Owner occupied231 18.2% Renter occupiedHouse owners and renters - Hispanic or Latino residents 666 87.0% Owner occupied99 13.0% Renter occupied
Language usage in Bloomfield
English speakers - Total 77.6% of residents of Bloomfield speak English at home.
15.4% of residents speak Spanish at home 225 21.7% Speak English very well811 78.3% Speak English less than very well9.4% of residents speak other language at home 439 69.5% Speak English very well193 30.5% Speak English less than very well
English speakers - Born in the United States 83.3% of residents of Bloomfield speak English at home.
5.3% of residents speak Spanish at home 34 26.4% Speak English very well95 73.6% Speak English less than very well13.5% of residents speak other language at home 199 60.5% Speak English very well130 39.5% Speak English less than very well
English speakers - Foreign-born 0.0% of residents of Bloomfield speak English at home.
95.3% of residents speak Spanish at home 71 43.8% Speak English very well91 56.2% Speak English less than very well
White (Caucasian) - Speak another language Native:
2.5% (78)Foreign-born:
81.7% (11)
Other race - Speak another language Native:
62.8% (979)Foreign-born:
100.0% (142)
Two or more races - Speak another language Native:
3.9% (21)Foreign-born:
100.0% (21)
Hispanic or Latino - Speak another language Native:
34.6% (637)Foreign-born:
100.0% (172)
Foreign-born residents in Bloomfield 147 residents are foreign born (1.9% Latin America ).
This city:
2.0%New Mexico:
9.2%
Marital status for residents in Bloomfield Marital status - White (Caucasian) population 15 years and over
Males 22.8% Never married48.3% Now married2.2% Separated18.0% Widowed8.7% DivorcedFemales 23.3% Never married40.7% Now married0.8% Separated3.5% Widowed31.8% DivorcedWomen who gave birth in the past 12 months Now married:
71.7% (112)Unmarried:
28.3% (44)
Women who did not give birth in the past 12 months Now married:
41.1% (214)Unmarried:
58.9% (306)
Marital status - Black or African American population 15 years and over
Males 0.0% Never married0.0% Now married0.0% Separated0.0% Widowed100.0% DivorcedFemales 0.0% Never married68.2% Now married0.0% Separated31.8% Widowed0.0% DivorcedWomen who did not give birth in the past 12 months Now married:
100.0% (10)Unmarried:
0.0% (0)
Marital status - American Indian / Alaska Native population 15 years and over
Males 49.9% Never married49.0% Now married0.0% Separated0.6% Widowed0.6% DivorcedFemales 48.7% Never married32.6% Now married4.1% Separated11.8% Widowed2.9% DivorcedWomen who gave birth in the past 12 months Now married:
0.0% (0)Unmarried:
100.0% (62)
Women who did not give birth in the past 12 months Now married:
38.4% (215)Unmarried:
61.6% (345)
Marital status - Other race population 15 years and over
Males 26.4% Never married65.9% Now married0.0% Separated0.0% Widowed7.7% DivorcedFemales 27.9% Never married37.7% Now married0.0% Separated10.7% Widowed23.7% DivorcedWomen who gave birth in the past 12 months Now married:
0.0% (0)Unmarried:
100.0% (23)
Women who did not give birth in the past 12 months Now married:
41.9% (57)Unmarried:
58.1% (78)
Marital status - Two or more races population 15 years and over
Males 49.3% Never married35.1% Now married0.0% Separated2.0% Widowed13.5% DivorcedFemales 47.2% Never married52.8% Now married0.0% Separated0.0% Widowed0.0% DivorcedWomen who did not give birth in the past 12 months Now married:
39.1% (41)Unmarried:
60.9% (64)
Marital status - White alone, not Hispanic / Latino population 15 years and over
Males 16.9% Never married54.9% Now married2.0% Separated22.2% Widowed4.0% DivorcedFemales 19.8% Never married42.8% Now married0.9% Separated3.3% Widowed33.3% DivorcedWomen who gave birth in the past 12 months Now married:
80.6% (127)Unmarried:
19.4% (31)
Women who did not give birth in the past 12 months Now married:
40.4% (190)Unmarried:
59.6% (280)
Marital status - Hispanic or Latino population 15 years and over
Males 36.4% Never married43.9% Now married1.3% Separated0.0% Widowed18.4% DivorcedFemales 31.3% Never married42.0% Now married0.0% Separated7.3% Widowed19.4% DivorcedWomen who gave birth in the past 12 months Now married:
0.0% (0)Unmarried:
100.0% (38)
Women who did not give birth in the past 12 months Now married:
55.7% (182)Unmarried:
44.3% (145)
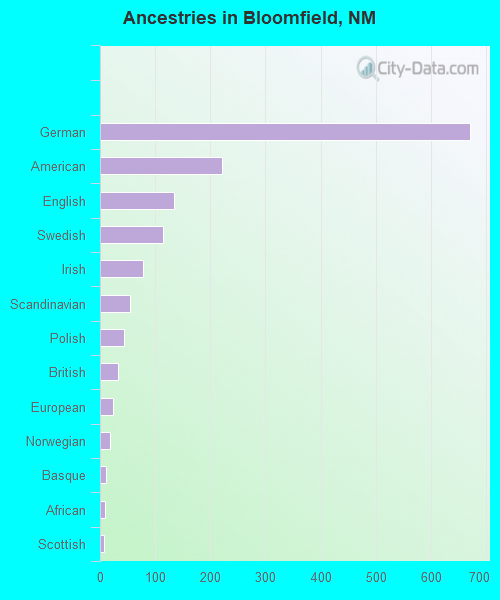
Ancestries in Bloomfield
672 14.1% German221 4.6% American135 2.8% English115 2.4% Swedish78 1.6% Irish54 1.1% Scandinavian44 0.9% Polish32 0.7% British23 0.5% European18 0.4% Norwegian10 0.2% Basque9 0.2% African7 0.1% Scottish6 0.1% Scotch-Irish
Children Nativity (place of birth) in Bloomfield
Children under 6 years - Living with two parents Both parents native 225 100.0% NativeBoth parents foreign-born 35 100.0% NativeChildren under 6 years - Living with one parent Native parent 371 100.0% Native
Children 6 to 17 years - Living with two parents Both parents native 586 100.0% NativeBoth parents foreign-born 178 100.0% NativeOne native, one foreign-born parent 31 100.0% NativeChildren 6 to 17 years - Living with one parent Native parent 410 100.0% Native
Place of birth for residents in Bloomfield 142 Americas142 Latin America142 Central America5 Africa5 Eastern Africa
Grandparents responsible for own grandchildren in Bloomfield
Grandparents (30 to 59 years) White / Caucasian 70 45.6% Responsible for grandchildren83 54.4% Not responsible for grandchildrenAmerican Indian / Alaska Native 10 41.7% Responsible for grandchildren14 58.3% Not responsible for grandchildrenWhite alone, not Hispanic / Latino 58 36.8% Responsible for grandchildren100 63.2% Not responsible for grandchildrenHispanic or Latino 24 100.0% Not responsible for grandchildrenGrandparents (60 years and over) White / Caucasian 5 6.3% Responsible for grandchildren74 93.7% Not responsible for grandchildrenAmerican Indian / Alaska Native 7 100.0% Not responsible for grandchildrenWhite alone, not Hispanic / Latino 6 5.1% Responsible for grandchildren115 94.9% Not responsible for grandchildrenHispanic or Latino 26 100.0% Not responsible for grandchildren