Races in Blooming Grove, New York (NY) Detailed Stats
Ancestries, Foreign-born residents, place of birth

Recent posts about races in Blooming Grove, New York on our local forum with over 2,400,000 registered users:
 | Moving from Brooklyn. Jewish communities upstate? (340 replies) |
| How Bad Is The Kiryas Joel Situation in Monroe? (107 replies) |
| Thinking of moving to Monroe in Orange County (15 replies) |
| Orange County, NY Monroe Area (51 replies) |
| Questions About Westchester (17 replies) |
| Where are the BEST Christmas decorations in NYC & Upstate?? (18 replies) |
6.4% of Blooming Grove, NY residents are foreign-born (3.2% born in Europe, 1.6% born in Asia, 1.2% born in Latin America), which is 243.3% less than the foreign-born rate of 22.0% across the entire state of New York.
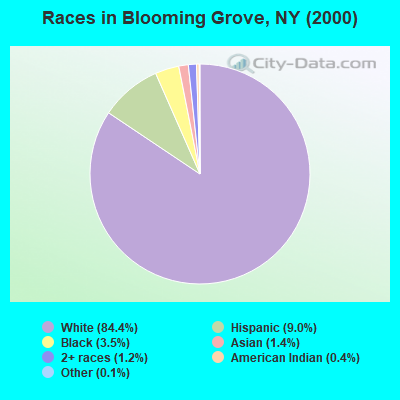
Race distribution in Blooming Grove

- 14,64684.4%White alone
- 1,5569.0%Hispanic
- 5993.5%Black alone
- 2351.4%Asian alone
- 2101.2%Two or more races
- 760.4%American Indian alone
- 260.1%Other race alone
- 30.02%Native Hawaiian and Other
Pacific Islander alone
2000
2022
-
- 11,760,98162.0%White alone
- 2,867,58315.1%Hispanic
- 2,812,62314.8%Black alone
- 1,035,9265.5%Asian alone
- 366,1161.9%Two or more races
- 75,4990.4%Other race alone
- 52,4990.3%American Indian alone
- 5,2300.03%Native Hawaiian and Other
Pacific Islander alone

-
- 10,408,93352.9%White alone
- 3,867,29919.7%Hispanic
- 2,633,84013.4%Black alone
- 1,776,2869.0%Asian alone
- 732,6703.7%Two or more races
- 216,1101.1%Other race alone
- 35,0820.2%American Indian alone
- 6,9310.04%Native Hawaiian and Other
Pacific Islander alone

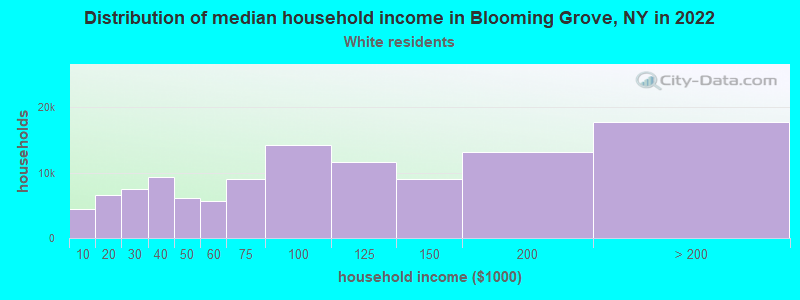
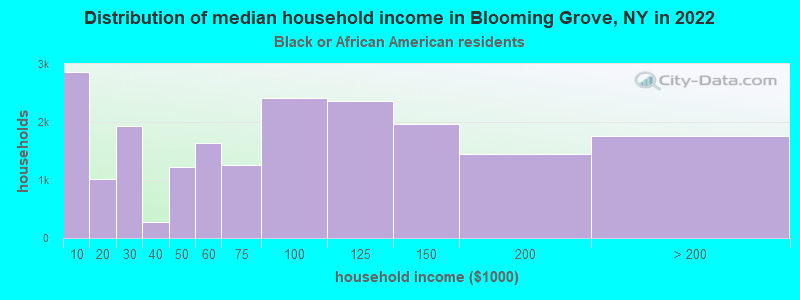
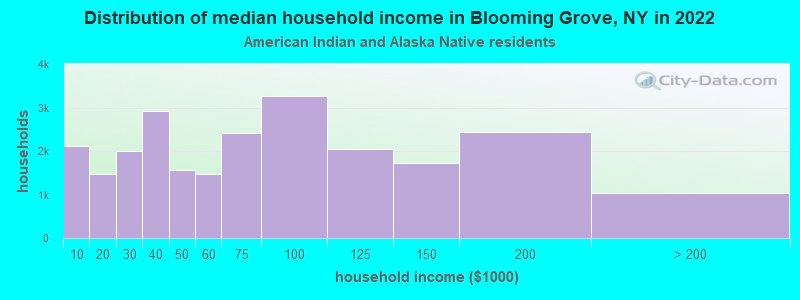
Income and house value in Blooming Grove
- Median household income in 2022
- $110,085White non-Hispanic householders
- $88,142Black householders
- $99,100American Indian and Alaska Native householders
- $105,365Asian householders
- $147,267Some other race householders
- $125,623Two or more races householders
- $136,303Hispanic or Latino race householders
- Median 2022 house value
- $430,950White Non-Hispanic householders
- $361,095Black or African American householders
- $452,222Asian householders
- $512,098Some other race householders
- $398,649Two or more races householders
- $439,092Hispanic or Latino householders
Household income for White non-Hispanic householders
Household income for Black householders
Household income for American Indian and Alaska Native householders
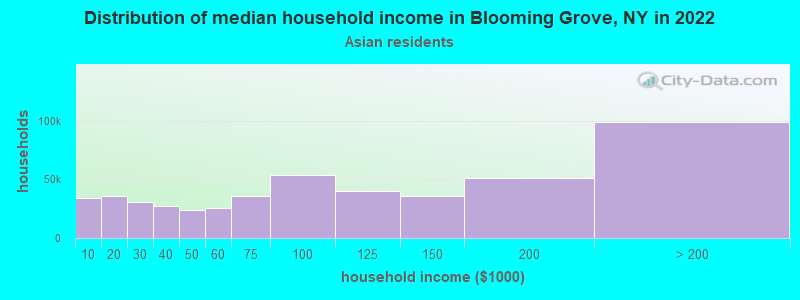
Household income for Asian householders
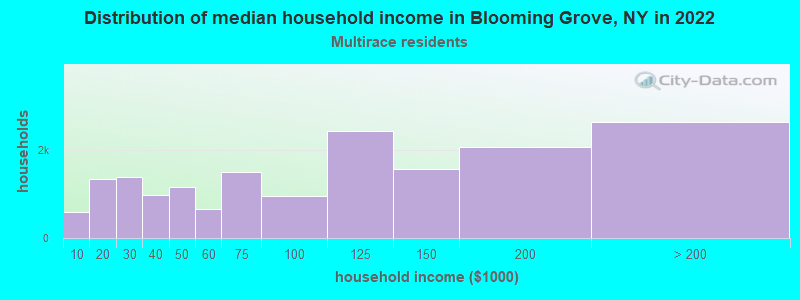
Household income for Two or more races householders
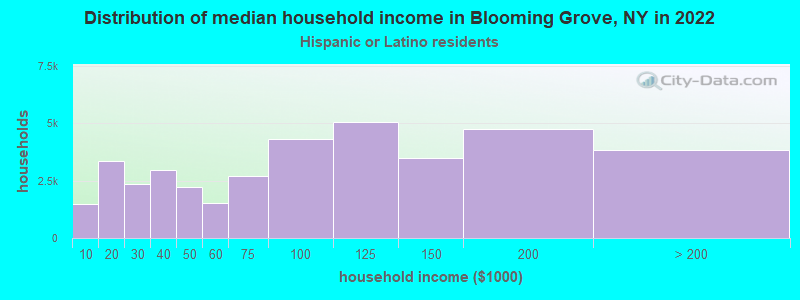
Household income for Hispanic or Latino race householders
Foreign-born residents in Blooming Grove
1,112 residents are foreign born (3.2% Europe, 1.6% Asia, 1.2% Latin America).
| This city: | 6.4% |
| New York: | 20.4% |
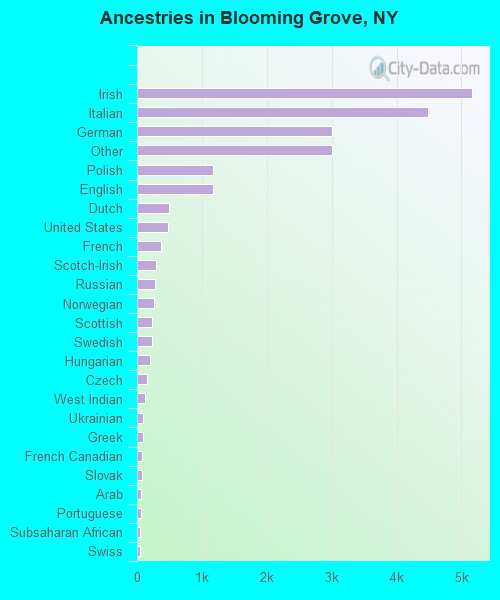
Ancestries in Blooming Grove

- 5,16623.7%Irish
- 4,48520.6%Italian
- 3,00813.8%German
- 3,00713.8%Other
- 1,1775.4%Polish
- 1,1745.4%English
- 4882.2%Dutch
- 4792.2%United States
- 3631.7%French
- 2991.4%Scotch-Irish
- 2851.3%Russian
- 2561.2%Norwegian
- 2371.1%Scottish
- 2331.1%Swedish
- 2060.9%Hungarian
- 1580.7%Czech
- 1200.6%West Indian
- 1000.5%Ukrainian
- 870.4%Greek
- 790.4%French Canadian
- 750.3%Slovak
- 690.3%Arab
- 690.3%Portuguese
- 510.2%Subsaharan African
- 470.2%Swiss
- 380.2%Welsh
- 180.08%Danish
- 100.05%Lithuanian
Zip codes: 10950.