Races in Blue Island, Illinois (IL) Detailed Stats
Data:
Races - White alone (%)
Races - White alone (% change since 2000)
Races - Black alone (%)
Races - Black alone (% change since 2000)
Races - American Indian alone (%)
Races - American Indian alone (% change since 2000)
Races - Asian alone (%)
Races - Asian alone (% change since 2000)
Races - Hispanic (%)
Races - Hispanic (% change since 2000)
Races - Native Hawaiian and Other Pacific Islander alone (%)
Races - Native Hawaiian and Other Pacific Islander alone (% change since 2000)
Races - Two or more races(%)
Races - Two or more races(% change since 2000)
Races - Other race alone (%)
Races - Other race alone (% change since 2000)
Racial diversity
Place of birth - Born in state of residence (%)
Place of birth - Born in state of residence (%) - White
Place of birth - Born in state of residence (%) - Black or African American
Place of birth - Born in state of residence (%) - Asian
Place of birth - Born in state of residence (%) - Hispanic or Latino
Place of birth - Born in state of residence (%) - American Indian and Alaska Native
Place of birth - Born in state of residence (%) - Multirace
Place of birth - Born in state of residence (%) - Other Race
Place of birth - Born in other state (%)
Place of birth - Born in other state (%) - White
Place of birth - Born in other state (%) - Black or African American
Place of birth - Born in other state (%) - Asian
Place of birth - Born in other state (%) - Hispanic or Latino
Place of birth - Born in other state (%) - American Indian and Alaska Native
Place of birth - Born in other state (%) - Multirace
Place of birth - Born in other state (%) - Other Race
Place of birth - Native, outside of US (%)
Place of birth - Native, outside of US (%) - White
Place of birth - Native, outside of US (%) - Black or African American
Place of birth - Native, outside of US (%) - Asian
Place of birth - Native, outside of US (%) - Hispanic or Latino
Place of birth - Native, outside of US (%) - American Indian and Alaska Native
Place of birth - Native, outside of US (%) - Multirace
Place of birth - Native, outside of US (%) - Other Race
Place of birth - Foreign born (%)
Place of birth - Foreign born (%) - White
Place of birth - Foreign born (%) - Black or African American
Place of birth - Foreign born (%) - Asian
Place of birth - Foreign born (%) - Hispanic or Latino
Place of birth - Foreign born (%) - American Indian and Alaska Native
Place of birth - Foreign born (%) - Multirace
Place of birth - Foreign born (%) - Other Race
Residents speaking English at home (%)
Residents speaking English at home - Born in the United States (%)
Residents speaking English at home - Native, born elsewhere (%)
Residents speaking English at home - Foreign born (%)
Residents speaking Spanish at home (%)
Residents speaking Spanish at home - Born in the United States (%)
Residents speaking Spanish at home - Native, born elsewhere (%)
Residents speaking Spanish at home - Foreign born (%)
Residents speaking other language at home (%)
Residents speaking other language at home - Born in the United States (%)
Residents speaking other language at home - Native, born elsewhere (%)
Residents speaking other language at home - Foreign born (%)
Marital status - Never married (%)
Marital status - Now married (%)
Marital status - Separated (%)
Marital status - Widowed (%)
Marital status - Divorced (%)
Ancestries Reported - Arab (%)
Ancestries Reported - Czech (%)
Ancestries Reported - Danish (%)
Ancestries Reported - Dutch (%)
Ancestries Reported - English (%)
Ancestries Reported - French (%)
Ancestries Reported - French Canadian (%)
Ancestries Reported - German (%)
Ancestries Reported - Greek (%)
Ancestries Reported - Hungarian (%)
Ancestries Reported - Irish (%)
Ancestries Reported - Italian (%)
Ancestries Reported - Lithuanian (%)
Ancestries Reported - Norwegian (%)
Ancestries Reported - Polish (%)
Ancestries Reported - Portuguese (%)
Ancestries Reported - Russian (%)
Ancestries Reported - Scotch-Irish (%)
Ancestries Reported - Scottish (%)
Ancestries Reported - Slovak (%)
Ancestries Reported - Subsaharan African (%)
Ancestries Reported - Swedish (%)
Ancestries Reported - Swiss (%)
Ancestries Reported - Ukrainian (%)
Ancestries Reported - United States (%)
Ancestries Reported - Welsh (%)
Ancestries Reported - West Indian (%)
Ancestries Reported - Other (%)
Geographical mobility - Same house 1 year ago (%)
Geographical mobility - Same house 1 year ago (%) - White
Geographical mobility - Same house 1 year ago (%) - Black or African American
Geographical mobility - Same house 1 year ago (%) - Asian
Geographical mobility - Same house 1 year ago (%) - Hispanic or Latino
Geographical mobility - Same house 1 year ago (%) - American Indian and Alaska Native
Geographical mobility - Same house 1 year ago (%) - Multirace
Geographical mobility - Same house 1 year ago (%) - Other Race
Geographical mobility - Moved within same county (%)
Geographical mobility - Moved within same county (%) - White
Geographical mobility - Moved within same county (%) - Black or African American
Geographical mobility - Moved within same county (%) - Asian
Geographical mobility - Moved within same county (%) - Hispanic or Latino
Geographical mobility - Moved within same county (%) - American Indian and Alaska Native
Geographical mobility - Moved within same county (%) - Multirace
Geographical mobility - Moved within same county (%) - Other Race
Geographical mobility - Moved from different county within same state (%)
Geographical mobility - Moved from different county within same state (%) - White
Geographical mobility - Moved from different county within same state (%) - Black or African American
Geographical mobility - Moved from different county within same state (%) - Asian
Geographical mobility - Moved from different county within same state (%) - Hispanic or Latino
Geographical mobility - Moved from different county within same state (%) - American Indian and Alaska Native
Geographical mobility - Moved from different county within same state (%) - Multirace
Geographical mobility - Moved from different county within same state (%) - Other Race
Geographical mobility - Moved from different state (%)
Geographical mobility - Moved from different state (%) - White
Geographical mobility - Moved from different state (%) - Black or African American
Geographical mobility - Moved from different state (%) - Asian
Geographical mobility - Moved from different state (%) - Hispanic or Latino
Geographical mobility - Moved from different state (%) - American Indian and Alaska Native
Geographical mobility - Moved from different state (%) - Multirace
Geographical mobility - Moved from different state (%) - Other Race
Geographical mobility - Moved from abroad (%)
Geographical mobility - Moved from abroad (%) - White
Geographical mobility - Moved from abroad (%) - Black or African American
Geographical mobility - Moved from abroad (%) - Asian
Geographical mobility - Moved from abroad (%) - Hispanic or Latino
Geographical mobility - Moved from abroad (%) - American Indian and Alaska Native
Geographical mobility - Moved from abroad (%) - Multirace
Geographical mobility - Moved from abroad (%) - Other Race
Place of birth for the foreign-born population - Ireland (%)
Place of birth for the foreign-born population - Denmark (%)
Place of birth for the foreign-born population - Norway (%)
Place of birth for the foreign-born population - Sweden (%)
Place of birth for the foreign-born population - United Kingdom (%)
Place of birth for the foreign-born population - England (%)
Place of birth for the foreign-born population - Scotland (%)
Place of birth for the foreign-born population - Other Northern Europe (%)
Place of birth for the foreign-born population - Austria (%)
Place of birth for the foreign-born population - Belgium (%)
Place of birth for the foreign-born population - France (%)
Place of birth for the foreign-born population - Germany (%)
Place of birth for the foreign-born population - Netherlands (%)
Place of birth for the foreign-born population - Switzerland (%)
Place of birth for the foreign-born population - Other Western Europe (%)
Place of birth for the foreign-born population - Greece (%)
Place of birth for the foreign-born population - Italy (%)
Place of birth for the foreign-born population - Portugal (%)
Place of birth for the foreign-born population - Spain (%)
Place of birth for the foreign-born population - Other Southern Europe (%)
Place of birth for the foreign-born population - Albania (%)
Place of birth for the foreign-born population - Belarus (%)
Place of birth for the foreign-born population - Bosnia and Herzegovina (%)
Place of birth for the foreign-born population - Bulgaria (%)
Place of birth for the foreign-born population - Croatia (%)
Place of birth for the foreign-born population - Czechoslovakia (%)
Place of birth for the foreign-born population - Hungary (%)
Place of birth for the foreign-born population - Latvia (%)
Place of birth for the foreign-born population - Lithuania (%)
Place of birth for the foreign-born population - North Macedonia (Macedonia) (%)
Place of birth for the foreign-born population - Moldova (%)
Place of birth for the foreign-born population - Poland (%)
Place of birth for the foreign-born population - Romania (%)
Place of birth for the foreign-born population - Russia (%)
Place of birth for the foreign-born population - Serbia (%)
Place of birth for the foreign-born population - Ukraine (%)
Place of birth for the foreign-born population - Other Eastern Europe (%)
Place of birth for the foreign-born population - China (%)
Place of birth for the foreign-born population - Hong Kong (%)
Place of birth for the foreign-born population - Taiwan (%)
Place of birth for the foreign-born population - Japan (%)
Place of birth for the foreign-born population - Korea (%)
Place of birth for the foreign-born population - Other Eastern Asia (%)
Place of birth for the foreign-born population - Afghanistan (%)
Place of birth for the foreign-born population - Bangladesh (%)
Place of birth for the foreign-born population - India (%)
Place of birth for the foreign-born population - Iran (%)
Place of birth for the foreign-born population - Kazakhstan (%)
Place of birth for the foreign-born population - Nepal (%)
Place of birth for the foreign-born population - Pakistan (%)
Place of birth for the foreign-born population - Sri Lanka (%)
Place of birth for the foreign-born population - Uzbekistan (%)
Place of birth for the foreign-born population - Other South Central Asia (%)
Place of birth for the foreign-born population - Burma (%)
Place of birth for the foreign-born population - Cambodia (%)
Place of birth for the foreign-born population - Indonesia (%)
Place of birth for the foreign-born population - Laos (%)
Place of birth for the foreign-born population - Malaysia (%)
Place of birth for the foreign-born population - Philippines (%)
Place of birth for the foreign-born population - Singapore (%)
Place of birth for the foreign-born population - Thailand (%)
Place of birth for the foreign-born population - Vietnam (%)
Place of birth for the foreign-born population - Other South Eastern Asia (%)
Place of birth for the foreign-born population - Armenia (%)
Place of birth for the foreign-born population - Iraq (%)
Place of birth for the foreign-born population - Israel (%)
Place of birth for the foreign-born population - Jordan (%)
Place of birth for the foreign-born population - Kuwait (%)
Place of birth for the foreign-born population - Lebanon (%)
Place of birth for the foreign-born population - Saudi Arabia (%)
Place of birth for the foreign-born population - Syria (%)
Place of birth for the foreign-born population - Turkey (%)
Place of birth for the foreign-born population - Yemen (%)
Place of birth for the foreign-born population - Other Western Asia (%)
Place of birth for the foreign-born population - Eritrea (%)
Place of birth for the foreign-born population - Ethiopia (%)
Place of birth for the foreign-born population - Kenya (%)
Place of birth for the foreign-born population - Somalia (%)
Place of birth for the foreign-born population - Uganda (%)
Place of birth for the foreign-born population - Zimbabwe (%)
Place of birth for the foreign-born population - Other Eastern Africa (%)
Place of birth for the foreign-born population - Cameroon (%)
Place of birth for the foreign-born population - Congo (%)
Place of birth for the foreign-born population - Democratic Republic of Congo (Zaire) (%)
Place of birth for the foreign-born population - Other Middle Africa (%)
Place of birth for the foreign-born population - Egypt (%)
Place of birth for the foreign-born population - Morocco (%)
Place of birth for the foreign-born population - Sudan (%)
Place of birth for the foreign-born population - Other Northern Africa (%)
Place of birth for the foreign-born population - South Africa (%)
Place of birth for the foreign-born population - Other Southern Africa (%)
Place of birth for the foreign-born population - Cabo Verde (%)
Place of birth for the foreign-born population - Ghana (%)
Place of birth for the foreign-born population - Liberia (%)
Place of birth for the foreign-born population - Nigeria (%)
Place of birth for the foreign-born population - Senegal (%)
Place of birth for the foreign-born population - Sierra Leone (%)
Place of birth for the foreign-born population - Other Western Africa (%)
Place of birth for the foreign-born population - Australia (%)
Place of birth for the foreign-born population - New Zealand (%)
Place of birth for the foreign-born population - Fiji (%)
Place of birth for the foreign-born population - Micronesia (%)
Place of birth for the foreign-born population - Bahamas (%)
Place of birth for the foreign-born population - Barbados (%)
Place of birth for the foreign-born population - Cuba (%)
Place of birth for the foreign-born population - Dominica (%)
Place of birth for the foreign-born population - Dominican Republic (%)
Place of birth for the foreign-born population - Grenada (%)
Place of birth for the foreign-born population - Haiti (%)
Place of birth for the foreign-born population - Jamaica (%)
Place of birth for the foreign-born population - St. Vincent and the Grenadines (%)
Place of birth for the foreign-born population - Trinidad and Tobago (%)
Place of birth for the foreign-born population - West Indies (%)
Place of birth for the foreign-born population - Other Caribbean (%)
Place of birth for the foreign-born population - Belize (%)
Place of birth for the foreign-born population - Costa Rica (%)
Place of birth for the foreign-born population - El Salvador (%)
Place of birth for the foreign-born population - Guatemala (%)
Place of birth for the foreign-born population - Honduras (%)
Place of birth for the foreign-born population - Mexico (%)
Place of birth for the foreign-born population - Nicaragua (%)
Place of birth for the foreign-born population - Panama (%)
Place of birth for the foreign-born population - Other Central America (%)
Place of birth for the foreign-born population - Argentina (%)
Place of birth for the foreign-born population - Bolivia (%)
Place of birth for the foreign-born population - Brazil (%)
Place of birth for the foreign-born population - Chile (%)
Place of birth for the foreign-born population - Colombia (%)
Place of birth for the foreign-born population - Ecuador (%)
Place of birth for the foreign-born population - Guyana (%)
Place of birth for the foreign-born population - Peru (%)
Place of birth for the foreign-born population - Uruguay (%)
Place of birth for the foreign-born population - Venezuela (%)
Place of birth for the foreign-born population - Other South America (%)
Place of birth for the foreign-born population - Canada (%)
Place of birth for the foreign-born population - Other Northern America (%)
Place of birth for the foreign-born population - Other (%)
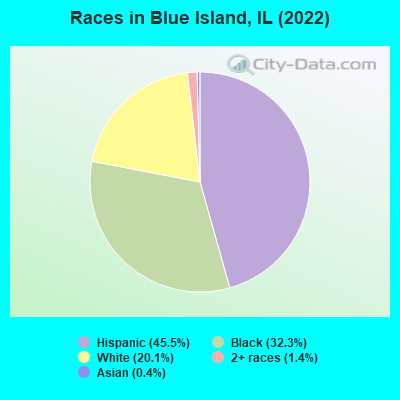
According to 2022 data, the most numerous races in Blue Island, IL are White alone (4,503 residents), Hispanic (10,214 residents), and Black alone (7,252 residents). 60.9% of Blue Island residents speak English at home. 21.3% of Blue Island, IL residents are foreign-born (19.8% born in Latin America), which is 34.4% greater than the foreign-born rate of 14.0% across the entire state of Illinois.
Race distribution in Blue Island
2000 2022
8,424,140 67.8% White alone 1,856,152 14.9% Black alone 1,530,262 12.3% Hispanic 419,916 3.4% Asian alone 153,996 1.2% Two or more races 13,479 0.1% Other race alone 18,232 0.1% American Indian alone 3,116 0.03% Native Hawaiian and Other
7,356,301 58.5% White alone 2,299,726 18.3% Hispanic 1,660,423 13.2% Black alone 747,296 5.9% Asian alone 458,599 3.6% Two or more races 45,386 0.4% Other race alone 10,405 0.08% American Indian alone 3,896 0.03% Native Hawaiian and Other
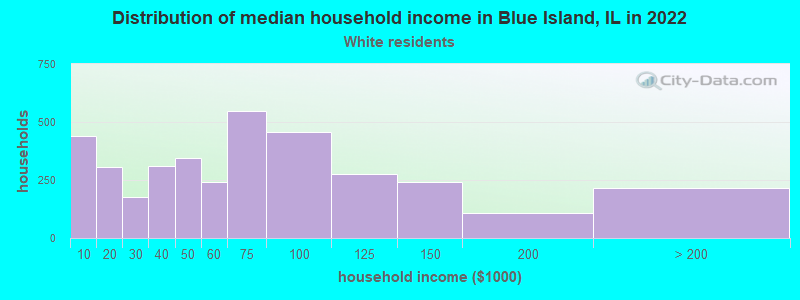
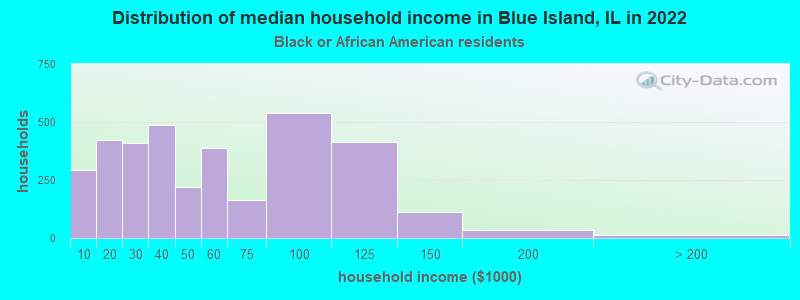
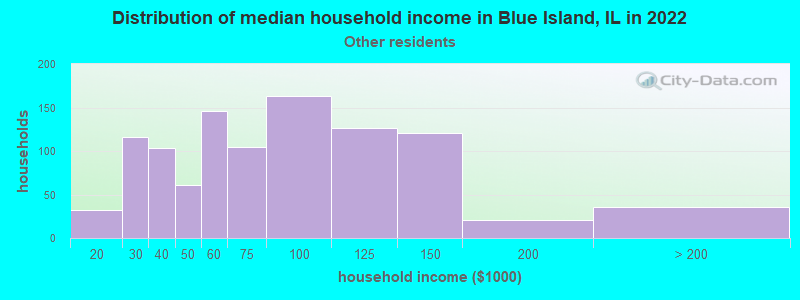
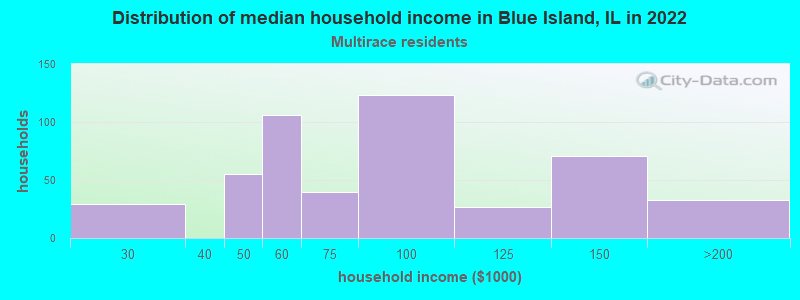
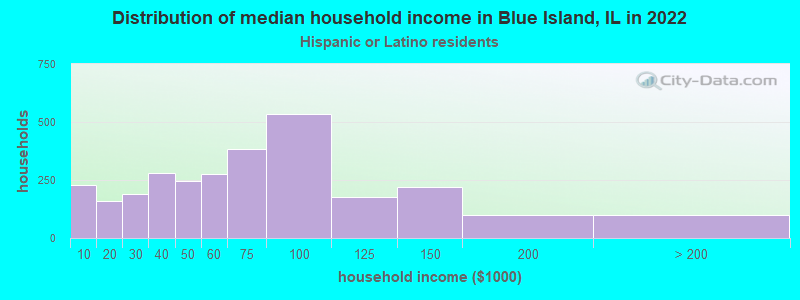
Income and house value in Blue Island Median household income in 2022 $61,600 White non-Hispanic householders$42,537 Black householders$66,923 Some other race householders$74,081 Two or more races householders$64,483 Hispanic or Latino race householdersMedian 2022 house value $167,287 White Non-Hispanic householders$162,173 Black or African American householders$226,844 American Indian or Alaska Native householders$167,617 Some other race householders$190,879 Two or more races householders$161,513 Hispanic or Latino householders
Median age by race in Blue Island
44.3 Median age for White residents39.1 49.1 34.0 Median age for Black or African American residents29.1 38.1 -680,473,372.1 Median age for American Indian / Alaska Native residents-736,736,736.0 -641,399,416.3 31.1 Median age for Asian residents41.5 30.9 -687,999,999.3 Median age for Native Hawaiian / Pacific Islander residents-918,721,460.3 -610,229,276.3 31.1 Median age for Other race residents33.2 29.4 28.8 Median age for Two or more races residents32.6 25.5 55.8 Median age for White alone residents51.9 60.7 32.0 Median age for Hispanic or Latino residents30.7 33.3
Owner/renter occupied households by race in Blue Island
House owners and renters - White residents 2,270 62.7% Owner occupied1,350 37.3% Renter occupiedHouse owners and renters - Black or African American residents 881 25.0% Owner occupied2,647 75.0% Renter occupiedHouse owners and renters - American Indian / Alaska Native residents 6 100.0% Owner occupiedHouse owners and renters - Asian residents 26 100.0% Owner occupiedHouse owners and renters - Native Hawaiian / Pacific Islander residents 22 100.0% Owner occupiedHouse owners and renters - Other race residents 807 77.1% Owner occupied239 22.9% Renter occupiedHouse owners and renters - Two or more races residents 276 55.3% Owner occupied223 44.7% Renter occupiedHouse owners and renters - White alone residents 1,404 61.8% Owner occupied868 38.2% Renter occupiedHouse owners and renters - Hispanic or Latino residents 2,042 70.2% Owner occupied867 29.8% Renter occupied
Language usage in Blue Island
English speakers - Total 60.9% of residents of Blue Island speak English at home.
37.1% of residents speak Spanish at home 4,715 60.6% Speak English very well3,068 39.4% Speak English less than very well1.9% of residents speak other language at home 211 53.7% Speak English very well182 46.3% Speak English less than very well
English speakers - Born in the United States 89.7% of residents of Blue Island speak English at home.
9.7% of residents speak Spanish at home 119 70.0% Speak English very well51 30.0% Speak English less than very well0.1% of residents speak other language at home 2 100.0% Speak English very well
English speakers - Native, born elsewhere 58.9% of residents of Blue Island speak English at home.
42.4% of residents speak Spanish at home 94 70.7% Speak English very well39 29.3% Speak English less than very well
English speakers - Foreign-born 9.6% of residents of Blue Island speak English at home.
86.2% of residents speak Spanish at home 1,493 36.6% Speak English very well2,588 63.4% Speak English less than very well4.8% of residents speak other language at home 45 19.7% Speak English very well183 80.3% Speak English less than very well
White (Caucasian) - Speak only English Native:
74.9% (4,590)Foreign-born:
14.3% (317)
White (Caucasian) - Speak another language Native:
21.1% (1,294)Foreign-born:
85.7% (1,897)
Black or African American - Speak another language Native:
4.6% (317)Foreign-born:
91.2% (6)
Asian - Speak only English Native:
100.0% (97)Foreign-born:
70.9% (22)
Native Hawaiian / Pacific Islander - Speak another language Native:
69.9% (20)Foreign-born:
100.0% (66)
Other race - Speak only English Native:
21.3% (400)Foreign-born:
3.8% (61)
Other race - Speak another language Native:
78.4% (1,474)Foreign-born:
96.3% (1,550)
Two or more races - Speak only English Native:
54.6% (608)Foreign-born:
3.6% (19)
Two or more races - Speak another language Native:
45.3% (505)Foreign-born:
96.4% (509)
White alone - Speak only English Native:
90.8% (3,595)Foreign-born:
12.3% (46)
White alone - Speak another language Native:
9.3% (366)Foreign-born:
88.0% (330)
Hispanic or Latino - Speak only English Native:
37.4% (1,910)Foreign-born:
8.6% (373)
Hispanic or Latino - Speak another language Native:
62.9% (3,216)Foreign-born:
91.0% (3,964)
Foreign-born residents in Blue Island 4,783 residents are foreign born (19.8% Latin America ).
This city:
21.3%Illinois:
14.1%
Marital status for residents in Blue Island Marital status - White (Caucasian) population 15 years and over
Males 46.2% Never married42.2% Now married0.5% Separated3.7% Widowed7.4% DivorcedFemales 28.2% Never married46.0% Now married2.6% Separated12.2% Widowed10.9% DivorcedWomen who gave birth in the past 12 months Now married:
100.0% (64)Unmarried:
0.0% (0)
Women who did not give birth in the past 12 months Now married:
50.1% (774)Unmarried:
49.9% (772)
Marital status - Black or African American population 15 years and over
Males 63.5% Never married12.0% Now married5.7% Separated3.1% Widowed15.7% DivorcedFemales 60.8% Never married15.5% Now married4.0% Separated9.3% Widowed10.4% DivorcedWomen who gave birth in the past 12 months Now married:
0.0% (0)Unmarried:
100.0% (136)
Women who did not give birth in the past 12 months Now married:
15.4% (336)Unmarried:
84.6% (1,848)
Marital status - Asian population 15 years and over
Males 30.3% Never married69.7% Now married0.0% Separated0.0% Widowed0.0% DivorcedFemales 70.6% Never married29.4% Now married0.0% Separated0.0% Widowed0.0% DivorcedWomen who did not give birth in the past 12 months Now married:
29.4% (20)Unmarried:
70.6% (48)
Marital status - Native Hawaiian / Pacific Islander population 15 years and over
Males 0.0% Never married100.0% Now married0.0% Separated0.0% Widowed0.0% DivorcedFemales 0.0% Never married100.0% Now married0.0% Separated0.0% Widowed0.0% DivorcedMarital status - Other race population 15 years and over
Males 46.5% Never married48.6% Now married2.1% Separated0.0% Widowed2.8% DivorcedFemales 44.9% Never married48.2% Now married0.9% Separated4.1% Widowed2.0% DivorcedWomen who gave birth in the past 12 months Now married:
100.0% (76)Unmarried:
0.0% (0)
Women who did not give birth in the past 12 months Now married:
31.9% (307)Unmarried:
68.1% (656)
Marital status - Two or more races population 15 years and over
Males 51.4% Never married40.4% Now married8.2% Separated0.0% Widowed0.0% DivorcedFemales 47.9% Never married42.8% Now married0.0% Separated1.5% Widowed7.9% DivorcedWomen who gave birth in the past 12 months Now married:
0.0% (0)Unmarried:
100.0% (44)
Women who did not give birth in the past 12 months Now married:
34.3% (193)Unmarried:
65.7% (369)
Marital status - White alone, not Hispanic / Latino population 15 years and over
Males 46.8% Never married36.6% Now married1.0% Separated4.6% Widowed10.9% DivorcedFemales 25.5% Never married46.8% Now married2.8% Separated12.4% Widowed12.6% DivorcedWomen who did not give birth in the past 12 months Now married:
51.3% (337)Unmarried:
48.7% (320)
Marital status - Hispanic or Latino population 15 years and over
Males 46.0% Never married48.6% Now married0.7% Separated1.5% Widowed3.2% DivorcedFemales 38.5% Never married46.4% Now married1.6% Separated7.9% Widowed5.6% DivorcedWomen who gave birth in the past 12 months Now married:
81.6% (142)Unmarried:
18.4% (32)
Women who did not give birth in the past 12 months Now married:
40.5% (961)Unmarried:
59.5% (1,415)
Ancestries in Blue Island
385 2.5% German319 2.1% Irish220 1.4% Polish189 1.2% Italian126 0.8% English78 0.5% Romanian52 0.3% American42 0.3% British31 0.2% Dutch26 0.2% Hungarian25 0.2% Nigerian18 0.1% Scottish17 0.1% Eastern European13 0.09% Swedish8 0.05% Belizean7 0.05% Portuguese6 0.04% Scotch-Irish5 0.03% Lithuanian1 0.01% Ukrainian
Geographical mobility in Blue Island Same house 1 year ago 8,371 94.0% White (Caucasian)6,890 95.9% Black or African American5 98.7% American Indian / Alaska Native146 99.0% Asian70 100.0% Native Hawaiian / Pacific Islander3,613 93.4% Other race1,578 84.9% Two or more races4,253 94.3% White alone, not Hispanic / Latino9,461 92.9% Hispanic or LatinoMoved within same county 353 4.0% White / Caucasian293 4.1% Black or African American209 5.4% Other race264 14.2% Two or more races183 4.1% White alone, not Hispanic / Latino565 5.5% Hispanic or LatinoMoved within same state 14 0.2% Black or African AmericanMoved from different state 30 0.3% White / Caucasian18 0.2% Black or African American31 0.7% White alone, not Hispanic / LatinoMoved from abroad 81 0.9% White48 1.2% Other race20 0.5% White alone, not Hispanic / Latino148 1.5% Hispanic or Latino
Children Nativity (place of birth) in Blue Island
Children under 6 years - Living with two parents Both parents native 80 100.0% NativeBoth parents foreign-born 205 90.2% Native22 9.8% Foreign-bornOne native, one foreign-born parent 354 100.0% NativeChildren under 6 years - Living with one parent Native parent 770 100.0% NativeForeign-born parent 50 47.0% Native56 53.0% Foreign-bornChildren 6 to 17 years - Living with two parents Both parents native 475 100.0% NativeBoth parents foreign-born 523 92.0% Native45 8.0% Foreign-bornOne native, one foreign-born parent 388 100.0% NativeChildren 6 to 17 years - Living with one parent Native parent 1,347 100.0% NativeForeign-born parent 533 52.7% Native479 47.3% Foreign-born
Grandparents responsible for own grandchildren in Blue Island
Grandparents (30 to 59 years) White / Caucasian 26 100.0% Not responsible for grandchildrenBlack or African American 21 18.7% Responsible for grandchildren91 81.3% Not responsible for grandchildrenOther race 52 100.0% Not responsible for grandchildrenTwo or more races 12 10.3% Responsible for grandchildren107 89.7% Not responsible for grandchildrenHispanic or Latino 11 6.3% Responsible for grandchildren159 93.7% Not responsible for grandchildrenGrandparents (60 years and over) White / Caucasian 68 28.1% Responsible for grandchildren173 71.9% Not responsible for grandchildrenBlack or African American 9 17.7% Responsible for grandchildren41 82.3% Not responsible for grandchildrenTwo or more races 15 100.0% Not responsible for grandchildrenHispanic or Latino 113 39.5% Responsible for grandchildren174 60.5% Not responsible for grandchildren