Races in Blue Springs, Missouri (MO) Detailed Stats
Data:
Races - White alone (%)
Races - White alone (% change since 2000)
Races - Black alone (%)
Races - Black alone (% change since 2000)
Races - American Indian alone (%)
Races - American Indian alone (% change since 2000)
Races - Asian alone (%)
Races - Asian alone (% change since 2000)
Races - Hispanic (%)
Races - Hispanic (% change since 2000)
Races - Native Hawaiian and Other Pacific Islander alone (%)
Races - Native Hawaiian and Other Pacific Islander alone (% change since 2000)
Races - Two or more races(%)
Races - Two or more races(% change since 2000)
Races - Other race alone (%)
Races - Other race alone (% change since 2000)
Racial diversity
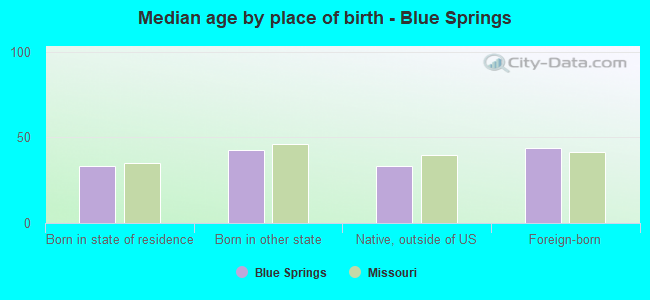
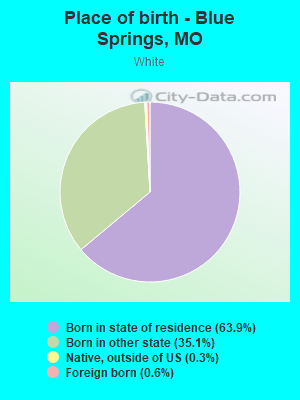
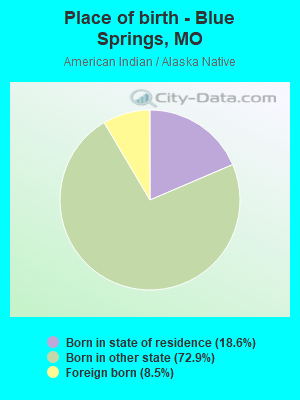
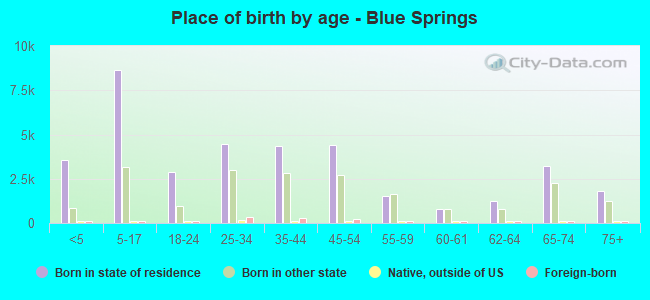
Place of birth - Born in state of residence (%)
Place of birth - Born in state of residence (%) - White
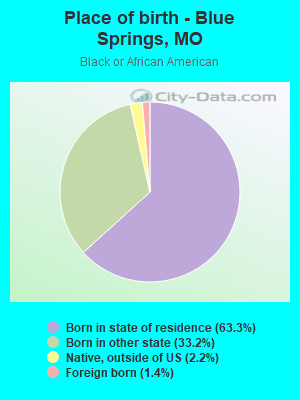
Place of birth - Born in state of residence (%) - Black or African American
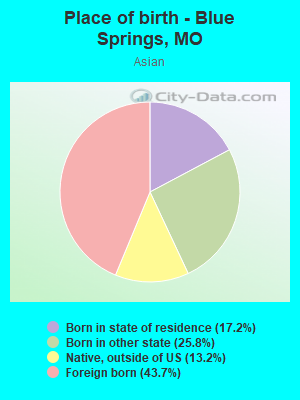
Place of birth - Born in state of residence (%) - Asian
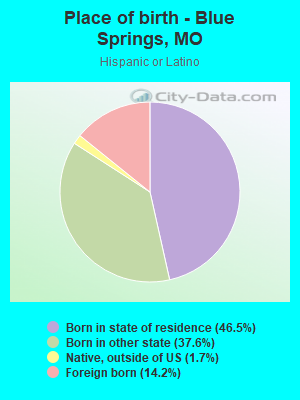
Place of birth - Born in state of residence (%) - Hispanic or Latino
Place of birth - Born in state of residence (%) - American Indian and Alaska Native
Place of birth - Born in state of residence (%) - Multirace
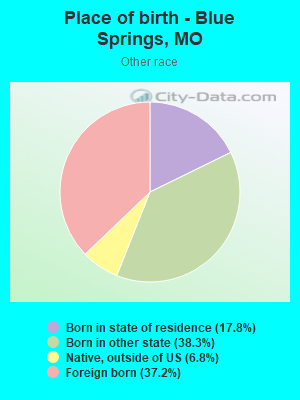
Place of birth - Born in state of residence (%) - Other Race
Place of birth - Born in other state (%)
Place of birth - Born in other state (%) - White
Place of birth - Born in other state (%) - Black or African American
Place of birth - Born in other state (%) - Asian
Place of birth - Born in other state (%) - Hispanic or Latino
Place of birth - Born in other state (%) - American Indian and Alaska Native
Place of birth - Born in other state (%) - Multirace
Place of birth - Born in other state (%) - Other Race
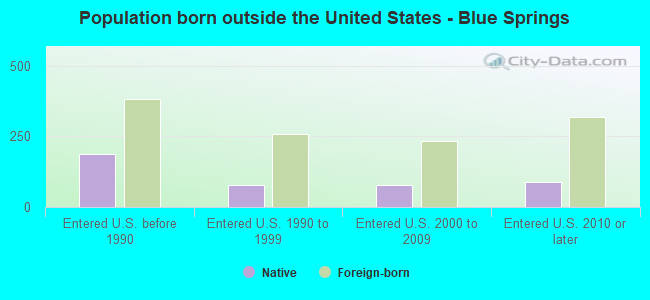
Place of birth - Native, outside of US (%)
Place of birth - Native, outside of US (%) - White
Place of birth - Native, outside of US (%) - Black or African American
Place of birth - Native, outside of US (%) - Asian
Place of birth - Native, outside of US (%) - Hispanic or Latino
Place of birth - Native, outside of US (%) - American Indian and Alaska Native
Place of birth - Native, outside of US (%) - Multirace
Place of birth - Native, outside of US (%) - Other Race
Place of birth - Foreign born (%)
Place of birth - Foreign born (%) - White
Place of birth - Foreign born (%) - Black or African American
Place of birth - Foreign born (%) - Asian
Place of birth - Foreign born (%) - Hispanic or Latino
Place of birth - Foreign born (%) - American Indian and Alaska Native
Place of birth - Foreign born (%) - Multirace
Place of birth - Foreign born (%) - Other Race
Residents speaking English at home (%)
Residents speaking English at home - Born in the United States (%)
Residents speaking English at home - Native, born elsewhere (%)
Residents speaking English at home - Foreign born (%)
Residents speaking Spanish at home (%)
Residents speaking Spanish at home - Born in the United States (%)
Residents speaking Spanish at home - Native, born elsewhere (%)
Residents speaking Spanish at home - Foreign born (%)
Residents speaking other language at home (%)
Residents speaking other language at home - Born in the United States (%)
Residents speaking other language at home - Native, born elsewhere (%)
Residents speaking other language at home - Foreign born (%)
Marital status - Never married (%)
Marital status - Now married (%)
Marital status - Separated (%)
Marital status - Widowed (%)
Marital status - Divorced (%)
Ancestries Reported - Arab (%)
Ancestries Reported - Czech (%)
Ancestries Reported - Danish (%)
Ancestries Reported - Dutch (%)
Ancestries Reported - English (%)
Ancestries Reported - French (%)
Ancestries Reported - French Canadian (%)
Ancestries Reported - German (%)
Ancestries Reported - Greek (%)
Ancestries Reported - Hungarian (%)
Ancestries Reported - Irish (%)
Ancestries Reported - Italian (%)
Ancestries Reported - Lithuanian (%)
Ancestries Reported - Norwegian (%)
Ancestries Reported - Polish (%)
Ancestries Reported - Portuguese (%)
Ancestries Reported - Russian (%)
Ancestries Reported - Scotch-Irish (%)
Ancestries Reported - Scottish (%)
Ancestries Reported - Slovak (%)
Ancestries Reported - Subsaharan African (%)
Ancestries Reported - Swedish (%)
Ancestries Reported - Swiss (%)
Ancestries Reported - Ukrainian (%)
Ancestries Reported - United States (%)
Ancestries Reported - Welsh (%)
Ancestries Reported - West Indian (%)
Ancestries Reported - Other (%)
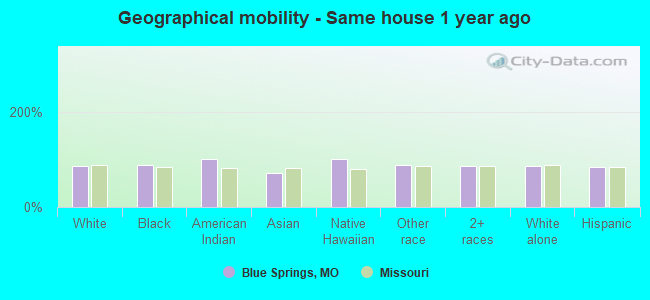
Geographical mobility - Same house 1 year ago (%)
Geographical mobility - Same house 1 year ago (%) - White
Geographical mobility - Same house 1 year ago (%) - Black or African American
Geographical mobility - Same house 1 year ago (%) - Asian
Geographical mobility - Same house 1 year ago (%) - Hispanic or Latino
Geographical mobility - Same house 1 year ago (%) - American Indian and Alaska Native
Geographical mobility - Same house 1 year ago (%) - Multirace
Geographical mobility - Same house 1 year ago (%) - Other Race
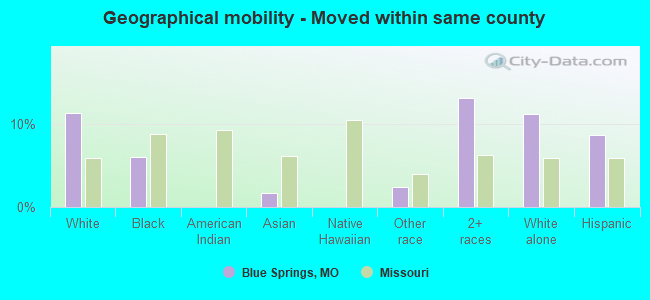
Geographical mobility - Moved within same county (%)
Geographical mobility - Moved within same county (%) - White
Geographical mobility - Moved within same county (%) - Black or African American
Geographical mobility - Moved within same county (%) - Asian
Geographical mobility - Moved within same county (%) - Hispanic or Latino
Geographical mobility - Moved within same county (%) - American Indian and Alaska Native
Geographical mobility - Moved within same county (%) - Multirace
Geographical mobility - Moved within same county (%) - Other Race
Geographical mobility - Moved from different county within same state (%)
Geographical mobility - Moved from different county within same state (%) - White
Geographical mobility - Moved from different county within same state (%) - Black or African American
Geographical mobility - Moved from different county within same state (%) - Asian
Geographical mobility - Moved from different county within same state (%) - Hispanic or Latino
Geographical mobility - Moved from different county within same state (%) - American Indian and Alaska Native
Geographical mobility - Moved from different county within same state (%) - Multirace
Geographical mobility - Moved from different county within same state (%) - Other Race
Geographical mobility - Moved from different state (%)
Geographical mobility - Moved from different state (%) - White
Geographical mobility - Moved from different state (%) - Black or African American
Geographical mobility - Moved from different state (%) - Asian
Geographical mobility - Moved from different state (%) - Hispanic or Latino
Geographical mobility - Moved from different state (%) - American Indian and Alaska Native
Geographical mobility - Moved from different state (%) - Multirace
Geographical mobility - Moved from different state (%) - Other Race
Geographical mobility - Moved from abroad (%)
Geographical mobility - Moved from abroad (%) - White
Geographical mobility - Moved from abroad (%) - Black or African American
Geographical mobility - Moved from abroad (%) - Asian
Geographical mobility - Moved from abroad (%) - Hispanic or Latino
Geographical mobility - Moved from abroad (%) - American Indian and Alaska Native
Geographical mobility - Moved from abroad (%) - Multirace
Geographical mobility - Moved from abroad (%) - Other Race
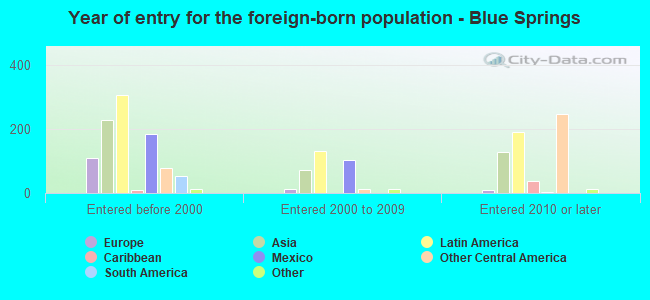
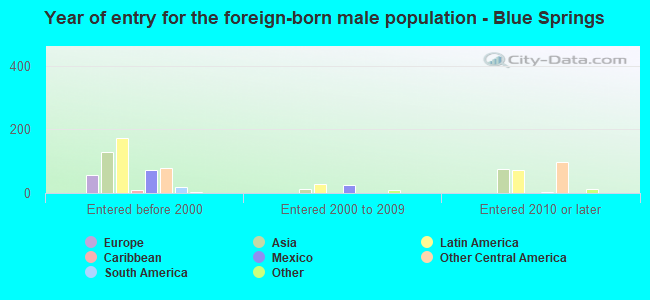
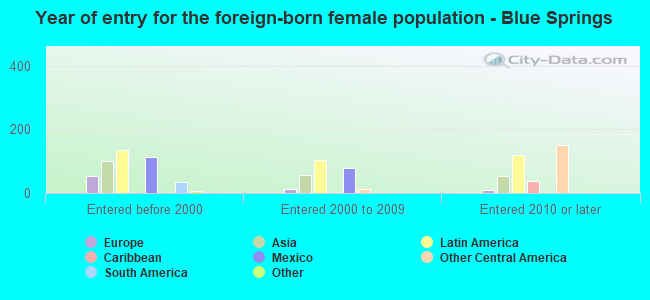
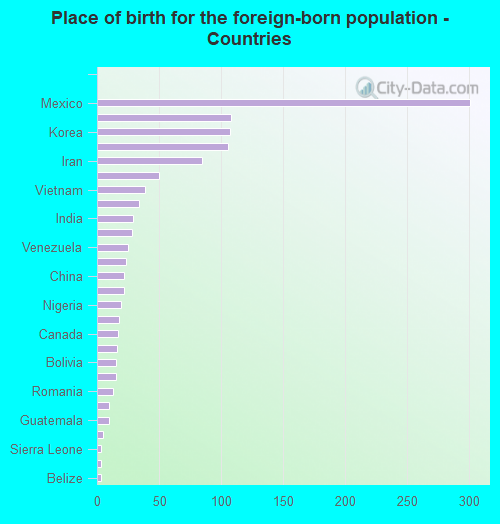
Place of birth for the foreign-born population - Ireland (%)
Place of birth for the foreign-born population - Denmark (%)
Place of birth for the foreign-born population - Norway (%)
Place of birth for the foreign-born population - Sweden (%)
Place of birth for the foreign-born population - United Kingdom (%)
Place of birth for the foreign-born population - England (%)
Place of birth for the foreign-born population - Scotland (%)
Place of birth for the foreign-born population - Other Northern Europe (%)
Place of birth for the foreign-born population - Austria (%)
Place of birth for the foreign-born population - Belgium (%)
Place of birth for the foreign-born population - France (%)
Place of birth for the foreign-born population - Germany (%)
Place of birth for the foreign-born population - Netherlands (%)
Place of birth for the foreign-born population - Switzerland (%)
Place of birth for the foreign-born population - Other Western Europe (%)
Place of birth for the foreign-born population - Greece (%)
Place of birth for the foreign-born population - Italy (%)
Place of birth for the foreign-born population - Portugal (%)
Place of birth for the foreign-born population - Spain (%)
Place of birth for the foreign-born population - Other Southern Europe (%)
Place of birth for the foreign-born population - Albania (%)
Place of birth for the foreign-born population - Belarus (%)
Place of birth for the foreign-born population - Bosnia and Herzegovina (%)
Place of birth for the foreign-born population - Bulgaria (%)
Place of birth for the foreign-born population - Croatia (%)
Place of birth for the foreign-born population - Czechoslovakia (%)
Place of birth for the foreign-born population - Hungary (%)
Place of birth for the foreign-born population - Latvia (%)
Place of birth for the foreign-born population - Lithuania (%)
Place of birth for the foreign-born population - North Macedonia (Macedonia) (%)
Place of birth for the foreign-born population - Moldova (%)
Place of birth for the foreign-born population - Poland (%)
Place of birth for the foreign-born population - Romania (%)
Place of birth for the foreign-born population - Russia (%)
Place of birth for the foreign-born population - Serbia (%)
Place of birth for the foreign-born population - Ukraine (%)
Place of birth for the foreign-born population - Other Eastern Europe (%)
Place of birth for the foreign-born population - China (%)
Place of birth for the foreign-born population - Hong Kong (%)
Place of birth for the foreign-born population - Taiwan (%)
Place of birth for the foreign-born population - Japan (%)
Place of birth for the foreign-born population - Korea (%)
Place of birth for the foreign-born population - Other Eastern Asia (%)
Place of birth for the foreign-born population - Afghanistan (%)
Place of birth for the foreign-born population - Bangladesh (%)
Place of birth for the foreign-born population - India (%)
Place of birth for the foreign-born population - Iran (%)
Place of birth for the foreign-born population - Kazakhstan (%)
Place of birth for the foreign-born population - Nepal (%)
Place of birth for the foreign-born population - Pakistan (%)
Place of birth for the foreign-born population - Sri Lanka (%)
Place of birth for the foreign-born population - Uzbekistan (%)
Place of birth for the foreign-born population - Other South Central Asia (%)
Place of birth for the foreign-born population - Burma (%)
Place of birth for the foreign-born population - Cambodia (%)
Place of birth for the foreign-born population - Indonesia (%)
Place of birth for the foreign-born population - Laos (%)
Place of birth for the foreign-born population - Malaysia (%)
Place of birth for the foreign-born population - Philippines (%)
Place of birth for the foreign-born population - Singapore (%)
Place of birth for the foreign-born population - Thailand (%)
Place of birth for the foreign-born population - Vietnam (%)
Place of birth for the foreign-born population - Other South Eastern Asia (%)
Place of birth for the foreign-born population - Armenia (%)
Place of birth for the foreign-born population - Iraq (%)
Place of birth for the foreign-born population - Israel (%)
Place of birth for the foreign-born population - Jordan (%)
Place of birth for the foreign-born population - Kuwait (%)
Place of birth for the foreign-born population - Lebanon (%)
Place of birth for the foreign-born population - Saudi Arabia (%)
Place of birth for the foreign-born population - Syria (%)
Place of birth for the foreign-born population - Turkey (%)
Place of birth for the foreign-born population - Yemen (%)
Place of birth for the foreign-born population - Other Western Asia (%)
Place of birth for the foreign-born population - Eritrea (%)
Place of birth for the foreign-born population - Ethiopia (%)
Place of birth for the foreign-born population - Kenya (%)
Place of birth for the foreign-born population - Somalia (%)
Place of birth for the foreign-born population - Uganda (%)
Place of birth for the foreign-born population - Zimbabwe (%)
Place of birth for the foreign-born population - Other Eastern Africa (%)
Place of birth for the foreign-born population - Cameroon (%)
Place of birth for the foreign-born population - Congo (%)
Place of birth for the foreign-born population - Democratic Republic of Congo (Zaire) (%)
Place of birth for the foreign-born population - Other Middle Africa (%)
Place of birth for the foreign-born population - Egypt (%)
Place of birth for the foreign-born population - Morocco (%)
Place of birth for the foreign-born population - Sudan (%)
Place of birth for the foreign-born population - Other Northern Africa (%)
Place of birth for the foreign-born population - South Africa (%)
Place of birth for the foreign-born population - Other Southern Africa (%)
Place of birth for the foreign-born population - Cabo Verde (%)
Place of birth for the foreign-born population - Ghana (%)
Place of birth for the foreign-born population - Liberia (%)
Place of birth for the foreign-born population - Nigeria (%)
Place of birth for the foreign-born population - Senegal (%)
Place of birth for the foreign-born population - Sierra Leone (%)
Place of birth for the foreign-born population - Other Western Africa (%)
Place of birth for the foreign-born population - Australia (%)
Place of birth for the foreign-born population - New Zealand (%)
Place of birth for the foreign-born population - Fiji (%)
Place of birth for the foreign-born population - Micronesia (%)
Place of birth for the foreign-born population - Bahamas (%)
Place of birth for the foreign-born population - Barbados (%)
Place of birth for the foreign-born population - Cuba (%)
Place of birth for the foreign-born population - Dominica (%)
Place of birth for the foreign-born population - Dominican Republic (%)
Place of birth for the foreign-born population - Grenada (%)
Place of birth for the foreign-born population - Haiti (%)
Place of birth for the foreign-born population - Jamaica (%)
Place of birth for the foreign-born population - St. Vincent and the Grenadines (%)
Place of birth for the foreign-born population - Trinidad and Tobago (%)
Place of birth for the foreign-born population - West Indies (%)
Place of birth for the foreign-born population - Other Caribbean (%)
Place of birth for the foreign-born population - Belize (%)
Place of birth for the foreign-born population - Costa Rica (%)
Place of birth for the foreign-born population - El Salvador (%)
Place of birth for the foreign-born population - Guatemala (%)
Place of birth for the foreign-born population - Honduras (%)
Place of birth for the foreign-born population - Mexico (%)
Place of birth for the foreign-born population - Nicaragua (%)
Place of birth for the foreign-born population - Panama (%)
Place of birth for the foreign-born population - Other Central America (%)
Place of birth for the foreign-born population - Argentina (%)
Place of birth for the foreign-born population - Bolivia (%)
Place of birth for the foreign-born population - Brazil (%)
Place of birth for the foreign-born population - Chile (%)
Place of birth for the foreign-born population - Colombia (%)
Place of birth for the foreign-born population - Ecuador (%)
Place of birth for the foreign-born population - Guyana (%)
Place of birth for the foreign-born population - Peru (%)
Place of birth for the foreign-born population - Uruguay (%)
Place of birth for the foreign-born population - Venezuela (%)
Place of birth for the foreign-born population - Other South America (%)
Place of birth for the foreign-born population - Canada (%)
Place of birth for the foreign-born population - Other Northern America (%)
Place of birth for the foreign-born population - Other (%)
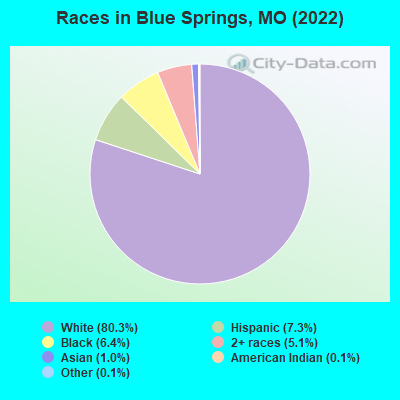
According to 2022 data, the most numerous races in Blue Springs, MO are White alone (47,236 residents), Black alone (3,791 residents), and Two or more races (2,993 residents). 96.2% of Blue Springs residents speak English at home. 1.9% of Blue Springs, MO residents are foreign-born , which is 105.4% less than the foreign-born rate of 4.0% across the entire state of Missouri.
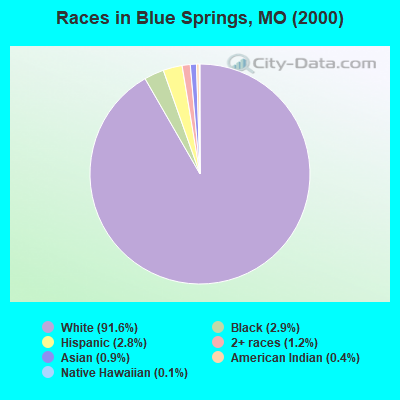
Race distribution in Blue Springs
2000 2022
4,686,474 83.8% White alone 625,667 11.2% Black alone 118,592 2.1% Hispanic 71,905 1.3% Two or more races 61,041 1.1% Asian alone 23,302 0.4% American Indian alone 5,291 0.09% Other race alone 2,939 0.05% Native Hawaiian and Other
4,733,411 76.6% White alone 656,739 10.6% Black alone 316,300 5.1% Two or more races 291,763 4.7% Hispanic 132,436 2.1% Asian alone 27,467 0.4% Other race alone 12,313 0.2% American Indian alone 7,528 0.1% Native Hawaiian and Other
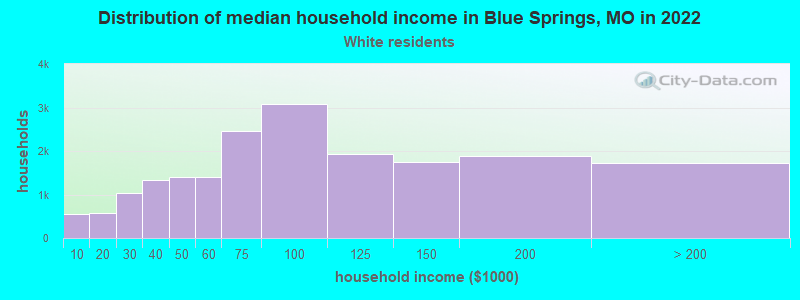
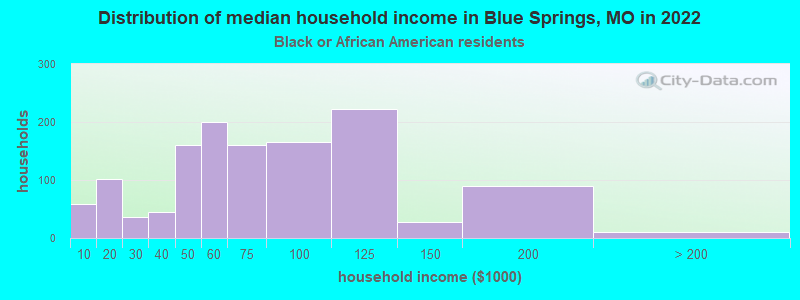
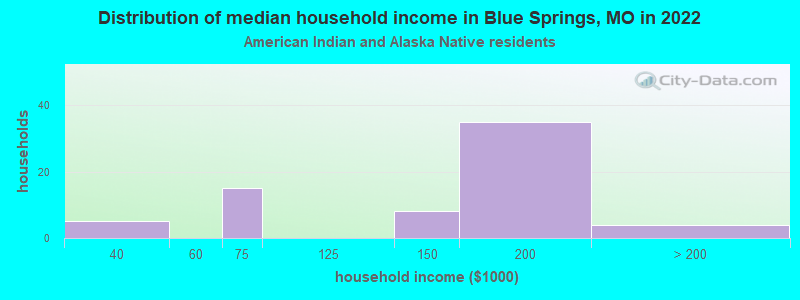
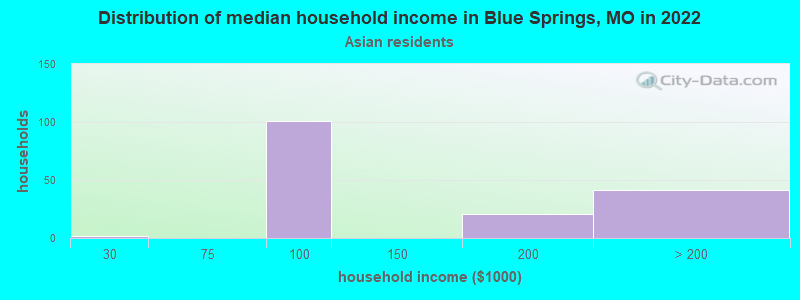
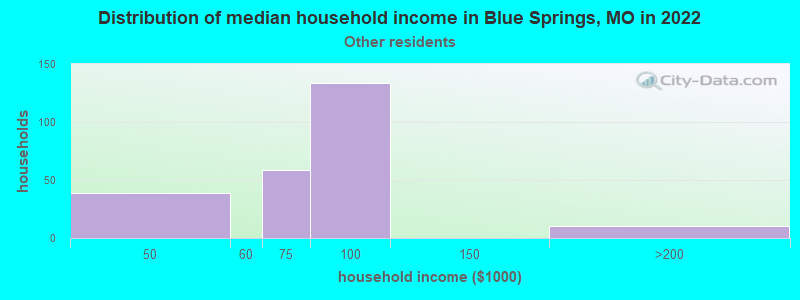
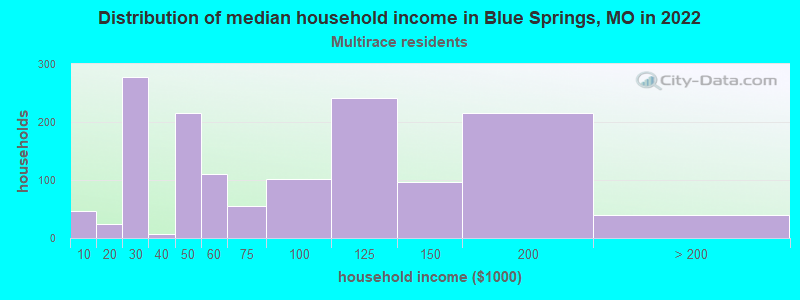
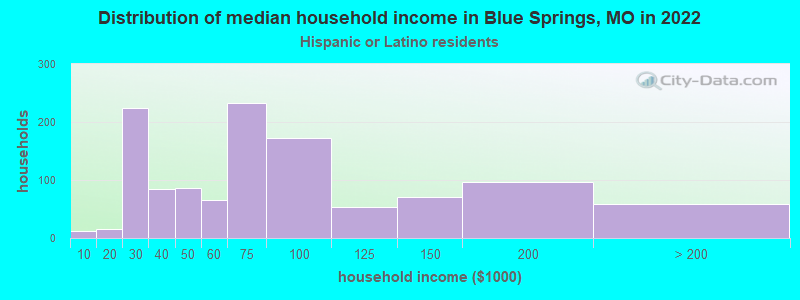
Income and house value in Blue Springs Median household income in 2022 $81,995 White non-Hispanic householders$64,849 Black householdersover $200,000 American Indian and Alaska Native householders$80,105 Some other race householders$71,586 Two or more races householders$68,140 Hispanic or Latino race householdersMedian 2022 house value $254,172 White Non-Hispanic householders$245,286 Black or African American householders$209,978 American Indian or Alaska Native householders $299,067 Asian householders$368,280 Native Hawaiian and other Pacific Islander householders$205,535 Some other race householders$259,316 Two or more races householders$205,301 Hispanic or Latino householders
Median age by race in Blue Springs
39.8 Median age for White residents38.3 40.9 29.5 Median age for Black or African American residents30.0 26.1 48.5 Median age for American Indian / Alaska Native residents43.6 63.9 33.5 Median age for Asian residents40.4 32.4 -832,285,114.5 Median age for Native Hawaiian / Pacific Islander residents-678,601,874.9 -752,136,751.4 31.4 Median age for Other race residents28.8 38.3 19.3 Median age for Two or more races residents17.2 23.5 40.1 Median age for White alone residents38.1 40.9 23.8 Median age for Hispanic or Latino residents23.3 25.0
Owner/renter occupied households by race in Blue Springs
House owners and renters - White residents 14,028 72.9% Owner occupied5,209 27.1% Renter occupiedHouse owners and renters - Black or African American residents 476 36.0% Owner occupied846 64.0% Renter occupiedHouse owners and renters - American Indian / Alaska Native residents 42 61.1% Owner occupied27 38.9% Renter occupiedHouse owners and renters - Asian residents 131 74.4% Owner occupied45 25.6% Renter occupiedHouse owners and renters - Other race residents 57 28.8% Owner occupied140 71.2% Renter occupiedHouse owners and renters - Two or more races residents 708 46.2% Owner occupied823 53.8% Renter occupiedHouse owners and renters - White alone residents 13,870 73.2% Owner occupied5,083 26.8% Renter occupiedHouse owners and renters - Hispanic or Latino residents 532 42.4% Owner occupied724 57.6% Renter occupied
Language usage in Blue Springs
English speakers - Total 96.2% of residents of Blue Springs speak English at home.
2.7% of residents speak Spanish at home 1,128 76.6% Speak English very well344 23.4% Speak English less than very well1.0% of residents speak other language at home 410 75.8% Speak English very well131 24.2% Speak English less than very well
English speakers - Born in the United States 97.4% of residents of Blue Springs speak English at home.
1.6% of residents speak Spanish at home 302 97.1% Speak English very well9 2.9% Speak English less than very well0.6% of residents speak other language at home 83 67.5% Speak English very well40 32.5% Speak English less than very well
English speakers - Native, born elsewhere 79.6% of residents of Blue Springs speak English at home.
4.7% of residents speak Spanish at home 22 100.0% Speak English very well10.0% of residents speak other language at home 47 100.0% Speak English very well
English speakers - Foreign-born 28.0% of residents of Blue Springs speak English at home.
49.5% of residents speak Spanish at home 248 41.8% Speak English very well345 58.2% Speak English less than very well23.2% of residents speak other language at home 189 68.0% Speak English very well89 32.0% Speak English less than very well
White (Caucasian) - Speak only English Native:
99.2% (44,588)Foreign-born:
72.9% (203)
White (Caucasian) - Speak another language Native:
1.1% (510)Foreign-born:
40.3% (112)
Black or African American - Speak only English Native:
98.1% (3,420)Foreign-born:
72.9% (39)
Black or African American - Speak another language Native:
1.5% (54)Foreign-born:
32.8% (17)
American Indian / Alaska Native - Speak another language Native:
8.6% (11)Foreign-born:
100.0% (12)
Asian - Speak only English Native:
61.0% (225)Foreign-born:
24.8% (76)
Asian - Speak another language Native:
39.1% (144)Foreign-born:
75.5% (232)
Other race - Speak another language Native:
31.2% (96)Foreign-born:
94.7% (239)
Two or more races - Speak only English Native:
94.5% (3,847)Foreign-born:
5.2% (15)
Two or more races - Speak another language Native:
4.1% (169)Foreign-born:
92.3% (273)
White alone - Speak only English Native:
99.1% (43,548)Foreign-born:
85.7% (204)
White alone - Speak another language Native:
0.9% (384)Foreign-born:
14.5% (35)
Hispanic or Latino - Speak another language Native:
17.7% (546)Foreign-born:
99.9% (602)
Foreign-born residents in Blue Springs 1,145 residents are foreign born
This city:
1.9%Missouri:
4.2%
Marital status for residents in Blue Springs Marital status - White (Caucasian) population 15 years and over
Males 28.2% Never married60.3% Now married0.9% Separated2.8% Widowed7.8% DivorcedFemales 20.3% Never married54.7% Now married2.1% Separated6.7% Widowed16.1% DivorcedWomen who gave birth in the past 12 months Now married:
74.1% (533)Unmarried:
25.9% (186)
Women who did not give birth in the past 12 months Now married:
51.3% (5,382)Unmarried:
48.7% (5,115)
Marital status - Black or African American population 15 years and over
Males 51.9% Never married36.9% Now married0.0% Separated0.5% Widowed10.7% DivorcedFemales 47.8% Never married30.6% Now married5.7% Separated1.6% Widowed14.4% DivorcedWomen who did not give birth in the past 12 months Now married:
31.1% (328)Unmarried:
68.9% (728)
Marital status - American Indian / Alaska Native population 15 years and over
Males 7.8% Never married81.4% Now married0.0% Separated0.0% Widowed10.8% DivorcedFemales 10.8% Never married45.9% Now married0.0% Separated0.0% Widowed43.2% DivorcedWomen who gave birth in the past 12 months Now married:
100.0% (9)Unmarried:
0.0% (0)
Women who did not give birth in the past 12 months Now married:
0.0% (0)Unmarried:
100.0% (4)
Marital status - Asian population 15 years and over
Males 37.7% Never married52.0% Now married0.0% Separated0.0% Widowed10.3% DivorcedFemales 29.5% Never married56.9% Now married0.0% Separated4.9% Widowed8.7% DivorcedWomen who gave birth in the past 12 months Now married:
51.4% (21)Unmarried:
48.6% (20)
Women who did not give birth in the past 12 months Now married:
48.2% (95)Unmarried:
51.8% (102)
Marital status - Other race population 15 years and over
Males 50.0% Never married35.4% Now married0.0% Separated0.0% Widowed14.6% DivorcedFemales 41.1% Never married52.6% Now married0.0% Separated0.0% Widowed6.3% DivorcedWomen who gave birth in the past 12 months Now married:
100.0% (16)Unmarried:
0.0% (0)
Women who did not give birth in the past 12 months Now married:
51.9% (109)Unmarried:
48.1% (101)
Marital status - Two or more races population 15 years and over
Males 45.9% Never married43.9% Now married3.6% Separated0.0% Widowed6.6% DivorcedFemales 48.6% Never married42.0% Now married2.7% Separated1.2% Widowed5.5% DivorcedWomen who gave birth in the past 12 months Now married:
100.0% (28)Unmarried:
0.0% (0)
Women who did not give birth in the past 12 months Now married:
37.3% (505)Unmarried:
62.7% (849)
Marital status - White alone, not Hispanic / Latino population 15 years and over
Males 28.2% Never married60.0% Now married0.9% Separated2.9% Widowed7.9% DivorcedFemales 19.5% Never married54.8% Now married2.1% Separated6.9% Widowed16.7% DivorcedWomen who gave birth in the past 12 months Now married:
74.2% (547)Unmarried:
25.8% (190)
Women who did not give birth in the past 12 months Now married:
51.2% (5,179)Unmarried:
48.8% (4,937)
Marital status - Hispanic or Latino population 15 years and over
Males 36.8% Never married51.8% Now married2.8% Separated0.0% Widowed8.6% DivorcedFemales 42.9% Never married47.3% Now married3.5% Separated1.0% Widowed5.3% DivorcedWomen who gave birth in the past 12 months Now married:
90.5% (20)Unmarried:
9.5% (2)
Women who did not give birth in the past 12 months Now married:
48.2% (655)Unmarried:
51.8% (705)
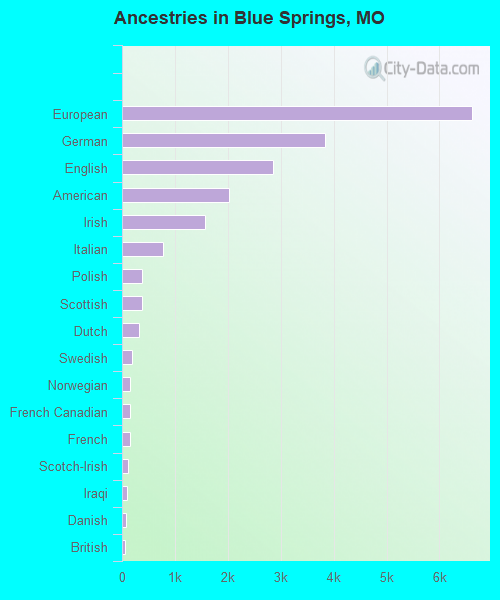
Ancestries in Blue Springs
6,607 24.5% European3,845 14.3% German2,863 10.6% English2,031 7.5% American1,561 5.8% Irish771 2.9% Italian377 1.4% Polish371 1.4% Scottish330 1.2% Dutch183 0.7% Swedish154 0.6% Norwegian151 0.6% French Canadian144 0.5% French116 0.4% Scotch-Irish98 0.4% Iraqi83 0.3% Danish65 0.2% British46 0.2% Eastern European45 0.2% Belgian42 0.2% African41 0.2% Welsh35 0.1% Finnish31 0.1% Ukrainian28 0.1% Croatian26 0.10% Russian26 0.10% Nigerian23 0.09% Greek23 0.09% Sierra Leonean21 0.08% Trinidadian and Tobagonian18 0.07% Romanian15 0.06% Austrian14 0.05% Scandinavian12 0.04% Jamaican10 0.04% Czech10 0.04% Iranian9 0.03% Moroccan8 0.03% Lithuanian8 0.03% Canadian7 0.03% Northern European5 0.02% Yugoslavian
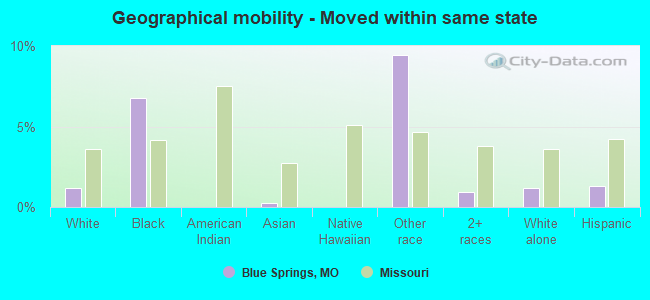
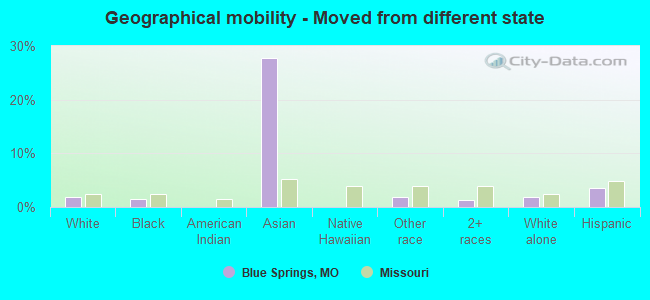
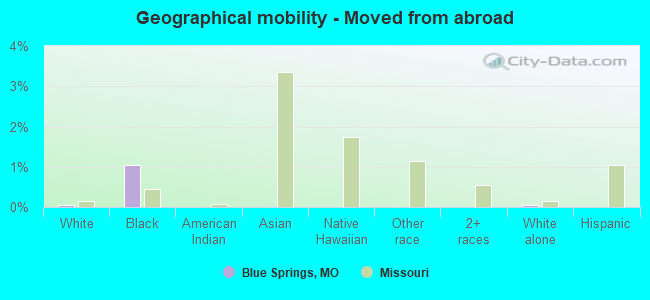
Geographical mobility in Blue Springs Same house 1 year ago 40,907 85.8% White (Caucasian)3,294 87.5% Black or African American148 100.0% American Indian / Alaska Native484 72.5% Asian11 100.0% Native Hawaiian / Pacific Islander556 87.8% Other race4,510 85.4% Two or more races40,308 86.2% White alone, not Hispanic / Latino3,585 84.0% Hispanic or LatinoMoved within same county 5,434 11.4% White / Caucasian230 6.1% Black or African American11 1.7% Asian15 2.4% Other race695 13.2% Two or more races5,262 11.3% White alone, not Hispanic / Latino372 8.7% Hispanic or LatinoMoved within same state 561 1.2% White / Caucasian254 6.8% Black or African American2 0.2% Asian60 9.5% Other race50 0.9% Two or more races548 1.2% White alone, not Hispanic / Latino56 1.3% Hispanic or LatinoMoved from different state 925 1.9% White / Caucasian56 1.5% Black or African American186 27.9% Asian12 1.9% Other race66 1.3% Two or more races847 1.8% White alone, not Hispanic / Latino151 3.5% Hispanic or LatinoMoved from abroad 25 0.1% White39 1.0% Black or African American24 0.1% White alone, not Hispanic / Latino
Children Nativity (place of birth) in Blue Springs
Children under 6 years - Living with two parents Both parents native 3,425 100.0% NativeBoth parents foreign-born 37 100.0% NativeOne native, one foreign-born parent 143 100.0% NativeChildren under 6 years - Living with one parent Native parent 1,274 100.0% NativeForeign-born parent 97 100.0% NativeChildren 6 to 17 years - Living with two parents Both parents native 5,449 100.0% Native2 0.0% Foreign-bornBoth parents foreign-born 82 92.6% Native7 7.4% Foreign-bornOne native, one foreign-born parent 337 100.0% NativeChildren 6 to 17 years - Living with one parent Native parent 4,244 100.0% NativeForeign-born parent 118 51.8% Native109 48.2% Foreign-born
Grandparents responsible for own grandchildren in Blue Springs
Grandparents (30 to 59 years) White / Caucasian 136 59.9% Responsible for grandchildren91 40.1% Not responsible for grandchildrenBlack or African American 12 16.8% Responsible for grandchildren59 83.2% Not responsible for grandchildrenAmerican Indian / Alaska Native 12 100.0% Not responsible for grandchildrenOther race 6 100.0% Not responsible for grandchildrenWhite alone, not Hispanic / Latino 110 54.9% Responsible for grandchildren91 45.1% Not responsible for grandchildrenHispanic or Latino 58 82.5% Responsible for grandchildren12 17.5% Not responsible for grandchildrenGrandparents (60 years and over) White / Caucasian 223 44.2% Responsible for grandchildren282 55.8% Not responsible for grandchildrenBlack or African American 16 58.1% Responsible for grandchildren12 41.9% Not responsible for grandchildrenWhite alone, not Hispanic / Latino 234 53.3% Responsible for grandchildren205 46.7% Not responsible for grandchildrenHispanic or Latino 113 100.0% Not responsible for grandchildren