Races in Bluffton, Indiana (IN) Detailed Stats
Data:
Races - White alone (%)
Races - White alone (% change since 2000)
Races - Black alone (%)
Races - Black alone (% change since 2000)
Races - American Indian alone (%)
Races - American Indian alone (% change since 2000)
Races - Asian alone (%)
Races - Asian alone (% change since 2000)
Races - Hispanic (%)
Races - Hispanic (% change since 2000)
Races - Native Hawaiian and Other Pacific Islander alone (%)
Races - Native Hawaiian and Other Pacific Islander alone (% change since 2000)
Races - Two or more races(%)
Races - Two or more races(% change since 2000)
Races - Other race alone (%)
Races - Other race alone (% change since 2000)
Racial diversity
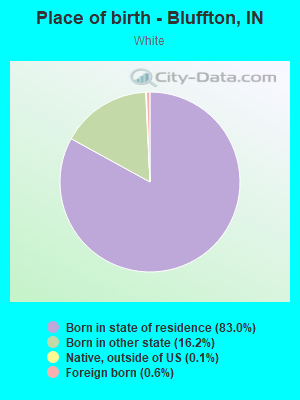
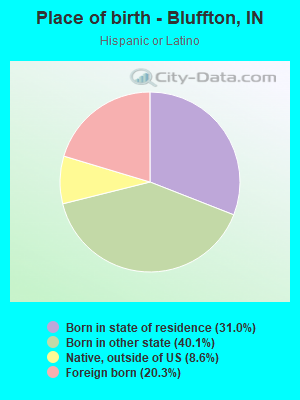
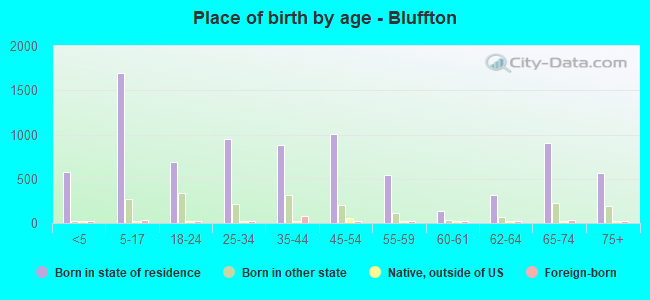
Place of birth - Born in state of residence (%)
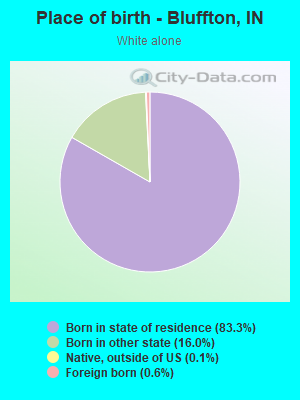
Place of birth - Born in state of residence (%) - White
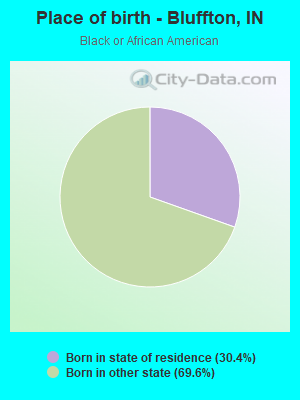
Place of birth - Born in state of residence (%) - Black or African American
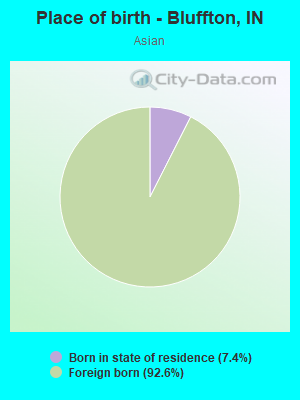
Place of birth - Born in state of residence (%) - Asian
Place of birth - Born in state of residence (%) - Hispanic or Latino
Place of birth - Born in state of residence (%) - American Indian and Alaska Native
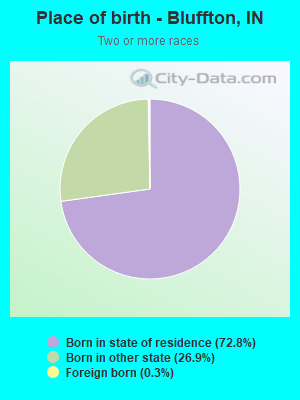
Place of birth - Born in state of residence (%) - Multirace
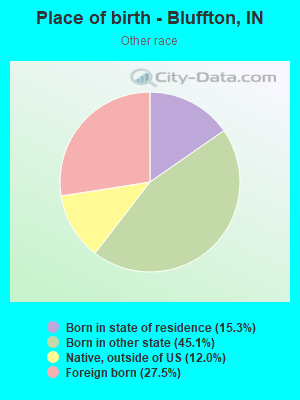
Place of birth - Born in state of residence (%) - Other Race
Place of birth - Born in other state (%)
Place of birth - Born in other state (%) - White
Place of birth - Born in other state (%) - Black or African American
Place of birth - Born in other state (%) - Asian
Place of birth - Born in other state (%) - Hispanic or Latino
Place of birth - Born in other state (%) - American Indian and Alaska Native
Place of birth - Born in other state (%) - Multirace
Place of birth - Born in other state (%) - Other Race
Place of birth - Native, outside of US (%)
Place of birth - Native, outside of US (%) - White
Place of birth - Native, outside of US (%) - Black or African American
Place of birth - Native, outside of US (%) - Asian
Place of birth - Native, outside of US (%) - Hispanic or Latino
Place of birth - Native, outside of US (%) - American Indian and Alaska Native
Place of birth - Native, outside of US (%) - Multirace
Place of birth - Native, outside of US (%) - Other Race
Place of birth - Foreign born (%)
Place of birth - Foreign born (%) - White
Place of birth - Foreign born (%) - Black or African American
Place of birth - Foreign born (%) - Asian
Place of birth - Foreign born (%) - Hispanic or Latino
Place of birth - Foreign born (%) - American Indian and Alaska Native
Place of birth - Foreign born (%) - Multirace
Place of birth - Foreign born (%) - Other Race
Residents speaking English at home (%)
Residents speaking English at home - Born in the United States (%)
Residents speaking English at home - Native, born elsewhere (%)
Residents speaking English at home - Foreign born (%)
Residents speaking Spanish at home (%)
Residents speaking Spanish at home - Born in the United States (%)
Residents speaking Spanish at home - Native, born elsewhere (%)
Residents speaking Spanish at home - Foreign born (%)
Residents speaking other language at home (%)
Residents speaking other language at home - Born in the United States (%)
Residents speaking other language at home - Native, born elsewhere (%)
Residents speaking other language at home - Foreign born (%)
Marital status - Never married (%)
Marital status - Now married (%)
Marital status - Separated (%)
Marital status - Widowed (%)
Marital status - Divorced (%)
Ancestries Reported - Arab (%)
Ancestries Reported - Czech (%)
Ancestries Reported - Danish (%)
Ancestries Reported - Dutch (%)
Ancestries Reported - English (%)
Ancestries Reported - French (%)
Ancestries Reported - French Canadian (%)
Ancestries Reported - German (%)
Ancestries Reported - Greek (%)
Ancestries Reported - Hungarian (%)
Ancestries Reported - Irish (%)
Ancestries Reported - Italian (%)
Ancestries Reported - Lithuanian (%)
Ancestries Reported - Norwegian (%)
Ancestries Reported - Polish (%)
Ancestries Reported - Portuguese (%)
Ancestries Reported - Russian (%)
Ancestries Reported - Scotch-Irish (%)
Ancestries Reported - Scottish (%)
Ancestries Reported - Slovak (%)
Ancestries Reported - Subsaharan African (%)
Ancestries Reported - Swedish (%)
Ancestries Reported - Swiss (%)
Ancestries Reported - Ukrainian (%)
Ancestries Reported - United States (%)
Ancestries Reported - Welsh (%)
Ancestries Reported - West Indian (%)
Ancestries Reported - Other (%)
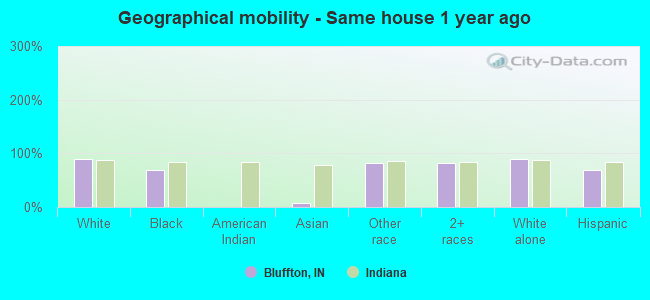
Geographical mobility - Same house 1 year ago (%)
Geographical mobility - Same house 1 year ago (%) - White
Geographical mobility - Same house 1 year ago (%) - Black or African American
Geographical mobility - Same house 1 year ago (%) - Asian
Geographical mobility - Same house 1 year ago (%) - Hispanic or Latino
Geographical mobility - Same house 1 year ago (%) - American Indian and Alaska Native
Geographical mobility - Same house 1 year ago (%) - Multirace
Geographical mobility - Same house 1 year ago (%) - Other Race
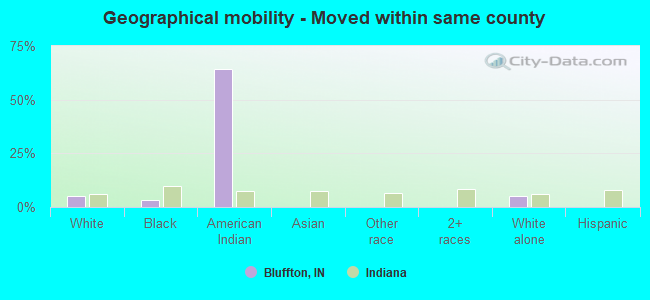
Geographical mobility - Moved within same county (%)
Geographical mobility - Moved within same county (%) - White
Geographical mobility - Moved within same county (%) - Black or African American
Geographical mobility - Moved within same county (%) - Asian
Geographical mobility - Moved within same county (%) - Hispanic or Latino
Geographical mobility - Moved within same county (%) - American Indian and Alaska Native
Geographical mobility - Moved within same county (%) - Multirace
Geographical mobility - Moved within same county (%) - Other Race
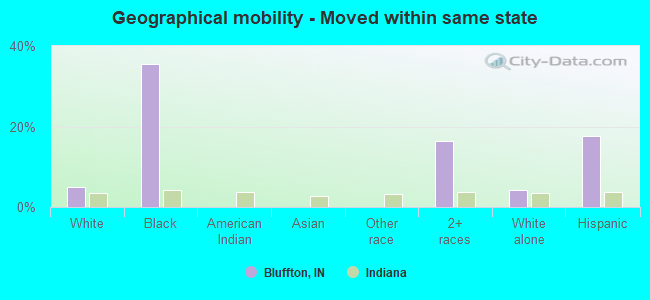
Geographical mobility - Moved from different county within same state (%)
Geographical mobility - Moved from different county within same state (%) - White
Geographical mobility - Moved from different county within same state (%) - Black or African American
Geographical mobility - Moved from different county within same state (%) - Asian
Geographical mobility - Moved from different county within same state (%) - Hispanic or Latino
Geographical mobility - Moved from different county within same state (%) - American Indian and Alaska Native
Geographical mobility - Moved from different county within same state (%) - Multirace
Geographical mobility - Moved from different county within same state (%) - Other Race
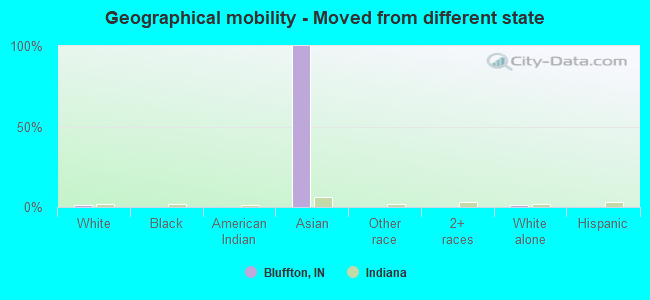
Geographical mobility - Moved from different state (%)
Geographical mobility - Moved from different state (%) - White
Geographical mobility - Moved from different state (%) - Black or African American
Geographical mobility - Moved from different state (%) - Asian
Geographical mobility - Moved from different state (%) - Hispanic or Latino
Geographical mobility - Moved from different state (%) - American Indian and Alaska Native
Geographical mobility - Moved from different state (%) - Multirace
Geographical mobility - Moved from different state (%) - Other Race
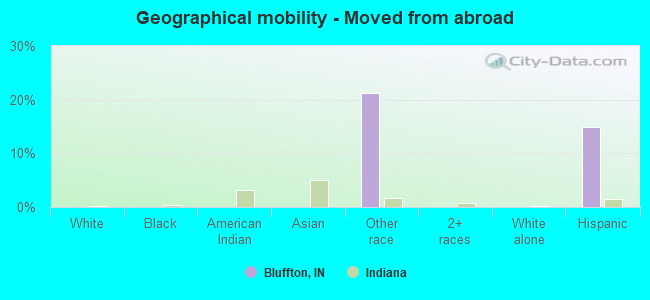
Geographical mobility - Moved from abroad (%)
Geographical mobility - Moved from abroad (%) - White
Geographical mobility - Moved from abroad (%) - Black or African American
Geographical mobility - Moved from abroad (%) - Asian
Geographical mobility - Moved from abroad (%) - Hispanic or Latino
Geographical mobility - Moved from abroad (%) - American Indian and Alaska Native
Geographical mobility - Moved from abroad (%) - Multirace
Geographical mobility - Moved from abroad (%) - Other Race
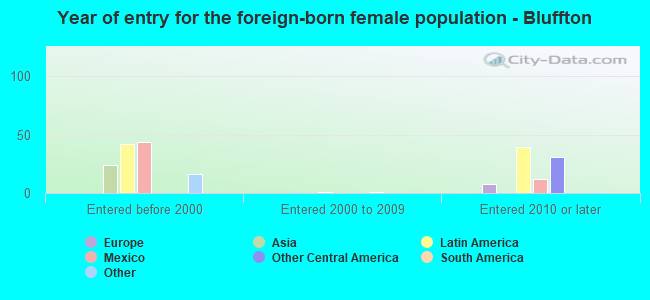
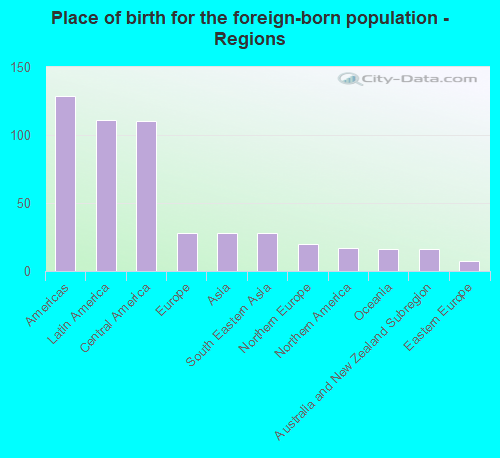
Place of birth for the foreign-born population - Ireland (%)
Place of birth for the foreign-born population - Denmark (%)
Place of birth for the foreign-born population - Norway (%)
Place of birth for the foreign-born population - Sweden (%)
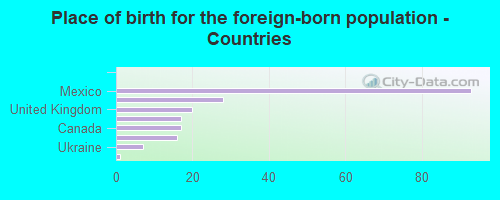
Place of birth for the foreign-born population - United Kingdom (%)
Place of birth for the foreign-born population - England (%)
Place of birth for the foreign-born population - Scotland (%)
Place of birth for the foreign-born population - Other Northern Europe (%)
Place of birth for the foreign-born population - Austria (%)
Place of birth for the foreign-born population - Belgium (%)
Place of birth for the foreign-born population - France (%)
Place of birth for the foreign-born population - Germany (%)
Place of birth for the foreign-born population - Netherlands (%)
Place of birth for the foreign-born population - Switzerland (%)
Place of birth for the foreign-born population - Other Western Europe (%)
Place of birth for the foreign-born population - Greece (%)
Place of birth for the foreign-born population - Italy (%)
Place of birth for the foreign-born population - Portugal (%)
Place of birth for the foreign-born population - Spain (%)
Place of birth for the foreign-born population - Other Southern Europe (%)
Place of birth for the foreign-born population - Albania (%)
Place of birth for the foreign-born population - Belarus (%)
Place of birth for the foreign-born population - Bosnia and Herzegovina (%)
Place of birth for the foreign-born population - Bulgaria (%)
Place of birth for the foreign-born population - Croatia (%)
Place of birth for the foreign-born population - Czechoslovakia (%)
Place of birth for the foreign-born population - Hungary (%)
Place of birth for the foreign-born population - Latvia (%)
Place of birth for the foreign-born population - Lithuania (%)
Place of birth for the foreign-born population - North Macedonia (Macedonia) (%)
Place of birth for the foreign-born population - Moldova (%)
Place of birth for the foreign-born population - Poland (%)
Place of birth for the foreign-born population - Romania (%)
Place of birth for the foreign-born population - Russia (%)
Place of birth for the foreign-born population - Serbia (%)
Place of birth for the foreign-born population - Ukraine (%)
Place of birth for the foreign-born population - Other Eastern Europe (%)
Place of birth for the foreign-born population - China (%)
Place of birth for the foreign-born population - Hong Kong (%)
Place of birth for the foreign-born population - Taiwan (%)
Place of birth for the foreign-born population - Japan (%)
Place of birth for the foreign-born population - Korea (%)
Place of birth for the foreign-born population - Other Eastern Asia (%)
Place of birth for the foreign-born population - Afghanistan (%)
Place of birth for the foreign-born population - Bangladesh (%)
Place of birth for the foreign-born population - India (%)
Place of birth for the foreign-born population - Iran (%)
Place of birth for the foreign-born population - Kazakhstan (%)
Place of birth for the foreign-born population - Nepal (%)
Place of birth for the foreign-born population - Pakistan (%)
Place of birth for the foreign-born population - Sri Lanka (%)
Place of birth for the foreign-born population - Uzbekistan (%)
Place of birth for the foreign-born population - Other South Central Asia (%)
Place of birth for the foreign-born population - Burma (%)
Place of birth for the foreign-born population - Cambodia (%)
Place of birth for the foreign-born population - Indonesia (%)
Place of birth for the foreign-born population - Laos (%)
Place of birth for the foreign-born population - Malaysia (%)
Place of birth for the foreign-born population - Philippines (%)
Place of birth for the foreign-born population - Singapore (%)
Place of birth for the foreign-born population - Thailand (%)
Place of birth for the foreign-born population - Vietnam (%)
Place of birth for the foreign-born population - Other South Eastern Asia (%)
Place of birth for the foreign-born population - Armenia (%)
Place of birth for the foreign-born population - Iraq (%)
Place of birth for the foreign-born population - Israel (%)
Place of birth for the foreign-born population - Jordan (%)
Place of birth for the foreign-born population - Kuwait (%)
Place of birth for the foreign-born population - Lebanon (%)
Place of birth for the foreign-born population - Saudi Arabia (%)
Place of birth for the foreign-born population - Syria (%)
Place of birth for the foreign-born population - Turkey (%)
Place of birth for the foreign-born population - Yemen (%)
Place of birth for the foreign-born population - Other Western Asia (%)
Place of birth for the foreign-born population - Eritrea (%)
Place of birth for the foreign-born population - Ethiopia (%)
Place of birth for the foreign-born population - Kenya (%)
Place of birth for the foreign-born population - Somalia (%)
Place of birth for the foreign-born population - Uganda (%)
Place of birth for the foreign-born population - Zimbabwe (%)
Place of birth for the foreign-born population - Other Eastern Africa (%)
Place of birth for the foreign-born population - Cameroon (%)
Place of birth for the foreign-born population - Congo (%)
Place of birth for the foreign-born population - Democratic Republic of Congo (Zaire) (%)
Place of birth for the foreign-born population - Other Middle Africa (%)
Place of birth for the foreign-born population - Egypt (%)
Place of birth for the foreign-born population - Morocco (%)
Place of birth for the foreign-born population - Sudan (%)
Place of birth for the foreign-born population - Other Northern Africa (%)
Place of birth for the foreign-born population - South Africa (%)
Place of birth for the foreign-born population - Other Southern Africa (%)
Place of birth for the foreign-born population - Cabo Verde (%)
Place of birth for the foreign-born population - Ghana (%)
Place of birth for the foreign-born population - Liberia (%)
Place of birth for the foreign-born population - Nigeria (%)
Place of birth for the foreign-born population - Senegal (%)
Place of birth for the foreign-born population - Sierra Leone (%)
Place of birth for the foreign-born population - Other Western Africa (%)
Place of birth for the foreign-born population - Australia (%)
Place of birth for the foreign-born population - New Zealand (%)
Place of birth for the foreign-born population - Fiji (%)
Place of birth for the foreign-born population - Micronesia (%)
Place of birth for the foreign-born population - Bahamas (%)
Place of birth for the foreign-born population - Barbados (%)
Place of birth for the foreign-born population - Cuba (%)
Place of birth for the foreign-born population - Dominica (%)
Place of birth for the foreign-born population - Dominican Republic (%)
Place of birth for the foreign-born population - Grenada (%)
Place of birth for the foreign-born population - Haiti (%)
Place of birth for the foreign-born population - Jamaica (%)
Place of birth for the foreign-born population - St. Vincent and the Grenadines (%)
Place of birth for the foreign-born population - Trinidad and Tobago (%)
Place of birth for the foreign-born population - West Indies (%)
Place of birth for the foreign-born population - Other Caribbean (%)
Place of birth for the foreign-born population - Belize (%)
Place of birth for the foreign-born population - Costa Rica (%)
Place of birth for the foreign-born population - El Salvador (%)
Place of birth for the foreign-born population - Guatemala (%)
Place of birth for the foreign-born population - Honduras (%)
Place of birth for the foreign-born population - Mexico (%)
Place of birth for the foreign-born population - Nicaragua (%)
Place of birth for the foreign-born population - Panama (%)
Place of birth for the foreign-born population - Other Central America (%)
Place of birth for the foreign-born population - Argentina (%)
Place of birth for the foreign-born population - Bolivia (%)
Place of birth for the foreign-born population - Brazil (%)
Place of birth for the foreign-born population - Chile (%)
Place of birth for the foreign-born population - Colombia (%)
Place of birth for the foreign-born population - Ecuador (%)
Place of birth for the foreign-born population - Guyana (%)
Place of birth for the foreign-born population - Peru (%)
Place of birth for the foreign-born population - Uruguay (%)
Place of birth for the foreign-born population - Venezuela (%)
Place of birth for the foreign-born population - Other South America (%)
Place of birth for the foreign-born population - Canada (%)
Place of birth for the foreign-born population - Other Northern America (%)
Place of birth for the foreign-born population - Other (%)
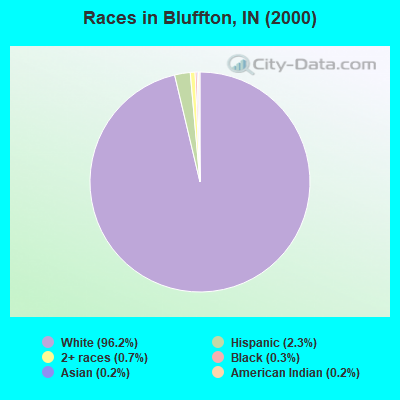
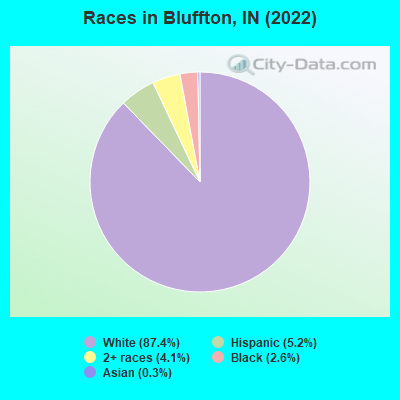
According to 2022 data, the most numerous races in Bluffton, IN are White alone (9,204 residents), Black alone (276 residents), and Hispanic (551 residents). 95.0% of Bluffton residents speak English at home. 1.9% of Bluffton, IN residents are foreign-born , which is 213.0% less than the foreign-born rate of 6.0% across the entire state of Indiana.
Race distribution in Bluffton
2000 2022
5,219,373 85.8% White alone 505,462 8.3% Black alone 214,536 3.5% Hispanic 61,115 1.0% Two or more races 58,424 1.0% Asian alone 13,654 0.2% American Indian alone 6,348 0.1% Other race alone 1,573 0.03% Native Hawaiian and Other
5,192,455 76.0% White alone 628,054 9.2% Black alone 534,528 7.8% Hispanic 263,242 3.9% Two or more races 172,880 2.5% Asian alone 33,467 0.5% Other race alone 5,866 0.09% American Indian alone 2,545 0.04% Native Hawaiian and Other
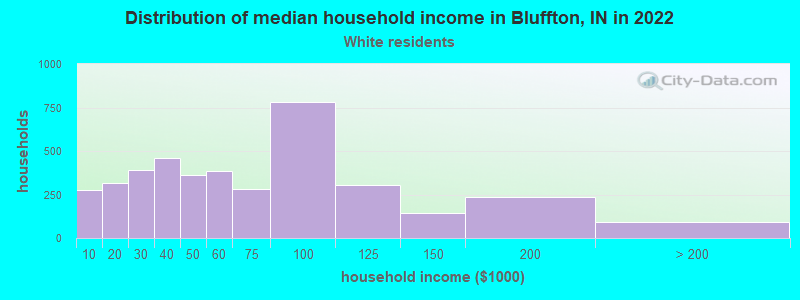
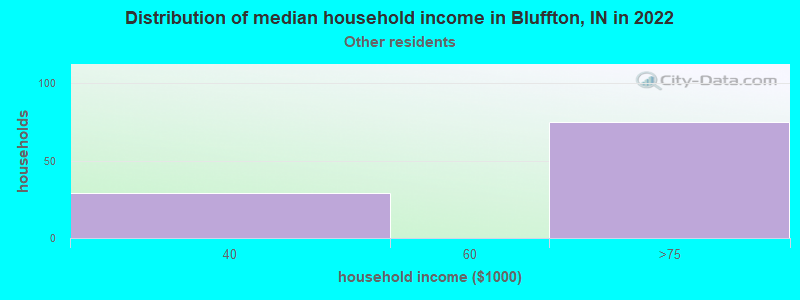
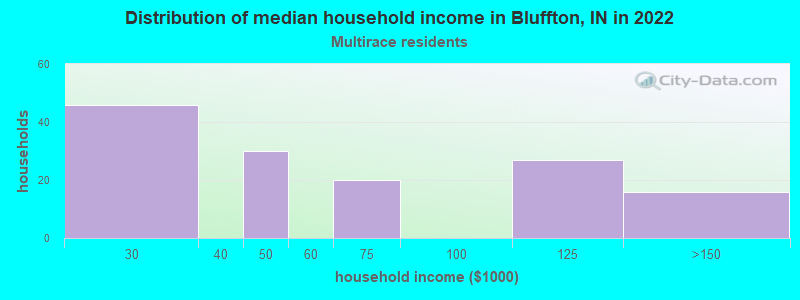
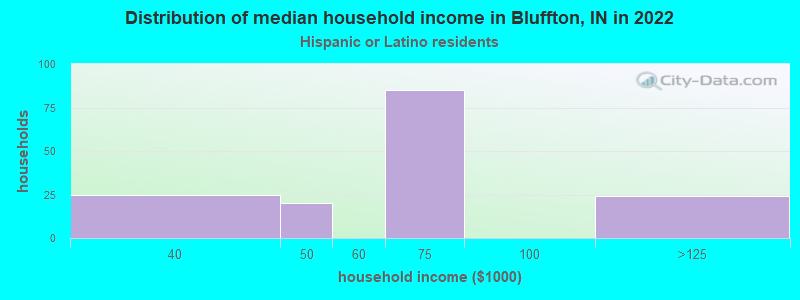
Income and house value in Bluffton Median household income in 2022 $55,830 White non-Hispanic householders$63,405 Some other race householders$64,930 Hispanic or Latino race householdersMedian 2022 house value $148,054 White Non-Hispanic householders$84,764 Black or African American householders$211,910 American Indian or Alaska Native householders$42,382 Some other race householders$51,800 Two or more races householders$122,437 Hispanic or Latino householders
Median age by race in Bluffton
42.3 Median age for White residents39.2 43.8 12.8 Median age for Black or African American residents8.7 17.2 -558,797,523.8 Median age for American Indian / Alaska Native residents-654,255,318.5 -491,600,353.2 -685,959,270.5 Median age for Asian residents-693,422,518.8 -670,756,645.5 -664,335,663.7 Median age for Native Hawaiian / Pacific Islander residents-644,025,156.6 -664,437,011.6 25.4 Median age for Other race residents40.2 25.6 23.1 Median age for Two or more races residents22.4 23.4 42.5 Median age for White alone residents40.1 43.7 24.3 Median age for Hispanic or Latino residents25.8 24.7
Owner/renter occupied households by race in Bluffton
House owners and renters - White residents 2,712 67.6% Owner occupied1,301 32.4% Renter occupiedHouse owners and renters - Black or African American residents 62 100.0% Renter occupiedHouse owners and renters - Asian residents 28 100.0% Owner occupiedHouse owners and renters - Other race residents 56 45.5% Owner occupied66 54.5% Renter occupiedHouse owners and renters - Two or more races residents 119 81.5% Owner occupied27 18.5% Renter occupiedHouse owners and renters - White alone residents 2,734 67.4% Owner occupied1,325 32.6% Renter occupiedHouse owners and renters - Hispanic or Latino residents 90 58.9% Owner occupied63 41.1% Renter occupied
Language usage in Bluffton
English speakers - Total 95.0% of residents of Bluffton speak English at home.
3.7% of residents speak Spanish at home 246 66.5% Speak English very well124 33.5% Speak English less than very well0.7% of residents speak other language at home 49 68.1% Speak English very well23 31.9% Speak English less than very well
English speakers - Born in the United States 91.2% of residents of Bluffton speak English at home.
8.9% of residents speak Spanish at home 170 97.1% Speak English very well5 2.9% Speak English less than very well
English speakers - Native, born elsewhere 19.4% of residents of Bluffton speak English at home.
77.4% of residents speak Spanish at home 48 100.0% Speak English less than very well
English speakers - Foreign-born 22.4% of residents of Bluffton speak English at home.
50.5% of residents speak Spanish at home 49 50.5% Speak English very well48 49.5% Speak English less than very well24.0% of residents speak other language at home 46 100.0% Speak English very well
White (Caucasian) - Speak only English Native:
99.1% (8,643)Foreign-born:
62.8% (36)
White (Caucasian) - Speak another language Native:
1.1% (94)Foreign-born:
42.9% (25)
Other race - Speak another language Native:
69.4% (162)Foreign-born:
97.7% (82)
Two or more races - Speak another language Native:
7.6% (37)Foreign-born:
99.0% (2)
White alone - Speak only English Native:
98.9% (8,557)Foreign-born:
68.6% (40)
White alone - Speak another language Native:
1.0% (89)Foreign-born:
27.7% (16)
Hispanic or Latino - Speak another language Native:
50.0% (205)Foreign-born:
99.5% (101)
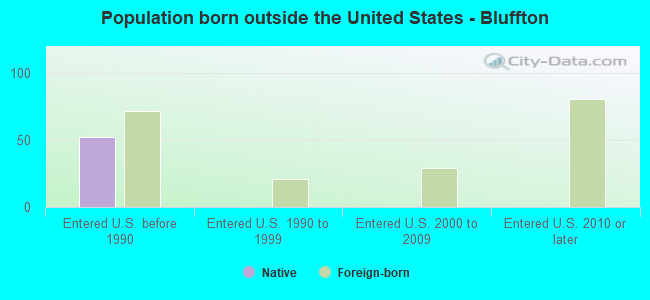
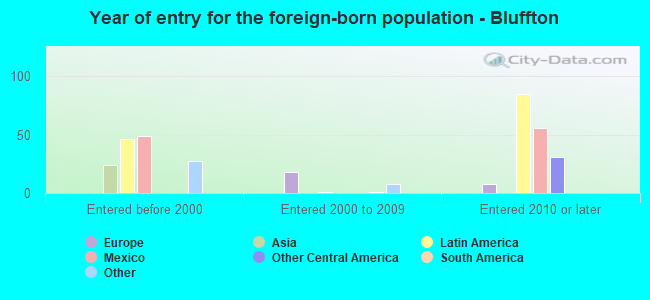
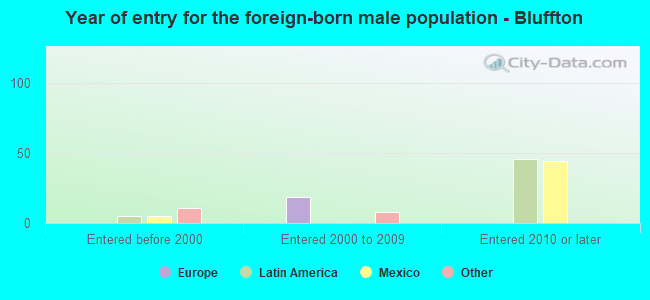
Foreign-born residents in Bluffton 202 residents are foreign born
This city:
1.9%Indiana:
5.6%
Marital status for residents in Bluffton Marital status - White (Caucasian) population 15 years and over
Males 33.5% Never married51.9% Now married0.6% Separated2.2% Widowed11.9% DivorcedFemales 21.2% Never married46.9% Now married2.6% Separated11.7% Widowed17.6% DivorcedWomen who gave birth in the past 12 months Now married:
70.3% (119)Unmarried:
29.7% (50)
Women who did not give birth in the past 12 months Now married:
48.7% (849)Unmarried:
51.3% (895)
Marital status - Black or African American population 15 years and over
Males 100.0% Never married0.0% Now married0.0% Separated0.0% Widowed0.0% DivorcedFemales 47.9% Never married0.0% Now married0.0% Separated0.0% Widowed52.1% DivorcedWomen who did not give birth in the past 12 months Now married:
0.0% (0)Unmarried:
100.0% (116)
Marital status - Asian population 15 years and over
Males 100.0% Never married0.0% Now married0.0% Separated0.0% Widowed0.0% DivorcedFemales 0.0% Never married0.0% Now married0.0% Separated0.0% Widowed100.0% DivorcedMarital status - Other race population 15 years and over
Males 14.9% Never married76.9% Now married0.0% Separated8.3% Widowed0.0% DivorcedFemales 18.5% Never married62.0% Now married0.0% Separated0.0% Widowed19.6% DivorcedWomen who gave birth in the past 12 months Now married:
100.0% (50)Unmarried:
0.0% (0)
Women who did not give birth in the past 12 months Now married:
31.4% (19)Unmarried:
68.6% (42)
Marital status - Two or more races population 15 years and over
Males 77.8% Never married14.2% Now married0.0% Separated0.0% Widowed8.0% DivorcedFemales 29.8% Never married67.5% Now married2.6% Separated0.0% Widowed0.0% DivorcedWomen who did not give birth in the past 12 months Now married:
64.6% (85)Unmarried:
35.4% (47)
Marital status - White alone, not Hispanic / Latino population 15 years and over
Males 32.0% Never married53.0% Now married0.6% Separated2.2% Widowed12.2% DivorcedFemales 20.9% Never married46.9% Now married2.6% Separated11.8% Widowed17.8% DivorcedWomen who gave birth in the past 12 months Now married:
70.3% (121)Unmarried:
29.7% (51)
Women who did not give birth in the past 12 months Now married:
48.6% (843)Unmarried:
51.4% (892)
Marital status - Hispanic or Latino population 15 years and over
Males 43.7% Never married51.9% Now married0.0% Separated4.3% Widowed0.0% DivorcedFemales 22.6% Never married63.9% Now married1.9% Separated0.0% Widowed11.6% DivorcedWomen who gave birth in the past 12 months Now married:
100.0% (44)Unmarried:
0.0% (0)
Women who did not give birth in the past 12 months Now married:
53.5% (65)Unmarried:
46.5% (57)
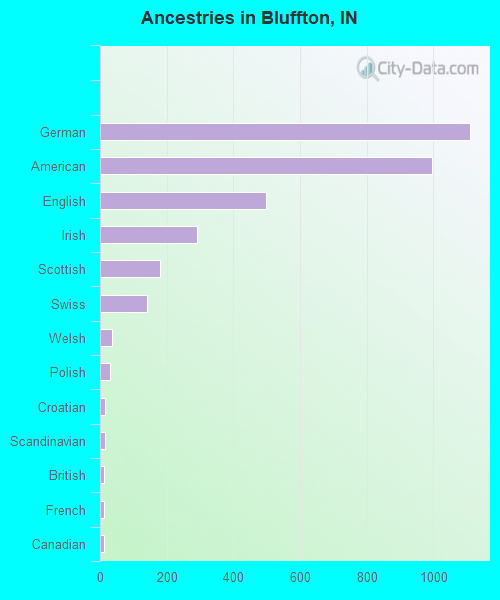
Ancestries in Bluffton
1,112 24.5% German998 22.0% American497 11.0% English290 6.4% Irish180 4.0% Scottish142 3.1% Swiss35 0.8% Welsh31 0.7% Polish16 0.4% Croatian14 0.3% Scandinavian13 0.3% British12 0.3% French11 0.2% Canadian9 0.2% Greek9 0.2% Slovak8 0.2% Czechoslovakian8 0.2% French Canadian7 0.2% Hungarian7 0.2% Italian7 0.2% Northern European7 0.2% Ukrainian6 0.1% Scotch-Irish5 0.1% European
Children Nativity (place of birth) in Bluffton
Children under 6 years - Living with two parents Both parents native 418 100.0% NativeBoth parents foreign-born 19 100.0% Foreign-bornOne native, one foreign-born parent 26 100.0% NativeChildren under 6 years - Living with one parent Native parent 297 100.0% Native
Children 6 to 17 years - Living with two parents Both parents native 1,233 100.0% NativeBoth parents foreign-born 13 100.0% Foreign-bornOne native, one foreign-born parent 71 100.0% NativeChildren 6 to 17 years - Living with one parent Native parent 383 100.0% Native
Grandparents responsible for own grandchildren in Bluffton
Grandparents (30 to 59 years) White / Caucasian 72 59.4% Responsible for grandchildren49 40.6% Not responsible for grandchildrenTwo or more races 23 100.0% Responsible for grandchildrenWhite alone, not Hispanic / Latino 67 56.2% Responsible for grandchildren52 43.8% Not responsible for grandchildrenHispanic or Latino 10 100.0% Responsible for grandchildrenGrandparents (60 years and over) White / Caucasian 37 89.7% Responsible for grandchildren4 10.3% Not responsible for grandchildrenWhite alone, not Hispanic / Latino 38 89.7% Responsible for grandchildren4 10.3% Not responsible for grandchildren