Races in Bohemia, New York (NY) Detailed Stats
Data:
Races - White alone (%)
Races - White alone (% change since 2000)
Races - Black alone (%)
Races - Black alone (% change since 2000)
Races - American Indian alone (%)
Races - American Indian alone (% change since 2000)
Races - Asian alone (%)
Races - Asian alone (% change since 2000)
Races - Hispanic (%)
Races - Hispanic (% change since 2000)
Races - Native Hawaiian and Other Pacific Islander alone (%)
Races - Native Hawaiian and Other Pacific Islander alone (% change since 2000)
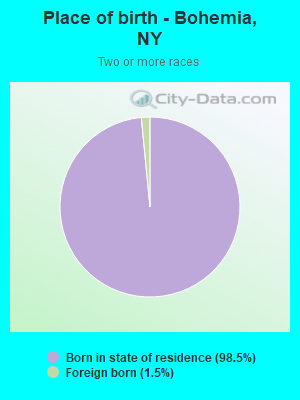
Races - Two or more races(%)
Races - Two or more races(% change since 2000)
Races - Other race alone (%)
Races - Other race alone (% change since 2000)
Racial diversity
Place of birth - Born in state of residence (%)
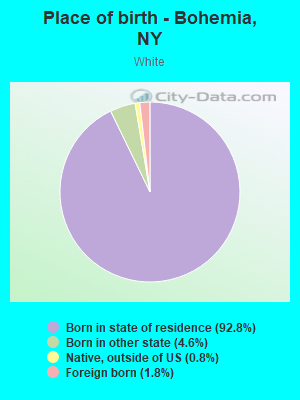
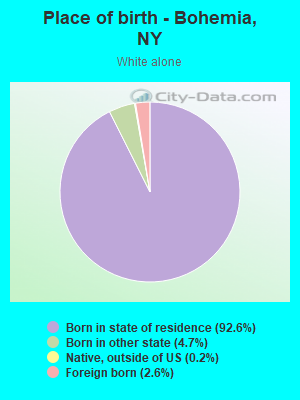
Place of birth - Born in state of residence (%) - White
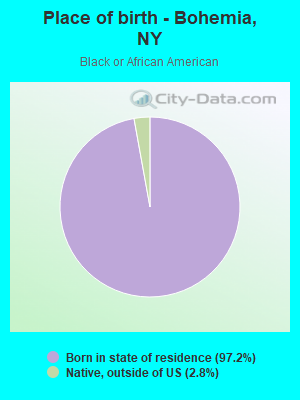
Place of birth - Born in state of residence (%) - Black or African American
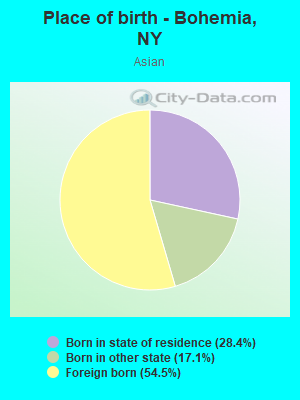
Place of birth - Born in state of residence (%) - Asian
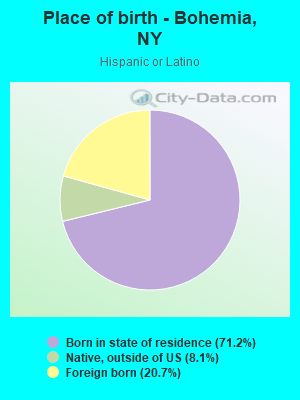
Place of birth - Born in state of residence (%) - Hispanic or Latino
Place of birth - Born in state of residence (%) - American Indian and Alaska Native
Place of birth - Born in state of residence (%) - Multirace
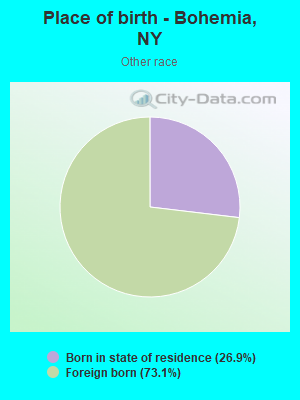
Place of birth - Born in state of residence (%) - Other Race
Place of birth - Born in other state (%)
Place of birth - Born in other state (%) - White
Place of birth - Born in other state (%) - Black or African American
Place of birth - Born in other state (%) - Asian
Place of birth - Born in other state (%) - Hispanic or Latino
Place of birth - Born in other state (%) - American Indian and Alaska Native
Place of birth - Born in other state (%) - Multirace
Place of birth - Born in other state (%) - Other Race
Place of birth - Native, outside of US (%)
Place of birth - Native, outside of US (%) - White
Place of birth - Native, outside of US (%) - Black or African American
Place of birth - Native, outside of US (%) - Asian
Place of birth - Native, outside of US (%) - Hispanic or Latino
Place of birth - Native, outside of US (%) - American Indian and Alaska Native
Place of birth - Native, outside of US (%) - Multirace
Place of birth - Native, outside of US (%) - Other Race
Place of birth - Foreign born (%)
Place of birth - Foreign born (%) - White
Place of birth - Foreign born (%) - Black or African American
Place of birth - Foreign born (%) - Asian
Place of birth - Foreign born (%) - Hispanic or Latino
Place of birth - Foreign born (%) - American Indian and Alaska Native
Place of birth - Foreign born (%) - Multirace
Place of birth - Foreign born (%) - Other Race
Residents speaking English at home (%)
Residents speaking English at home - Born in the United States (%)
Residents speaking English at home - Native, born elsewhere (%)
Residents speaking English at home - Foreign born (%)
Residents speaking Spanish at home (%)
Residents speaking Spanish at home - Born in the United States (%)
Residents speaking Spanish at home - Native, born elsewhere (%)
Residents speaking Spanish at home - Foreign born (%)
Residents speaking other language at home (%)
Residents speaking other language at home - Born in the United States (%)
Residents speaking other language at home - Native, born elsewhere (%)
Residents speaking other language at home - Foreign born (%)
Marital status - Never married (%)
Marital status - Now married (%)
Marital status - Separated (%)
Marital status - Widowed (%)
Marital status - Divorced (%)
Ancestries Reported - Arab (%)
Ancestries Reported - Czech (%)
Ancestries Reported - Danish (%)
Ancestries Reported - Dutch (%)
Ancestries Reported - English (%)
Ancestries Reported - French (%)
Ancestries Reported - French Canadian (%)
Ancestries Reported - German (%)
Ancestries Reported - Greek (%)
Ancestries Reported - Hungarian (%)
Ancestries Reported - Irish (%)
Ancestries Reported - Italian (%)
Ancestries Reported - Lithuanian (%)
Ancestries Reported - Norwegian (%)
Ancestries Reported - Polish (%)
Ancestries Reported - Portuguese (%)
Ancestries Reported - Russian (%)
Ancestries Reported - Scotch-Irish (%)
Ancestries Reported - Scottish (%)
Ancestries Reported - Slovak (%)
Ancestries Reported - Subsaharan African (%)
Ancestries Reported - Swedish (%)
Ancestries Reported - Swiss (%)
Ancestries Reported - Ukrainian (%)
Ancestries Reported - United States (%)
Ancestries Reported - Welsh (%)
Ancestries Reported - West Indian (%)
Ancestries Reported - Other (%)
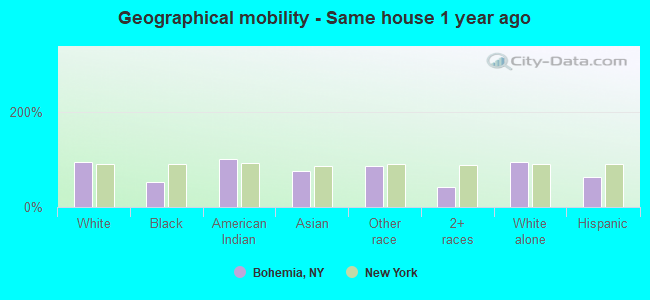
Geographical mobility - Same house 1 year ago (%)
Geographical mobility - Same house 1 year ago (%) - White
Geographical mobility - Same house 1 year ago (%) - Black or African American
Geographical mobility - Same house 1 year ago (%) - Asian
Geographical mobility - Same house 1 year ago (%) - Hispanic or Latino
Geographical mobility - Same house 1 year ago (%) - American Indian and Alaska Native
Geographical mobility - Same house 1 year ago (%) - Multirace
Geographical mobility - Same house 1 year ago (%) - Other Race
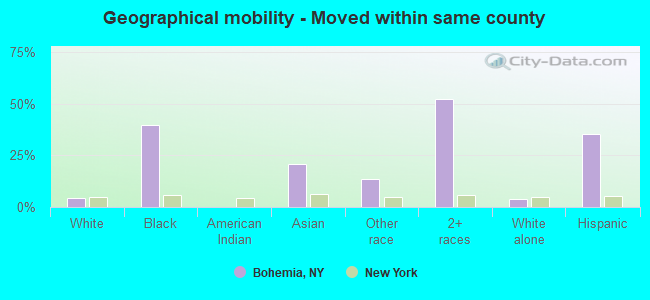
Geographical mobility - Moved within same county (%)
Geographical mobility - Moved within same county (%) - White
Geographical mobility - Moved within same county (%) - Black or African American
Geographical mobility - Moved within same county (%) - Asian
Geographical mobility - Moved within same county (%) - Hispanic or Latino
Geographical mobility - Moved within same county (%) - American Indian and Alaska Native
Geographical mobility - Moved within same county (%) - Multirace
Geographical mobility - Moved within same county (%) - Other Race
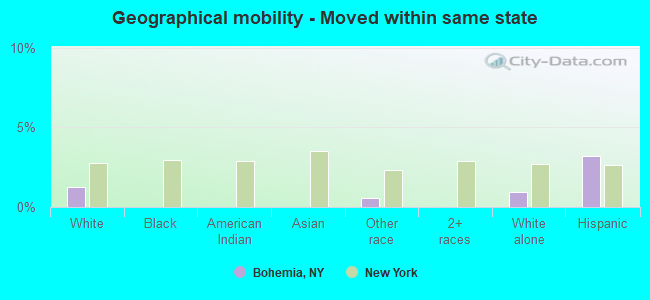
Geographical mobility - Moved from different county within same state (%)
Geographical mobility - Moved from different county within same state (%) - White
Geographical mobility - Moved from different county within same state (%) - Black or African American
Geographical mobility - Moved from different county within same state (%) - Asian
Geographical mobility - Moved from different county within same state (%) - Hispanic or Latino
Geographical mobility - Moved from different county within same state (%) - American Indian and Alaska Native
Geographical mobility - Moved from different county within same state (%) - Multirace
Geographical mobility - Moved from different county within same state (%) - Other Race
Geographical mobility - Moved from different state (%)
Geographical mobility - Moved from different state (%) - White
Geographical mobility - Moved from different state (%) - Black or African American
Geographical mobility - Moved from different state (%) - Asian
Geographical mobility - Moved from different state (%) - Hispanic or Latino
Geographical mobility - Moved from different state (%) - American Indian and Alaska Native
Geographical mobility - Moved from different state (%) - Multirace
Geographical mobility - Moved from different state (%) - Other Race
Geographical mobility - Moved from abroad (%)
Geographical mobility - Moved from abroad (%) - White
Geographical mobility - Moved from abroad (%) - Black or African American
Geographical mobility - Moved from abroad (%) - Asian
Geographical mobility - Moved from abroad (%) - Hispanic or Latino
Geographical mobility - Moved from abroad (%) - American Indian and Alaska Native
Geographical mobility - Moved from abroad (%) - Multirace
Geographical mobility - Moved from abroad (%) - Other Race
Place of birth for the foreign-born population - Ireland (%)
Place of birth for the foreign-born population - Denmark (%)
Place of birth for the foreign-born population - Norway (%)
Place of birth for the foreign-born population - Sweden (%)
Place of birth for the foreign-born population - United Kingdom (%)
Place of birth for the foreign-born population - England (%)
Place of birth for the foreign-born population - Scotland (%)
Place of birth for the foreign-born population - Other Northern Europe (%)
Place of birth for the foreign-born population - Austria (%)
Place of birth for the foreign-born population - Belgium (%)
Place of birth for the foreign-born population - France (%)
Place of birth for the foreign-born population - Germany (%)
Place of birth for the foreign-born population - Netherlands (%)
Place of birth for the foreign-born population - Switzerland (%)
Place of birth for the foreign-born population - Other Western Europe (%)
Place of birth for the foreign-born population - Greece (%)
Place of birth for the foreign-born population - Italy (%)
Place of birth for the foreign-born population - Portugal (%)
Place of birth for the foreign-born population - Spain (%)
Place of birth for the foreign-born population - Other Southern Europe (%)
Place of birth for the foreign-born population - Albania (%)
Place of birth for the foreign-born population - Belarus (%)
Place of birth for the foreign-born population - Bosnia and Herzegovina (%)
Place of birth for the foreign-born population - Bulgaria (%)
Place of birth for the foreign-born population - Croatia (%)
Place of birth for the foreign-born population - Czechoslovakia (%)
Place of birth for the foreign-born population - Hungary (%)
Place of birth for the foreign-born population - Latvia (%)
Place of birth for the foreign-born population - Lithuania (%)
Place of birth for the foreign-born population - North Macedonia (Macedonia) (%)
Place of birth for the foreign-born population - Moldova (%)
Place of birth for the foreign-born population - Poland (%)
Place of birth for the foreign-born population - Romania (%)
Place of birth for the foreign-born population - Russia (%)
Place of birth for the foreign-born population - Serbia (%)
Place of birth for the foreign-born population - Ukraine (%)
Place of birth for the foreign-born population - Other Eastern Europe (%)
Place of birth for the foreign-born population - China (%)
Place of birth for the foreign-born population - Hong Kong (%)
Place of birth for the foreign-born population - Taiwan (%)
Place of birth for the foreign-born population - Japan (%)
Place of birth for the foreign-born population - Korea (%)
Place of birth for the foreign-born population - Other Eastern Asia (%)
Place of birth for the foreign-born population - Afghanistan (%)
Place of birth for the foreign-born population - Bangladesh (%)
Place of birth for the foreign-born population - India (%)
Place of birth for the foreign-born population - Iran (%)
Place of birth for the foreign-born population - Kazakhstan (%)
Place of birth for the foreign-born population - Nepal (%)
Place of birth for the foreign-born population - Pakistan (%)
Place of birth for the foreign-born population - Sri Lanka (%)
Place of birth for the foreign-born population - Uzbekistan (%)
Place of birth for the foreign-born population - Other South Central Asia (%)
Place of birth for the foreign-born population - Burma (%)
Place of birth for the foreign-born population - Cambodia (%)
Place of birth for the foreign-born population - Indonesia (%)
Place of birth for the foreign-born population - Laos (%)
Place of birth for the foreign-born population - Malaysia (%)
Place of birth for the foreign-born population - Philippines (%)
Place of birth for the foreign-born population - Singapore (%)
Place of birth for the foreign-born population - Thailand (%)
Place of birth for the foreign-born population - Vietnam (%)
Place of birth for the foreign-born population - Other South Eastern Asia (%)
Place of birth for the foreign-born population - Armenia (%)
Place of birth for the foreign-born population - Iraq (%)
Place of birth for the foreign-born population - Israel (%)
Place of birth for the foreign-born population - Jordan (%)
Place of birth for the foreign-born population - Kuwait (%)
Place of birth for the foreign-born population - Lebanon (%)
Place of birth for the foreign-born population - Saudi Arabia (%)
Place of birth for the foreign-born population - Syria (%)
Place of birth for the foreign-born population - Turkey (%)
Place of birth for the foreign-born population - Yemen (%)
Place of birth for the foreign-born population - Other Western Asia (%)
Place of birth for the foreign-born population - Eritrea (%)
Place of birth for the foreign-born population - Ethiopia (%)
Place of birth for the foreign-born population - Kenya (%)
Place of birth for the foreign-born population - Somalia (%)
Place of birth for the foreign-born population - Uganda (%)
Place of birth for the foreign-born population - Zimbabwe (%)
Place of birth for the foreign-born population - Other Eastern Africa (%)
Place of birth for the foreign-born population - Cameroon (%)
Place of birth for the foreign-born population - Congo (%)
Place of birth for the foreign-born population - Democratic Republic of Congo (Zaire) (%)
Place of birth for the foreign-born population - Other Middle Africa (%)
Place of birth for the foreign-born population - Egypt (%)
Place of birth for the foreign-born population - Morocco (%)
Place of birth for the foreign-born population - Sudan (%)
Place of birth for the foreign-born population - Other Northern Africa (%)
Place of birth for the foreign-born population - South Africa (%)
Place of birth for the foreign-born population - Other Southern Africa (%)
Place of birth for the foreign-born population - Cabo Verde (%)
Place of birth for the foreign-born population - Ghana (%)
Place of birth for the foreign-born population - Liberia (%)
Place of birth for the foreign-born population - Nigeria (%)
Place of birth for the foreign-born population - Senegal (%)
Place of birth for the foreign-born population - Sierra Leone (%)
Place of birth for the foreign-born population - Other Western Africa (%)
Place of birth for the foreign-born population - Australia (%)
Place of birth for the foreign-born population - New Zealand (%)
Place of birth for the foreign-born population - Fiji (%)
Place of birth for the foreign-born population - Micronesia (%)
Place of birth for the foreign-born population - Bahamas (%)
Place of birth for the foreign-born population - Barbados (%)
Place of birth for the foreign-born population - Cuba (%)
Place of birth for the foreign-born population - Dominica (%)
Place of birth for the foreign-born population - Dominican Republic (%)
Place of birth for the foreign-born population - Grenada (%)
Place of birth for the foreign-born population - Haiti (%)
Place of birth for the foreign-born population - Jamaica (%)
Place of birth for the foreign-born population - St. Vincent and the Grenadines (%)
Place of birth for the foreign-born population - Trinidad and Tobago (%)
Place of birth for the foreign-born population - West Indies (%)
Place of birth for the foreign-born population - Other Caribbean (%)
Place of birth for the foreign-born population - Belize (%)
Place of birth for the foreign-born population - Costa Rica (%)
Place of birth for the foreign-born population - El Salvador (%)
Place of birth for the foreign-born population - Guatemala (%)
Place of birth for the foreign-born population - Honduras (%)
Place of birth for the foreign-born population - Mexico (%)
Place of birth for the foreign-born population - Nicaragua (%)
Place of birth for the foreign-born population - Panama (%)
Place of birth for the foreign-born population - Other Central America (%)
Place of birth for the foreign-born population - Argentina (%)
Place of birth for the foreign-born population - Bolivia (%)
Place of birth for the foreign-born population - Brazil (%)
Place of birth for the foreign-born population - Chile (%)
Place of birth for the foreign-born population - Colombia (%)
Place of birth for the foreign-born population - Ecuador (%)
Place of birth for the foreign-born population - Guyana (%)
Place of birth for the foreign-born population - Peru (%)
Place of birth for the foreign-born population - Uruguay (%)
Place of birth for the foreign-born population - Venezuela (%)
Place of birth for the foreign-born population - Other South America (%)
Place of birth for the foreign-born population - Canada (%)
Place of birth for the foreign-born population - Other Northern America (%)
Place of birth for the foreign-born population - Other (%)
Latest news about races in Bohemia, NY collected exclusively by city-data.com from local newspapers, TV, and radio stations
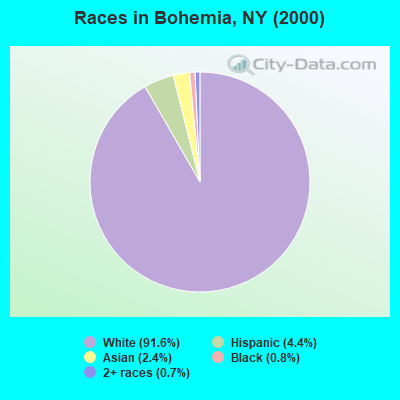
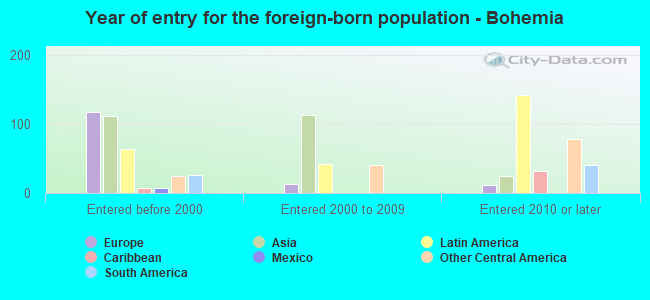
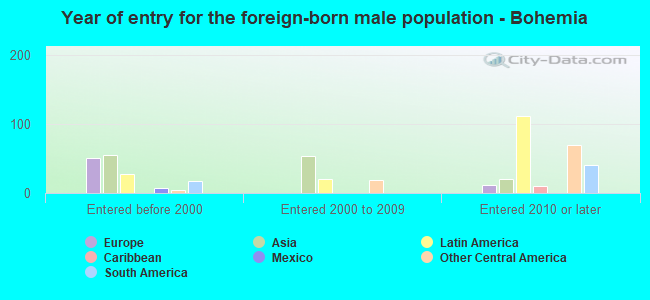
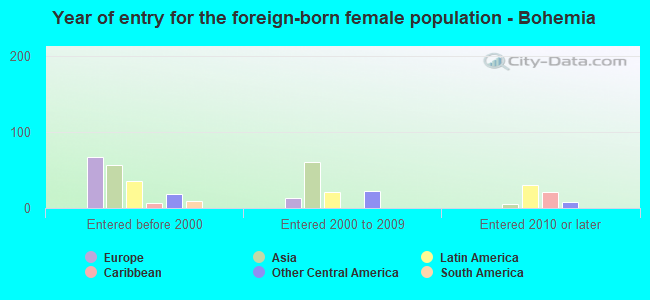
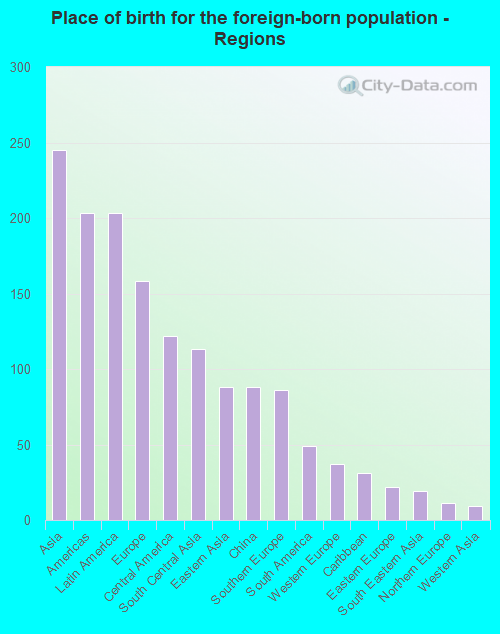
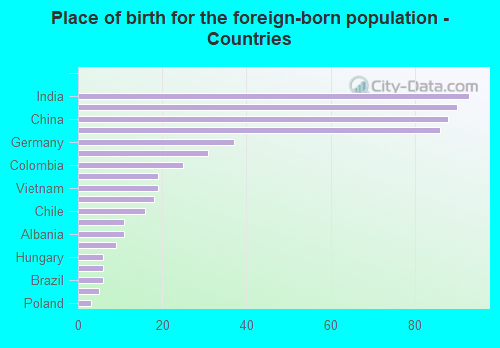
According to 2022 data, the most numerous races in Bohemia, NY are White alone (7,511 residents), Hispanic (1,092 residents), and Black alone (226 residents). 86.9% of Bohemia residents speak English at home. 6.4% of Bohemia, NY residents are foreign-born (2.6% born in Asia, 2.2% born in Latin America, 1.7% born in Europe), which is 245.8% less than the foreign-born rate of 22.0% across the entire state of New York.
Race distribution in Bohemia
2000 2022
11,760,981 62.0% White alone 2,867,583 15.1% Hispanic 2,812,623 14.8% Black alone 1,035,926 5.5% Asian alone 366,116 1.9% Two or more races 75,499 0.4% Other race alone 52,499 0.3% American Indian alone 5,230 0.03% Native Hawaiian and Other
10,408,933 52.9% White alone 3,867,299 19.7% Hispanic 2,633,840 13.4% Black alone 1,776,286 9.0% Asian alone 732,670 3.7% Two or more races 216,110 1.1% Other race alone 35,082 0.2% American Indian alone 6,931 0.04% Native Hawaiian and Other
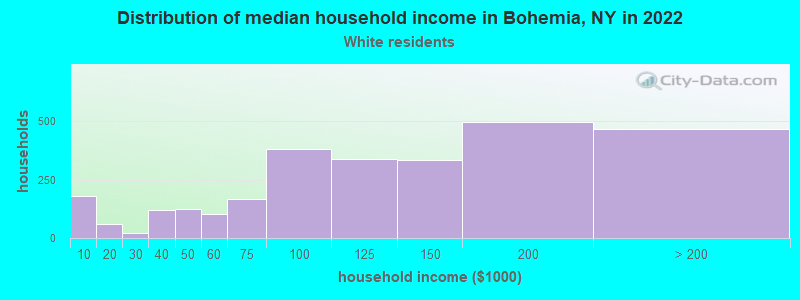
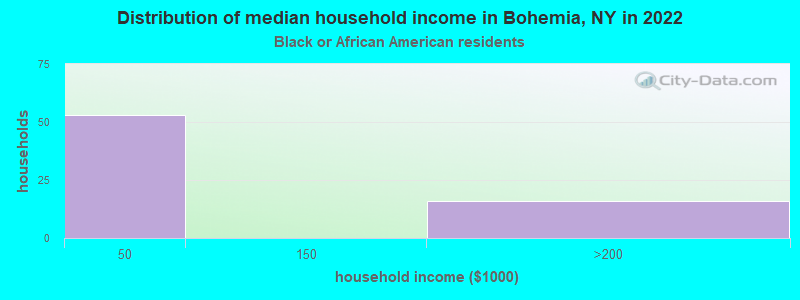
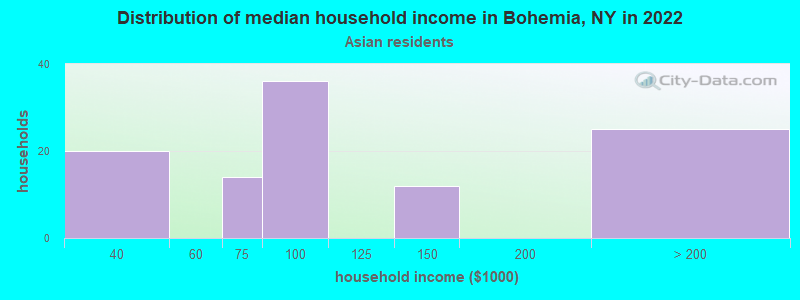
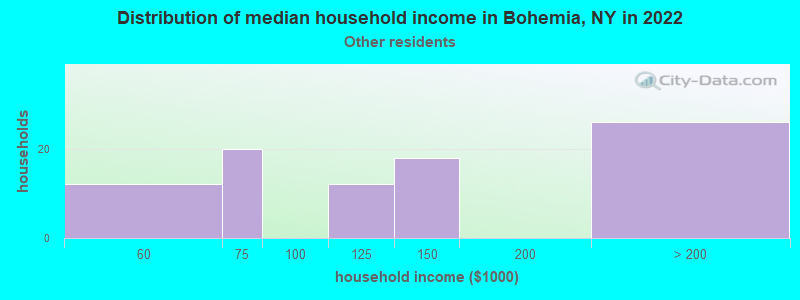
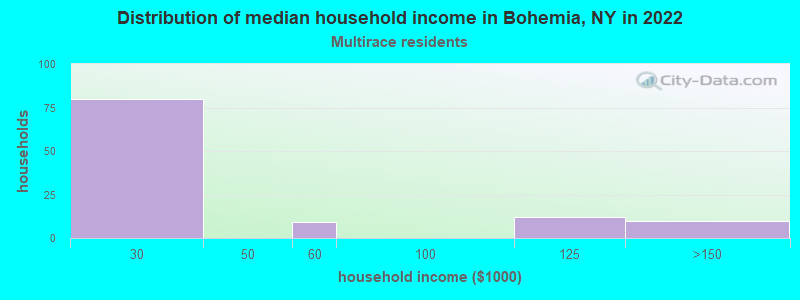
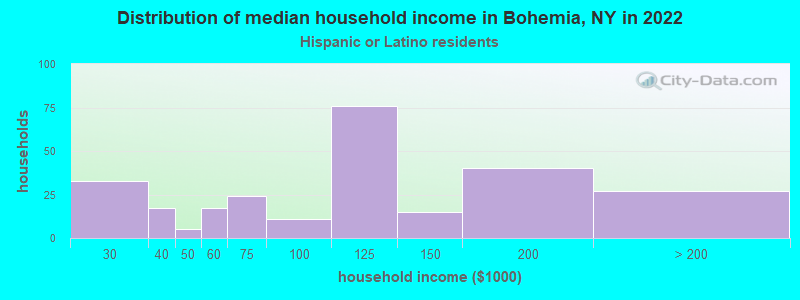
Income and house value in Bohemia Median household income in 2022 $121,272 White non-Hispanic householders$91,127 Asian householders$143,930 Some other race householders$102,066 Hispanic or Latino race householdersMedian 2022 house value $532,277 White Non-Hispanic householders $536,798 Asian householders$529,735 Two or more races householders$423,788 Hispanic or Latino householders
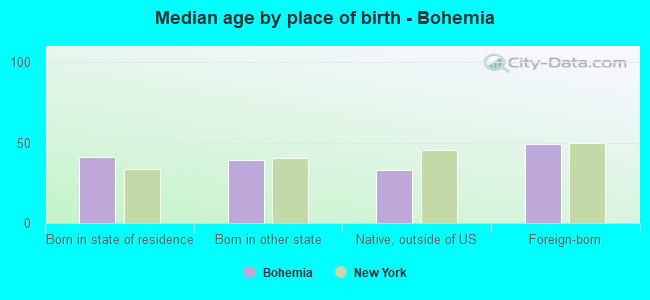
Median age by race in Bohemia
46.9 Median age for White residents45.0 49.3 31.5 Median age for Black or African American residents54.7 26.0 -748,832,865.7 Median age for American Indian / Alaska Native residents-807,017,543.1 -513,692,161.9 39.5 Median age for Asian residents36.8 46.9 -742,816,091.2 Median age for Native Hawaiian / Pacific Islander residents-831,187,409.8 -771,300,447.7 37.9 Median age for Other race residents25.8 48.0 6.7 Median age for Two or more races residents4.6 29.4 48.1 Median age for White alone residents46.4 49.7 24.1 Median age for Hispanic or Latino residents24.7 23.8
Owner/renter occupied households by race in Bohemia
House owners and renters - White residents 2,377 85.1% Owner occupied418 14.9% Renter occupiedHouse owners and renters - Black or African American residents 4 6.5% Owner occupied57 93.5% Renter occupiedHouse owners and renters - Asian residents 108 92.6% Owner occupied9 7.4% Renter occupiedHouse owners and renters - Other race residents 51 52.6% Owner occupied46 47.4% Renter occupiedHouse owners and renters - Two or more races residents 30 25.5% Owner occupied87 74.5% Renter occupiedHouse owners and renters - White alone residents 2,383 85.9% Owner occupied392 14.1% Renter occupiedHouse owners and renters - Hispanic or Latino residents 124 43.0% Owner occupied164 57.0% Renter occupied
Language usage in Bohemia
English speakers - Total 86.9% of residents of Bohemia speak English at home.
5.7% of residents speak Spanish at home 244 47.8% Speak English very well266 52.2% Speak English less than very well6.4% of residents speak other language at home 355 62.3% Speak English very well215 37.7% Speak English less than very well
English speakers - Born in the United States 92.7% of residents of Bohemia speak English at home.
8.3% of residents speak other language at home 35 100.0% Speak English very well
English speakers - Native, born elsewhere 17.4% of residents of Bohemia speak English at home.
67.0% of residents speak Spanish at home 73 100.0% Speak English less than very well
English speakers - Foreign-born 20.8% of residents of Bohemia speak English at home.
22.6% of residents speak Spanish at home 62 41.6% Speak English very well87 58.4% Speak English less than very well53.9% of residents speak other language at home 136 38.3% Speak English very well219 61.7% Speak English less than very well
White (Caucasian) - Speak only English Native:
98.1% (6,894)Foreign-born:
42.5% (57)
White (Caucasian) - Speak another language Native:
2.8% (194)Foreign-born:
61.4% (83)
Asian - Speak only English Native:
34.2% (63)Foreign-born:
2.9% (6)
Asian - Speak another language Native:
67.9% (125)Foreign-born:
100.0% (214)
Other race - Speak only English Native:
41.5% (38)Foreign-born:
17.3% (44)
Other race - Speak another language Native:
58.7% (53)Foreign-born:
80.5% (205)
Two or more races - Speak only English Native:
61.4% (237)Foreign-born:
89.7% (9)
White alone - Speak only English Native:
98.1% (6,804)Foreign-born:
32.6% (63)
White alone - Speak another language Native:
1.8% (124)Foreign-born:
67.4% (130)
Hispanic or Latino - Speak only English Native:
54.0% (347)Foreign-born:
28.5% (63)
Hispanic or Latino - Speak another language Native:
46.3% (297)Foreign-born:
69.3% (153)
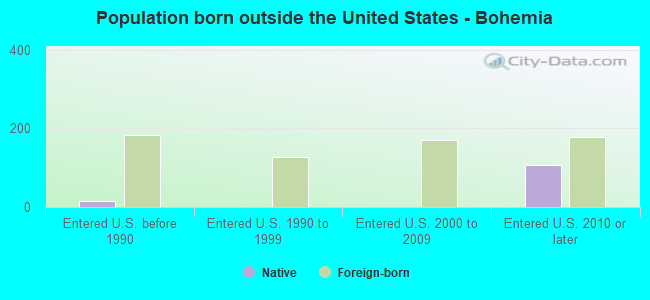
Foreign-born residents in Bohemia 607 residents are foreign born (2.6% Asia , 2.2% Latin America , 1.7% Europe ).
This city:
6.4%New York:
22.6%
Marital status for residents in Bohemia Marital status - White (Caucasian) population 15 years and over
Males 32.7% Never married52.6% Now married2.1% Separated2.7% Widowed9.9% DivorcedFemales 24.5% Never married54.6% Now married2.7% Separated9.9% Widowed8.3% DivorcedWomen who gave birth in the past 12 months Now married:
100.0% (38)Unmarried:
0.0% (0)
Women who did not give birth in the past 12 months Now married:
51.8% (740)Unmarried:
48.2% (689)
Marital status - Black or African American population 15 years and over
Males 60.7% Never married14.3% Now married0.0% Separated0.0% Widowed25.0% DivorcedFemales 87.6% Never married4.8% Now married0.0% Separated0.0% Widowed7.6% DivorcedWomen who did not give birth in the past 12 months Now married:
0.0% (0)Unmarried:
100.0% (60)
Marital status - Asian population 15 years and over
Males 47.0% Never married53.0% Now married0.0% Separated0.0% Widowed0.0% DivorcedFemales 20.1% Never married57.5% Now married0.0% Separated5.7% Widowed16.7% DivorcedWomen who did not give birth in the past 12 months Now married:
68.2% (78)Unmarried:
31.8% (36)
Marital status - Other race population 15 years and over
Males 42.4% Never married52.0% Now married0.0% Separated0.0% Widowed5.6% DivorcedFemales 34.0% Never married25.5% Now married1.1% Separated22.3% Widowed17.0% DivorcedWomen who did not give birth in the past 12 months Now married:
11.1% (9)Unmarried:
88.9% (70)
Marital status - Two or more races population 15 years and over
Males 0.0% Never married100.0% Now married0.0% Separated0.0% Widowed0.0% DivorcedFemales 37.7% Never married62.3% Now married0.0% Separated0.0% Widowed0.0% DivorcedWomen who did not give birth in the past 12 months Now married:
62.3% (145)Unmarried:
37.7% (88)
Marital status - White alone, not Hispanic / Latino population 15 years and over
Males 31.5% Never married53.5% Now married2.3% Separated2.9% Widowed9.8% DivorcedFemales 21.3% Never married56.9% Now married2.8% Separated10.3% Widowed8.6% DivorcedWomen who gave birth in the past 12 months Now married:
100.0% (41)Unmarried:
0.0% (0)
Women who did not give birth in the past 12 months Now married:
56.4% (802)Unmarried:
43.6% (621)
Marital status - Hispanic or Latino population 15 years and over
Males 47.8% Never married43.6% Now married0.0% Separated0.0% Widowed8.6% DivorcedFemales 56.9% Never married33.2% Now married0.3% Separated5.5% Widowed4.2% DivorcedWomen who did not give birth in the past 12 months Now married:
31.5% (108)Unmarried:
68.5% (235)
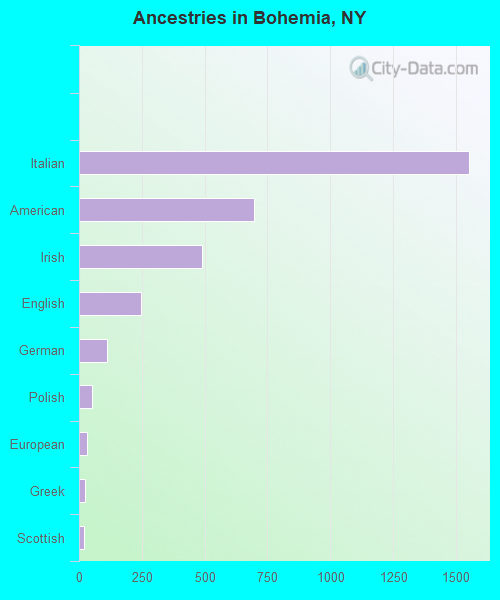
Ancestries in Bohemia
1,554 33.1% Italian698 14.9% American491 10.5% Irish246 5.2% English112 2.4% German53 1.1% Polish33 0.7% European25 0.5% Greek20 0.4% Scottish14 0.3% Hungarian12 0.3% Swedish9 0.2% Czech9 0.2% Eastern European9 0.2% Norwegian9 0.2% Turkish8 0.2% British7 0.1% Lebanese5 0.1% Russian5 0.1% Jamaican1 0.02% French Canadian1 0.02% Haitian
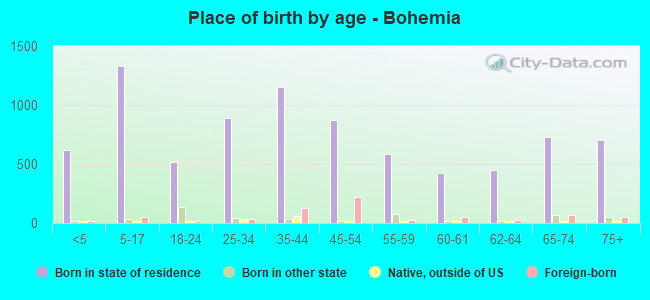
Children Nativity (place of birth) in Bohemia
Children under 6 years - Living with two parents Both parents native 433 100.0% NativeOne native, one foreign-born parent 41 100.0% NativeChildren under 6 years - Living with one parent Native parent 266 100.0% NativeChildren 6 to 17 years - Living with two parents Both parents native 869 98.5% Native14 1.5% Foreign-bornBoth parents foreign-born 88 94.6% Native5 5.4% Foreign-bornOne native, one foreign-born parent 48 100.0% NativeChildren 6 to 17 years - Living with one parent Native parent 131 93.0% Native10 7.0% Foreign-bornForeign-born parent 51 70.1% Native22 29.9% Foreign-born
Grandparents responsible for own grandchildren in Bohemia
Grandparents (30 to 59 years) Other race 5 100.0% Not responsible for grandchildrenTwo or more races 13 100.0% Responsible for grandchildrenHispanic or Latino 11 67.2% Responsible for grandchildren5 32.8% Not responsible for grandchildren
Grandparents (60 years and over) Other race 30 100.0% Responsible for grandchildrenHispanic or Latino 14 100.0% Responsible for grandchildren