Races in Boiling Springs, South Carolina (SC) Detailed Stats
Data:
Races - White alone (%)
Races - White alone (% change since 2000)
Races - Black alone (%)
Races - Black alone (% change since 2000)
Races - American Indian alone (%)
Races - American Indian alone (% change since 2000)
Races - Asian alone (%)
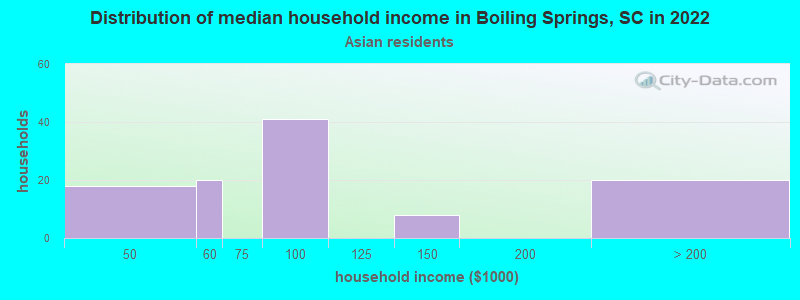
Races - Asian alone (% change since 2000)
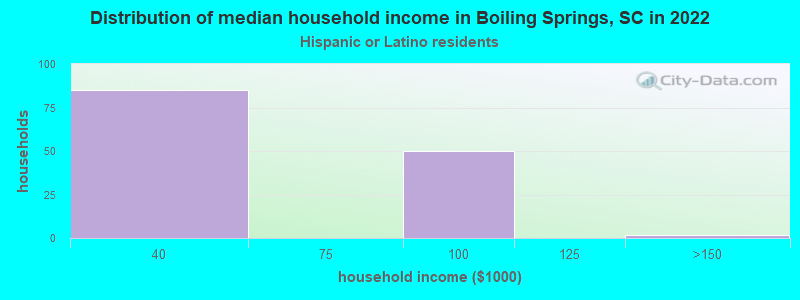
Races - Hispanic (%)
Races - Hispanic (% change since 2000)
Races - Native Hawaiian and Other Pacific Islander alone (%)
Races - Native Hawaiian and Other Pacific Islander alone (% change since 2000)
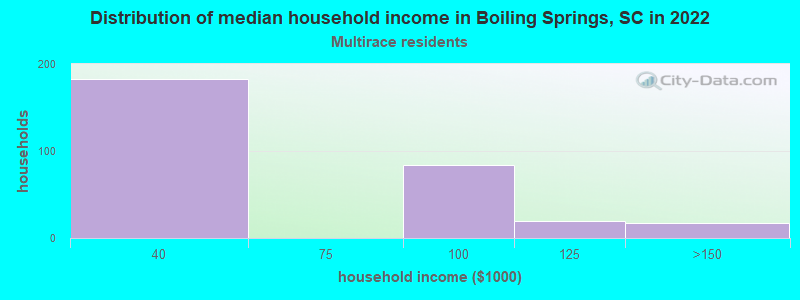
Races - Two or more races(%)
Races - Two or more races(% change since 2000)
Races - Other race alone (%)
Races - Other race alone (% change since 2000)
Racial diversity
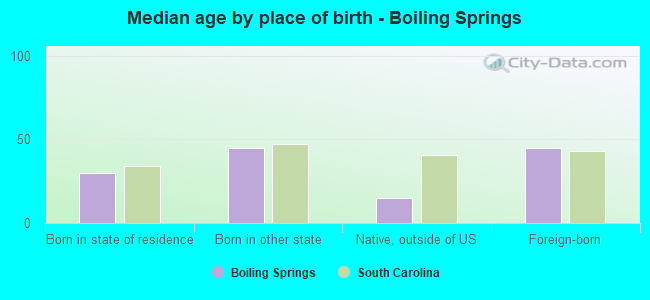
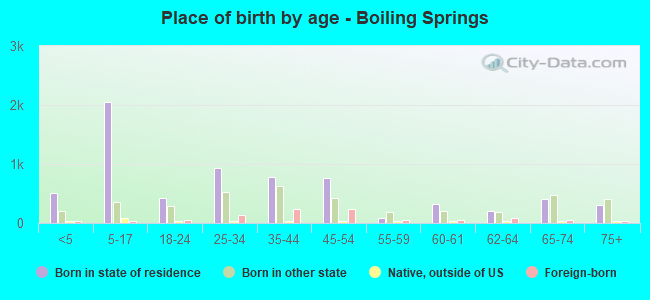
Place of birth - Born in state of residence (%)
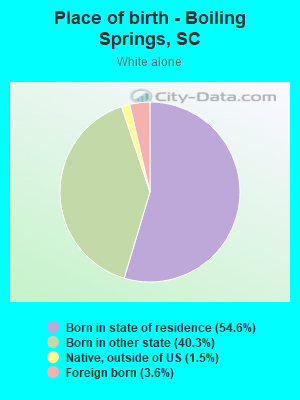
Place of birth - Born in state of residence (%) - White
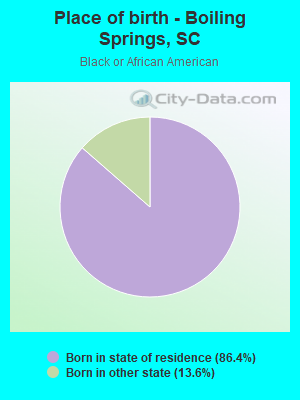
Place of birth - Born in state of residence (%) - Black or African American
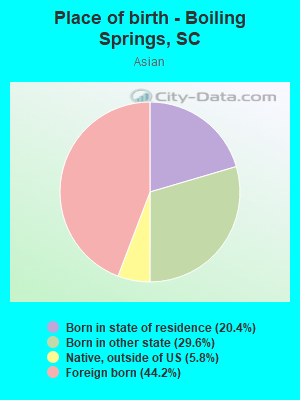
Place of birth - Born in state of residence (%) - Asian
Place of birth - Born in state of residence (%) - Hispanic or Latino
Place of birth - Born in state of residence (%) - American Indian and Alaska Native
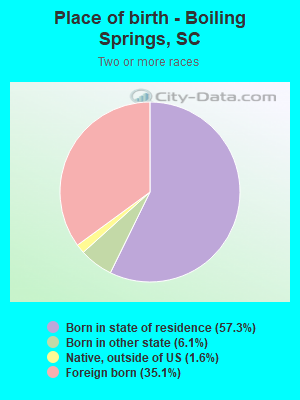
Place of birth - Born in state of residence (%) - Multirace
Place of birth - Born in state of residence (%) - Other Race
Place of birth - Born in other state (%)
Place of birth - Born in other state (%) - White
Place of birth - Born in other state (%) - Black or African American
Place of birth - Born in other state (%) - Asian
Place of birth - Born in other state (%) - Hispanic or Latino
Place of birth - Born in other state (%) - American Indian and Alaska Native
Place of birth - Born in other state (%) - Multirace
Place of birth - Born in other state (%) - Other Race
Place of birth - Native, outside of US (%)
Place of birth - Native, outside of US (%) - White
Place of birth - Native, outside of US (%) - Black or African American
Place of birth - Native, outside of US (%) - Asian
Place of birth - Native, outside of US (%) - Hispanic or Latino
Place of birth - Native, outside of US (%) - American Indian and Alaska Native
Place of birth - Native, outside of US (%) - Multirace
Place of birth - Native, outside of US (%) - Other Race
Place of birth - Foreign born (%)
Place of birth - Foreign born (%) - White
Place of birth - Foreign born (%) - Black or African American
Place of birth - Foreign born (%) - Asian
Place of birth - Foreign born (%) - Hispanic or Latino
Place of birth - Foreign born (%) - American Indian and Alaska Native
Place of birth - Foreign born (%) - Multirace
Place of birth - Foreign born (%) - Other Race
Residents speaking English at home (%)
Residents speaking English at home - Born in the United States (%)
Residents speaking English at home - Native, born elsewhere (%)
Residents speaking English at home - Foreign born (%)
Residents speaking Spanish at home (%)
Residents speaking Spanish at home - Born in the United States (%)
Residents speaking Spanish at home - Native, born elsewhere (%)
Residents speaking Spanish at home - Foreign born (%)
Residents speaking other language at home (%)
Residents speaking other language at home - Born in the United States (%)
Residents speaking other language at home - Native, born elsewhere (%)
Residents speaking other language at home - Foreign born (%)
Marital status - Never married (%)
Marital status - Now married (%)
Marital status - Separated (%)
Marital status - Widowed (%)
Marital status - Divorced (%)
Ancestries Reported - Arab (%)
Ancestries Reported - Czech (%)
Ancestries Reported - Danish (%)
Ancestries Reported - Dutch (%)
Ancestries Reported - English (%)
Ancestries Reported - French (%)
Ancestries Reported - French Canadian (%)
Ancestries Reported - German (%)
Ancestries Reported - Greek (%)
Ancestries Reported - Hungarian (%)
Ancestries Reported - Irish (%)
Ancestries Reported - Italian (%)
Ancestries Reported - Lithuanian (%)
Ancestries Reported - Norwegian (%)
Ancestries Reported - Polish (%)
Ancestries Reported - Portuguese (%)
Ancestries Reported - Russian (%)
Ancestries Reported - Scotch-Irish (%)
Ancestries Reported - Scottish (%)
Ancestries Reported - Slovak (%)
Ancestries Reported - Subsaharan African (%)
Ancestries Reported - Swedish (%)
Ancestries Reported - Swiss (%)
Ancestries Reported - Ukrainian (%)
Ancestries Reported - United States (%)
Ancestries Reported - Welsh (%)
Ancestries Reported - West Indian (%)
Ancestries Reported - Other (%)
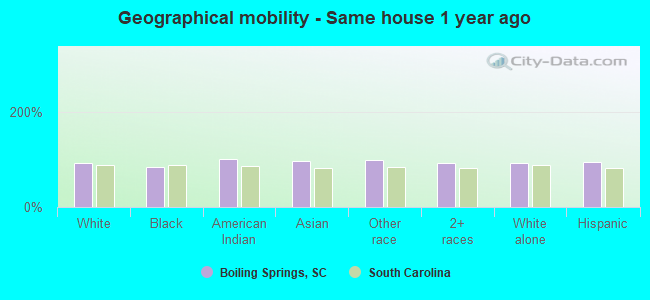
Geographical mobility - Same house 1 year ago (%)
Geographical mobility - Same house 1 year ago (%) - White
Geographical mobility - Same house 1 year ago (%) - Black or African American
Geographical mobility - Same house 1 year ago (%) - Asian
Geographical mobility - Same house 1 year ago (%) - Hispanic or Latino
Geographical mobility - Same house 1 year ago (%) - American Indian and Alaska Native
Geographical mobility - Same house 1 year ago (%) - Multirace
Geographical mobility - Same house 1 year ago (%) - Other Race
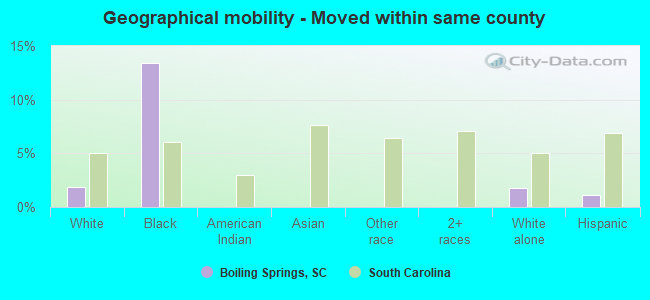
Geographical mobility - Moved within same county (%)
Geographical mobility - Moved within same county (%) - White
Geographical mobility - Moved within same county (%) - Black or African American
Geographical mobility - Moved within same county (%) - Asian
Geographical mobility - Moved within same county (%) - Hispanic or Latino
Geographical mobility - Moved within same county (%) - American Indian and Alaska Native
Geographical mobility - Moved within same county (%) - Multirace
Geographical mobility - Moved within same county (%) - Other Race
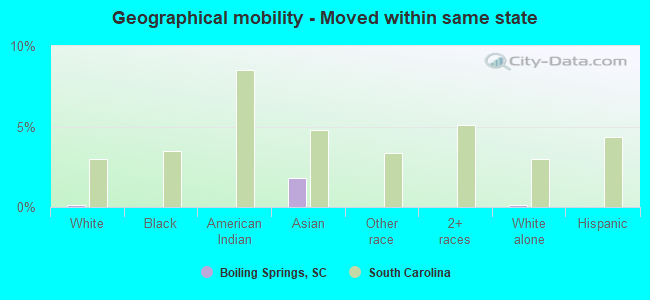
Geographical mobility - Moved from different county within same state (%)
Geographical mobility - Moved from different county within same state (%) - White
Geographical mobility - Moved from different county within same state (%) - Black or African American
Geographical mobility - Moved from different county within same state (%) - Asian
Geographical mobility - Moved from different county within same state (%) - Hispanic or Latino
Geographical mobility - Moved from different county within same state (%) - American Indian and Alaska Native
Geographical mobility - Moved from different county within same state (%) - Multirace
Geographical mobility - Moved from different county within same state (%) - Other Race
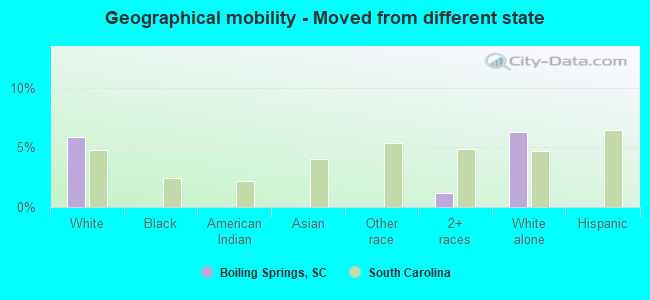
Geographical mobility - Moved from different state (%)
Geographical mobility - Moved from different state (%) - White
Geographical mobility - Moved from different state (%) - Black or African American
Geographical mobility - Moved from different state (%) - Asian
Geographical mobility - Moved from different state (%) - Hispanic or Latino
Geographical mobility - Moved from different state (%) - American Indian and Alaska Native
Geographical mobility - Moved from different state (%) - Multirace
Geographical mobility - Moved from different state (%) - Other Race
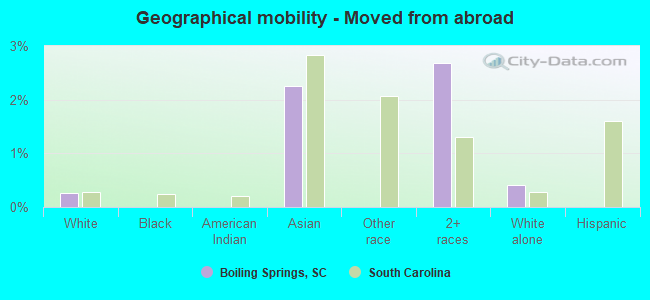
Geographical mobility - Moved from abroad (%)
Geographical mobility - Moved from abroad (%) - White
Geographical mobility - Moved from abroad (%) - Black or African American
Geographical mobility - Moved from abroad (%) - Asian
Geographical mobility - Moved from abroad (%) - Hispanic or Latino
Geographical mobility - Moved from abroad (%) - American Indian and Alaska Native
Geographical mobility - Moved from abroad (%) - Multirace
Geographical mobility - Moved from abroad (%) - Other Race
Place of birth for the foreign-born population - Ireland (%)
Place of birth for the foreign-born population - Denmark (%)
Place of birth for the foreign-born population - Norway (%)
Place of birth for the foreign-born population - Sweden (%)
Place of birth for the foreign-born population - United Kingdom (%)
Place of birth for the foreign-born population - England (%)
Place of birth for the foreign-born population - Scotland (%)
Place of birth for the foreign-born population - Other Northern Europe (%)
Place of birth for the foreign-born population - Austria (%)
Place of birth for the foreign-born population - Belgium (%)
Place of birth for the foreign-born population - France (%)
Place of birth for the foreign-born population - Germany (%)
Place of birth for the foreign-born population - Netherlands (%)
Place of birth for the foreign-born population - Switzerland (%)
Place of birth for the foreign-born population - Other Western Europe (%)
Place of birth for the foreign-born population - Greece (%)
Place of birth for the foreign-born population - Italy (%)
Place of birth for the foreign-born population - Portugal (%)
Place of birth for the foreign-born population - Spain (%)
Place of birth for the foreign-born population - Other Southern Europe (%)
Place of birth for the foreign-born population - Albania (%)
Place of birth for the foreign-born population - Belarus (%)
Place of birth for the foreign-born population - Bosnia and Herzegovina (%)
Place of birth for the foreign-born population - Bulgaria (%)
Place of birth for the foreign-born population - Croatia (%)
Place of birth for the foreign-born population - Czechoslovakia (%)
Place of birth for the foreign-born population - Hungary (%)
Place of birth for the foreign-born population - Latvia (%)
Place of birth for the foreign-born population - Lithuania (%)
Place of birth for the foreign-born population - North Macedonia (Macedonia) (%)
Place of birth for the foreign-born population - Moldova (%)
Place of birth for the foreign-born population - Poland (%)
Place of birth for the foreign-born population - Romania (%)
Place of birth for the foreign-born population - Russia (%)
Place of birth for the foreign-born population - Serbia (%)
Place of birth for the foreign-born population - Ukraine (%)
Place of birth for the foreign-born population - Other Eastern Europe (%)
Place of birth for the foreign-born population - China (%)
Place of birth for the foreign-born population - Hong Kong (%)
Place of birth for the foreign-born population - Taiwan (%)
Place of birth for the foreign-born population - Japan (%)
Place of birth for the foreign-born population - Korea (%)
Place of birth for the foreign-born population - Other Eastern Asia (%)
Place of birth for the foreign-born population - Afghanistan (%)
Place of birth for the foreign-born population - Bangladesh (%)
Place of birth for the foreign-born population - India (%)
Place of birth for the foreign-born population - Iran (%)
Place of birth for the foreign-born population - Kazakhstan (%)
Place of birth for the foreign-born population - Nepal (%)
Place of birth for the foreign-born population - Pakistan (%)
Place of birth for the foreign-born population - Sri Lanka (%)
Place of birth for the foreign-born population - Uzbekistan (%)
Place of birth for the foreign-born population - Other South Central Asia (%)
Place of birth for the foreign-born population - Burma (%)
Place of birth for the foreign-born population - Cambodia (%)
Place of birth for the foreign-born population - Indonesia (%)
Place of birth for the foreign-born population - Laos (%)
Place of birth for the foreign-born population - Malaysia (%)
Place of birth for the foreign-born population - Philippines (%)
Place of birth for the foreign-born population - Singapore (%)
Place of birth for the foreign-born population - Thailand (%)
Place of birth for the foreign-born population - Vietnam (%)
Place of birth for the foreign-born population - Other South Eastern Asia (%)
Place of birth for the foreign-born population - Armenia (%)
Place of birth for the foreign-born population - Iraq (%)
Place of birth for the foreign-born population - Israel (%)
Place of birth for the foreign-born population - Jordan (%)
Place of birth for the foreign-born population - Kuwait (%)
Place of birth for the foreign-born population - Lebanon (%)
Place of birth for the foreign-born population - Saudi Arabia (%)
Place of birth for the foreign-born population - Syria (%)
Place of birth for the foreign-born population - Turkey (%)
Place of birth for the foreign-born population - Yemen (%)
Place of birth for the foreign-born population - Other Western Asia (%)
Place of birth for the foreign-born population - Eritrea (%)
Place of birth for the foreign-born population - Ethiopia (%)
Place of birth for the foreign-born population - Kenya (%)
Place of birth for the foreign-born population - Somalia (%)
Place of birth for the foreign-born population - Uganda (%)
Place of birth for the foreign-born population - Zimbabwe (%)
Place of birth for the foreign-born population - Other Eastern Africa (%)
Place of birth for the foreign-born population - Cameroon (%)
Place of birth for the foreign-born population - Congo (%)
Place of birth for the foreign-born population - Democratic Republic of Congo (Zaire) (%)
Place of birth for the foreign-born population - Other Middle Africa (%)
Place of birth for the foreign-born population - Egypt (%)
Place of birth for the foreign-born population - Morocco (%)
Place of birth for the foreign-born population - Sudan (%)
Place of birth for the foreign-born population - Other Northern Africa (%)
Place of birth for the foreign-born population - South Africa (%)
Place of birth for the foreign-born population - Other Southern Africa (%)
Place of birth for the foreign-born population - Cabo Verde (%)
Place of birth for the foreign-born population - Ghana (%)
Place of birth for the foreign-born population - Liberia (%)
Place of birth for the foreign-born population - Nigeria (%)
Place of birth for the foreign-born population - Senegal (%)
Place of birth for the foreign-born population - Sierra Leone (%)
Place of birth for the foreign-born population - Other Western Africa (%)
Place of birth for the foreign-born population - Australia (%)
Place of birth for the foreign-born population - New Zealand (%)
Place of birth for the foreign-born population - Fiji (%)
Place of birth for the foreign-born population - Micronesia (%)
Place of birth for the foreign-born population - Bahamas (%)
Place of birth for the foreign-born population - Barbados (%)
Place of birth for the foreign-born population - Cuba (%)
Place of birth for the foreign-born population - Dominica (%)
Place of birth for the foreign-born population - Dominican Republic (%)
Place of birth for the foreign-born population - Grenada (%)
Place of birth for the foreign-born population - Haiti (%)
Place of birth for the foreign-born population - Jamaica (%)
Place of birth for the foreign-born population - St. Vincent and the Grenadines (%)
Place of birth for the foreign-born population - Trinidad and Tobago (%)
Place of birth for the foreign-born population - West Indies (%)
Place of birth for the foreign-born population - Other Caribbean (%)
Place of birth for the foreign-born population - Belize (%)
Place of birth for the foreign-born population - Costa Rica (%)
Place of birth for the foreign-born population - El Salvador (%)
Place of birth for the foreign-born population - Guatemala (%)
Place of birth for the foreign-born population - Honduras (%)
Place of birth for the foreign-born population - Mexico (%)
Place of birth for the foreign-born population - Nicaragua (%)
Place of birth for the foreign-born population - Panama (%)
Place of birth for the foreign-born population - Other Central America (%)
Place of birth for the foreign-born population - Argentina (%)
Place of birth for the foreign-born population - Bolivia (%)
Place of birth for the foreign-born population - Brazil (%)
Place of birth for the foreign-born population - Chile (%)
Place of birth for the foreign-born population - Colombia (%)
Place of birth for the foreign-born population - Ecuador (%)
Place of birth for the foreign-born population - Guyana (%)
Place of birth for the foreign-born population - Peru (%)
Place of birth for the foreign-born population - Uruguay (%)
Place of birth for the foreign-born population - Venezuela (%)
Place of birth for the foreign-born population - Other South America (%)
Place of birth for the foreign-born population - Canada (%)
Place of birth for the foreign-born population - Other Northern America (%)
Place of birth for the foreign-born population - Other (%)
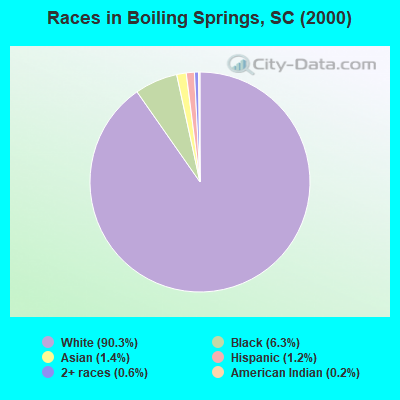
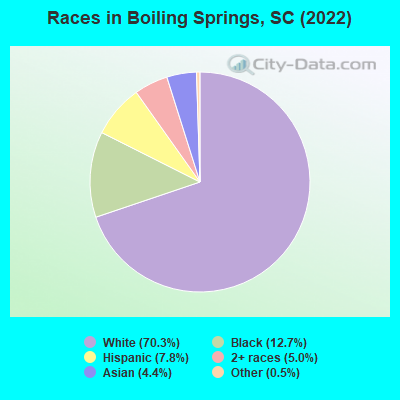
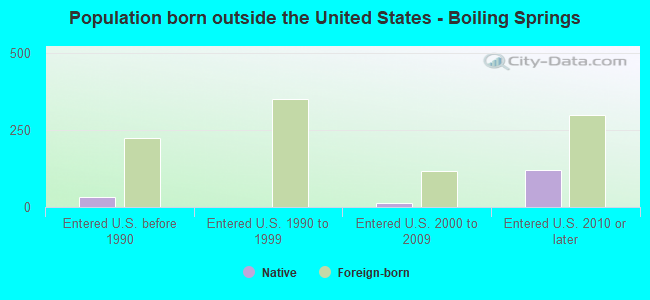
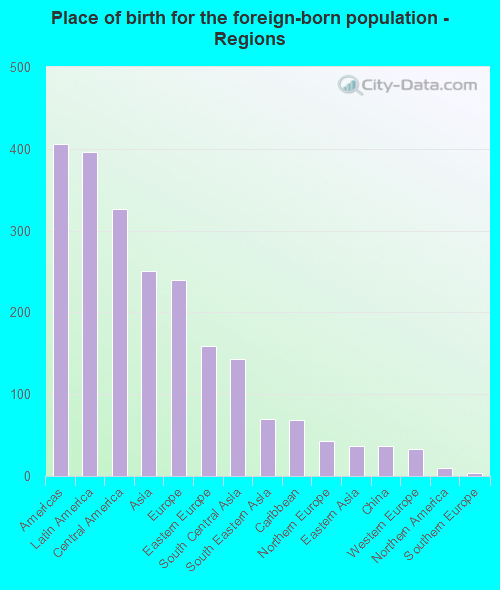
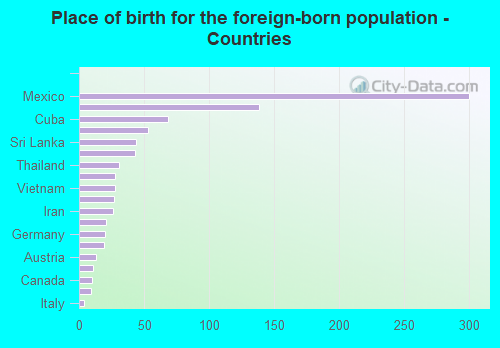
According to 2022 data, the most numerous races in Boiling Springs, SC are White alone (8,242 residents), Black alone (1,488 residents), and Hispanic (910 residents). 85.9% of Boiling Springs residents speak English at home. 7.7% of Boiling Springs, SC residents are foreign-born (3.5% born in Latin America, 2.2% born in Asia, 2.1% born in Europe), which is 34.8% greater than the foreign-born rate of 5.0% across the entire state of South Carolina.
Race distribution in Boiling Springs
2000 2022
2,652,291 66.1% White alone 1,178,486 29.4% Black alone 95,076 2.4% Hispanic 35,568 0.9% Asian alone 33,290 0.8% Two or more races 12,765 0.3% American Indian alone 3,266 0.08% Other race alone 1,270 0.03% Native Hawaiian and Other
3,301,739 62.5% White alone 1,313,290 24.9% Black alone 343,783 6.5% Hispanic 190,508 3.6% Two or more races 89,888 1.7% Asian alone 29,390 0.6% Other race alone 12,112 0.2% American Indian alone 1,924 0.04% Native Hawaiian and Other
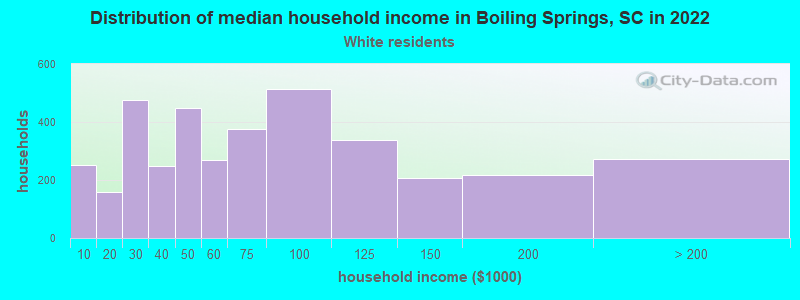
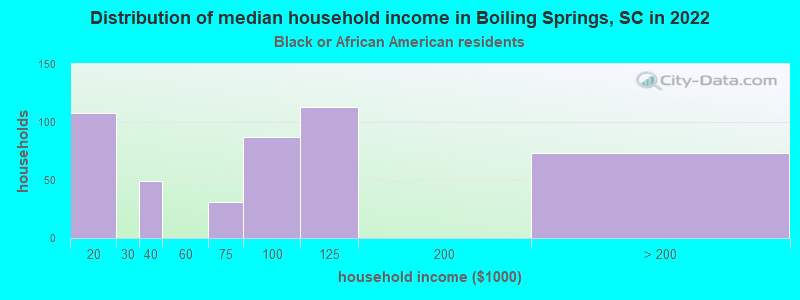
Income and house value in Boiling Springs Median household income in 2022 $60,644 White non-Hispanic householders$88,164 Black householders$68,134 Asian householdersMedian 2022 house value $244,311 White Non-Hispanic householders$261,533 Black or African American householders $276,787 Asian householders$338,296 Some other race householders$209,128 Two or more races householders$338,296 Hispanic or Latino householders
Median age by race in Boiling Springs
40.5 Median age for White residents40.2 39.2 31.4 Median age for Black or African American residents28.0 34.8 -295,634,920.3 Median age for American Indian / Alaska Native residents-583,333,332.8 -803,131,990.2 30.8 Median age for Asian residents29.7 29.5 -698,412,697.7 Median age for Native Hawaiian / Pacific Islander residents-551,574,375.1 -1,016,109,044.8 -742,616,033.0 Median age for Other race residents-733,125,648.3 -707,659,114.7 20.1 Median age for Two or more races residents20.6 8.4 39.8 Median age for White alone residents39.4 38.6 40.8 Median age for Hispanic or Latino residents23.2 45.1
Owner/renter occupied households by race in Boiling Springs
House owners and renters - White residents 3,134 84.0% Owner occupied595 16.0% Renter occupiedHouse owners and renters - Black or African American residents 302 61.3% Owner occupied191 38.7% Renter occupiedHouse owners and renters - American Indian / Alaska Native residents 11 100.0% Owner occupiedHouse owners and renters - Asian residents 91 100.0% Owner occupiedHouse owners and renters - Two or more races residents 255 100.0% Owner occupiedHouse owners and renters - White alone residents 3,168 85.2% Owner occupied550 14.8% Renter occupiedHouse owners and renters - Hispanic or Latino residents 151 62.6% Owner occupied90 37.4% Renter occupied
Language usage in Boiling Springs
English speakers - Total 85.9% of residents of Boiling Springs speak English at home.
8.5% of residents speak Spanish at home 476 50.9% Speak English very well459 49.1% Speak English less than very well5.7% of residents speak other language at home 357 56.8% Speak English very well272 43.2% Speak English less than very well
English speakers - Born in the United States 96.5% of residents of Boiling Springs speak English at home.
1.2% of residents speak Spanish at home 44 100.0% Speak English very well2.9% of residents speak other language at home 107 100.0% Speak English very well
All residents speak only English at home
English speakers - Foreign-born 7.6% of residents of Boiling Springs speak English at home.
47.7% of residents speak Spanish at home 120 24.1% Speak English very well377 75.9% Speak English less than very well44.4% of residents speak other language at home 184 39.8% Speak English very well278 60.2% Speak English less than very well
White (Caucasian) - Speak only English Native:
97.9% (7,534)Foreign-born:
16.1% (51)
White (Caucasian) - Speak another language Native:
2.2% (170)Foreign-born:
82.7% (261)
Asian - Speak only English Native:
89.2% (262)Foreign-born:
5.8% (13)
Asian - Speak another language Native:
4.6% (13)Foreign-born:
95.0% (211)
Two or more races - Speak another language Native:
61.3% (528)Foreign-born:
99.0% (645)
White alone - Speak only English Native:
97.4% (7,492)Foreign-born:
18.4% (55)
White alone - Speak another language Native:
2.6% (203)Foreign-born:
82.3% (244)
Hispanic or Latino - Speak another language Native:
82.8% (321)Foreign-born:
100.0% (506)
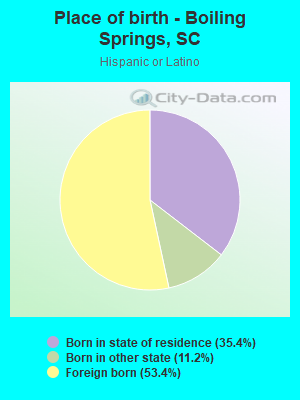
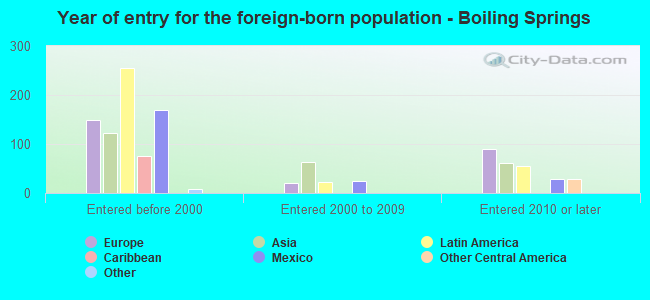
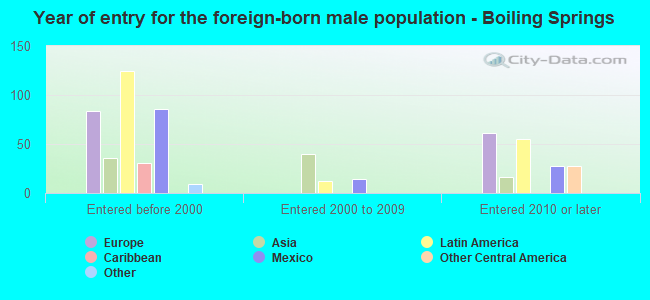
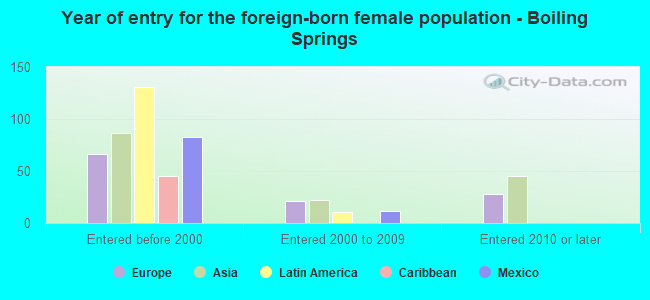
Foreign-born residents in Boiling Springs 899 residents are foreign born (3.5% Latin America , 2.2% Asia , 2.1% Europe ).
This city:
7.7%South Carolina:
5.3%
Marital status for residents in Boiling Springs Marital status - White (Caucasian) population 15 years and over
Males 14.5% Never married69.3% Now married1.4% Separated6.9% Widowed7.9% DivorcedFemales 14.4% Never married61.1% Now married1.5% Separated10.0% Widowed13.0% DivorcedWomen who gave birth in the past 12 months Now married:
100.0% (79)Unmarried:
0.0% (0)
Women who did not give birth in the past 12 months Now married:
71.0% (1,373)Unmarried:
29.0% (560)
Marital status - Black or African American population 15 years and over
Males 38.6% Never married61.4% Now married0.0% Separated0.0% Widowed0.0% DivorcedFemales 40.6% Never married37.8% Now married0.0% Separated1.3% Widowed20.4% DivorcedWomen who did not give birth in the past 12 months Now married:
56.6% (207)Unmarried:
43.4% (159)
Marital status - Asian population 15 years and over
Males 37.7% Never married56.5% Now married0.0% Separated0.0% Widowed5.8% DivorcedFemales 13.7% Never married71.1% Now married5.4% Separated9.8% Widowed0.0% DivorcedWomen who did not give birth in the past 12 months Now married:
81.2% (163)Unmarried:
18.8% (38)
Marital status - Two or more races population 15 years and over
Males 37.6% Never married59.3% Now married3.1% Separated0.0% Widowed0.0% DivorcedFemales 7.9% Never married85.5% Now married6.7% Separated0.0% Widowed0.0% DivorcedWomen who did not give birth in the past 12 months Now married:
91.0% (260)Unmarried:
9.0% (26)
Marital status - White alone, not Hispanic / Latino population 15 years and over
Males 15.1% Never married68.5% Now married1.4% Separated7.2% Widowed7.8% DivorcedFemales 14.5% Never married60.7% Now married1.5% Separated10.1% Widowed13.1% DivorcedWomen who gave birth in the past 12 months Now married:
100.0% (81)Unmarried:
0.0% (0)
Women who did not give birth in the past 12 months Now married:
71.0% (1,410)Unmarried:
29.0% (575)
Marital status - Hispanic or Latino population 15 years and over
Males 34.6% Never married59.9% Now married3.0% Separated0.0% Widowed2.5% DivorcedFemales 0.0% Never married93.4% Now married6.6% Separated0.0% Widowed0.0% DivorcedWomen who did not give birth in the past 12 months Now married:
100.0% (153)Unmarried:
0.0% (0)
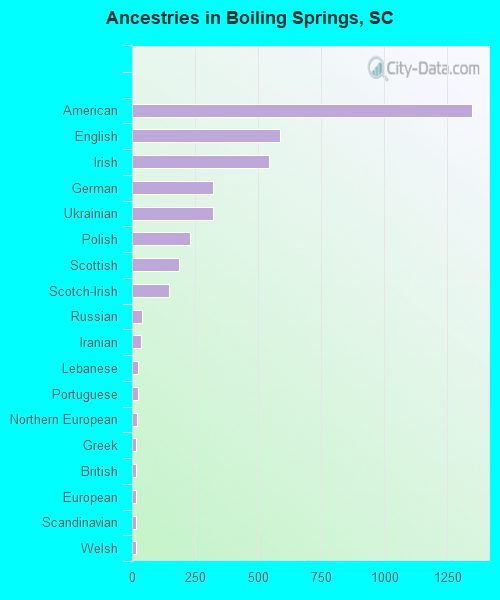
Ancestries in Boiling Springs
1,348 22.8% American586 9.9% English542 9.2% Irish322 5.4% German321 5.4% Ukrainian228 3.9% Polish186 3.1% Scottish147 2.5% Scotch-Irish40 0.7% Russian36 0.6% Iranian23 0.4% Lebanese22 0.4% Portuguese18 0.3% Northern European17 0.3% Greek16 0.3% British16 0.3% European16 0.3% Scandinavian14 0.2% Welsh12 0.2% Slovene12 0.2% Swedish10 0.2% Austrian5 0.08% French4 0.07% Italian3 0.05% Swiss
Children Nativity (place of birth) in Boiling Springs
Children under 6 years - Living with two parents Both parents native 682 100.0% NativeBoth parents foreign-born 22 100.0% NativeOne native, one foreign-born parent 49 100.0% NativeChildren under 6 years - Living with one parent Native parent 63 100.0% NativeChildren 6 to 17 years - Living with two parents Both parents native 1,680 99.6% Native7 0.4% Foreign-bornBoth parents foreign-born 269 100.0% NativeOne native, one foreign-born parent 36 100.0% NativeChildren 6 to 17 years - Living with one parent Native parent 118 100.0% NativeForeign-born parent 45 52.4% Native41 47.6% Foreign-born
Grandparents responsible for own grandchildren in Boiling Springs
Grandparents (30 to 59 years) Black or African American 115 100.0% Not responsible for grandchildren
Grandparents (60 years and over) Black or African American 6 100.0% Not responsible for grandchildren