Races in Bolivar, Missouri (MO) Detailed Stats
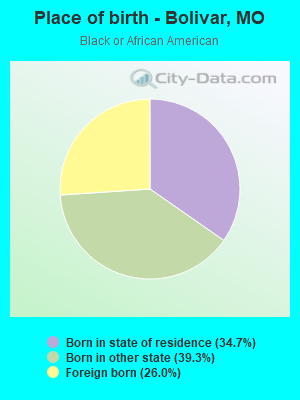
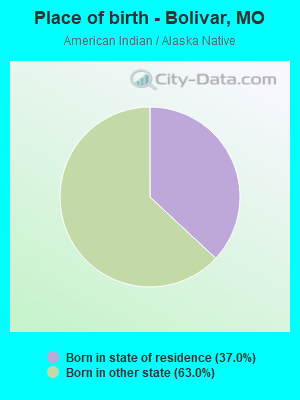
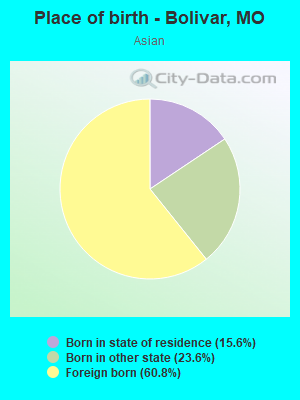
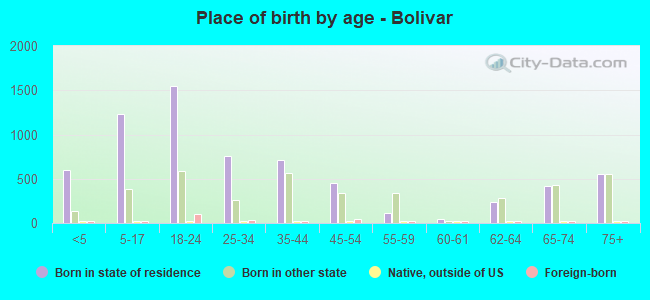
Ancestries, Foreign-born residents, place of birth
Settings
X


Recent posts about races in Bolivar, Missouri on our local forum with over 2,400,000 registered users:
 | Springfield, MO Crime Rate (Is it Really That Bad?) (24 replies) |
| Internet providers in Bolivar, MO (1 reply) |
| What is living in SW MO like? (27 replies) |
| Your Feedback on these Springfield Suburbs (13 replies) |
| Bolivar? (25 replies) |
| Bolivar? or Springfield? (2 replies) |
Latest news about races in Bolivar, MO collected exclusively by city-data.com from local newspapers, TV, and radio stations
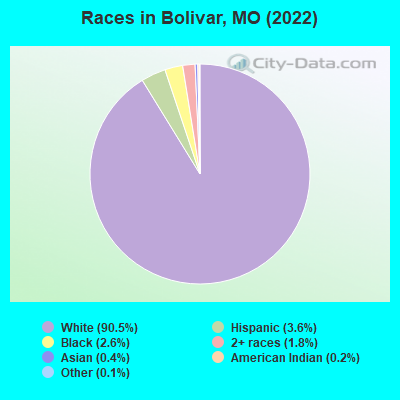
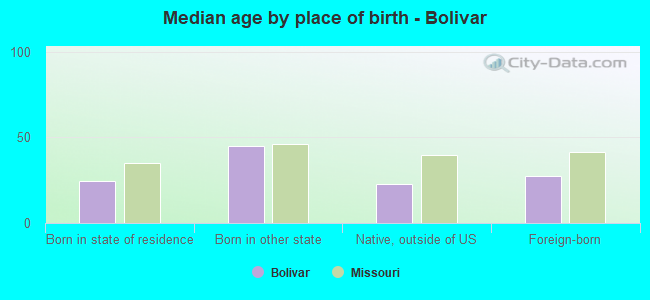
According to 2022 data, the most numerous races in Bolivar, MO are White alone (9,798 residents), Black alone (276 residents), and Two or more races (200 residents). 96.7% of Bolivar residents speak English at home. 2.4% of Bolivar, MO residents are foreign-born (1.1% born in Latin America, 0.8% born in Africa, 0.4% born in Asia), which is 68.4% less than the foreign-born rate of 4.0% across the entire state of Missouri.
Race distribution in Bolivar
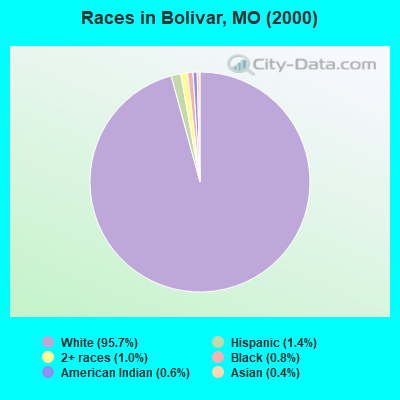
2000
2022

- 8,74895.7%White alone
- 1281.4%Hispanic
- 961.0%Two or more races
- 770.8%Black alone
- 530.6%American Indian alone
- 340.4%Asian alone
- 40.04%Native Hawaiian and Other
Pacific Islander alone - 30.03%Other race alone
-
- 9,79890.5%White alone
- 3893.6%Hispanic
- 2762.6%Black alone
- 2001.8%Two or more races
- 440.4%Asian alone
- 230.2%American Indian alone
- 160.1%Other race alone
2000
2022
-
- 4,686,47483.8%White alone
- 625,66711.2%Black alone
- 118,5922.1%Hispanic
- 71,9051.3%Two or more races
- 61,0411.1%Asian alone
- 23,3020.4%American Indian alone
- 5,2910.09%Other race alone
- 2,9390.05%Native Hawaiian and Other
Pacific Islander alone

-
- 4,733,41176.6%White alone
- 656,73910.6%Black alone
- 316,3005.1%Two or more races
- 291,7634.7%Hispanic
- 132,4362.1%Asian alone
- 27,4670.4%Other race alone
- 12,3130.2%American Indian alone
- 7,5280.1%Native Hawaiian and Other
Pacific Islander alone

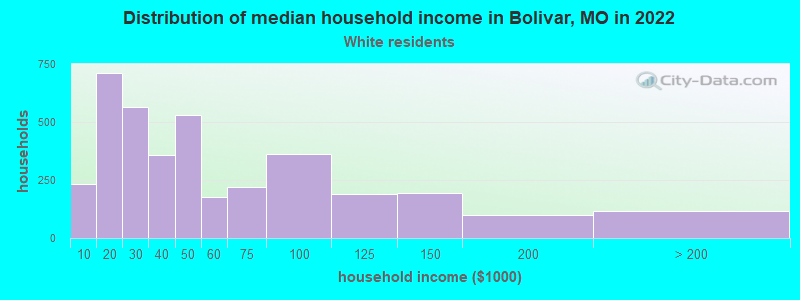
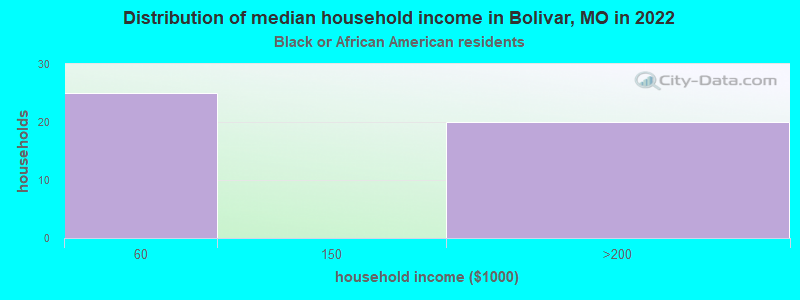
Income and house value in Bolivar
- Median household income in 2022
- $40,208White non-Hispanic householders
- $62,781Two or more races householders
- Median 2022 house value
- $180,820White Non-Hispanic householders
- $84,442American Indian or Alaska Native householders
- $213,922Hispanic or Latino householders
Household income for White non-Hispanic householders
Household income for Black householders
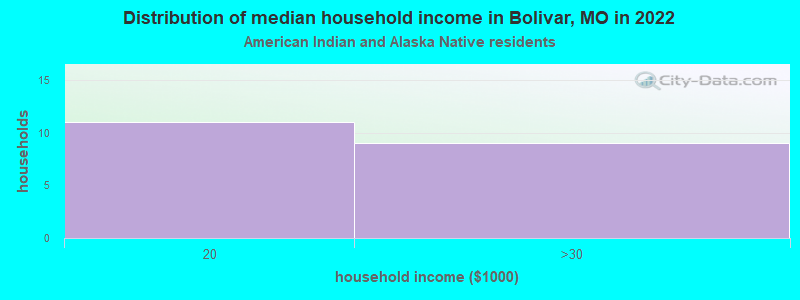
Household income for American Indian and Alaska Native householders
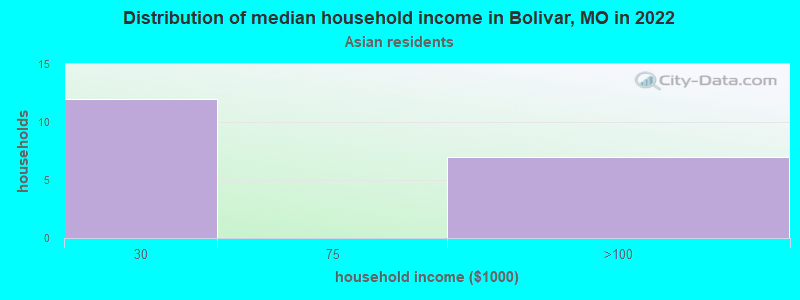
Household income for Asian householders
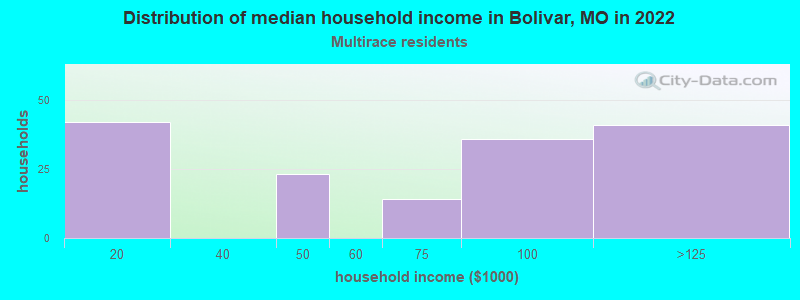
Household income for Two or more races householders
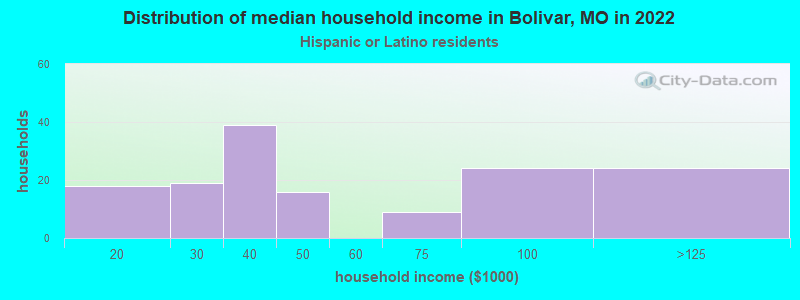
Household income for Hispanic or Latino race householders
Median age by race in Bolivar
- 33.2Median age for White residents
- 34.9Males
- 32.8Females
- 25.5Median age for Black or African American residents
- 24.6Males
- 55.7Females
- 56.8Median age for American Indian / Alaska Native residents
- -652,291,104.5Males
- 75.5Females
- 23.5Median age for Asian residents
- -676,616,914.7Males
- 72.2Females
- -693,430,656.2Median age for Native Hawaiian / Pacific Islander residents
- -683,513,838.1Males
- -752,136,751.4Females
- 20.1Median age for Other race residents
- -694,252,872.9Males
- -684,343,433.7Females
- 27.9Median age for Two or more races residents
- 22.3Males
- 27.8Females
- 33.2Median age for White alone residents
- 34.9Males
- 32.7Females
- 21.3Median age for Hispanic or Latino residents
- 21.5Males
- 21.1Females
Owner/renter occupied households by race in Bolivar
- House owners and renters - White residents
- 2,14257.1%Owner occupied
- 1,61242.9%Renter occupied
- House owners and renters - Black or African American residents
- 2147.4%Owner occupied
- 2352.6%Renter occupied
- House owners and renters - American Indian / Alaska Native residents
- 17100.0%Renter occupied
- House owners and renters - Asian residents
- 2172.5%Owner occupied
- 827.5%Renter occupied
- House owners and renters - Two or more races residents
- 3523.7%Owner occupied
- 11376.3%Renter occupied
- House owners and renters - White alone residents
- 2,11757.1%Owner occupied
- 1,59442.9%Renter occupied
- House owners and renters - Hispanic or Latino residents
- 5336.3%Owner occupied
- 9263.7%Renter occupied
Language usage in Bolivar
- English speakers - Total
- 96.7% of residents of Bolivar speak English at home.
- 1.7% of residents speak Spanish at home
- 8648.9%Speak English very well
- 9051.1%Speak English less than very well
- 1.5% of residents speak other language at home
- 12785.8%Speak English very well
- 2114.2%Speak English less than very well
- English speakers - Born in the United States
- 98.1% of residents of Bolivar speak English at home.
- 0.6% of residents speak Spanish at home
- 21100.0%Speak English very well
- 1.1% of residents speak other language at home
- 40100.0%Speak English very well
- English speakers - Native, born elsewhere
- 39.0% of residents of Bolivar speak English at home.
- 46.3% of residents speak Spanish at home
- 1789.5%Speak English very well
- 210.5%Speak English less than very well
- English speakers - Foreign-born
- 12.8% of residents of Bolivar speak English at home.
- 47.9% of residents speak Spanish at home
- 3629.3%Speak English very well
- 8770.7%Speak English less than very well
- 39.7% of residents speak other language at home
- 8179.4%Speak English very well
- 2120.6%Speak English less than very well
White (Caucasian) - Speak another language
| Native: | 0.5% (43) |
| Foreign-born: | 99.0% (42) |
Black or African American - Speak only English
| Native: | 99.2% (208) |
| Foreign-born: | 44.2% (32) |
Asian - Speak another language
| Native: | 50.0% (10) |
| Foreign-born: | 100.0% (32) |
Other race - Speak only English
| Native: | 100.0% (9) |
| Foreign-born: | 80.9% (8) |
Two or more races - Speak another language
| Native: | 18.1% (51) |
| Foreign-born: | 100.0% (146) |
White alone - Speak another language
| Native: | 0.5% (49) |
| Foreign-born: | 100.0% (29) |
Hispanic or Latino - Speak another language
| Native: | 21.6% (35) |
| Foreign-born: | 99.4% (124) |
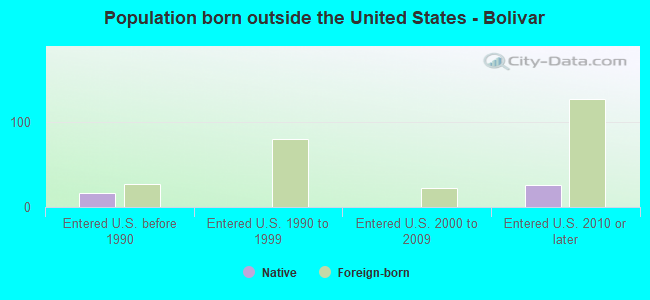
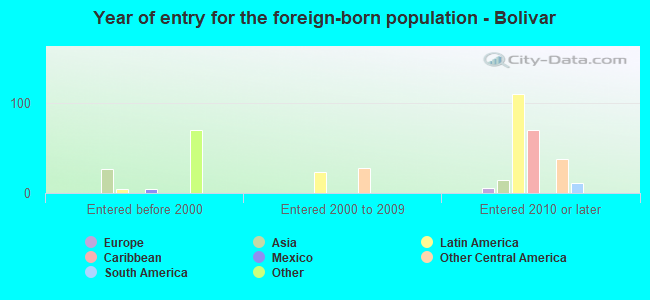
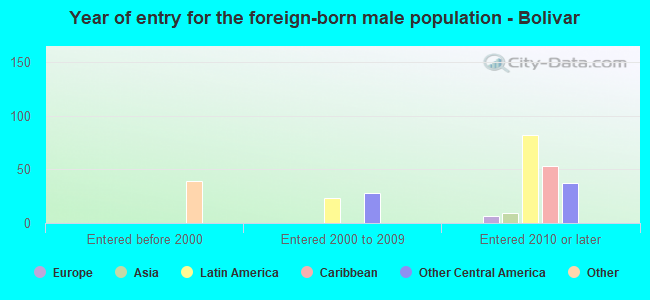
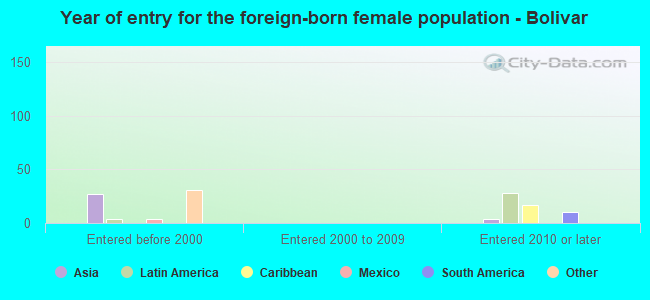
Foreign-born residents in Bolivar
257 residents are foreign born (1.1% Latin America, 0.8% Africa, 0.4% Asia).
| This city: | 2.4% |
| Missouri: | 4.2% |

Marital status for residents in Bolivar
Marital status - White (Caucasian) population 15 years and over
- Males
- 32.6%Never married
- 45.4%Now married
- 2.3%Separated
- 3.2%Widowed
- 16.6%Divorced
- Females
- 35.4%Never married
- 33.8%Now married
- 2.9%Separated
- 13.8%Widowed
- 14.0%Divorced
Women who gave birth in the past 12 months
| Now married: | 65.3% (65) |
| Unmarried: | 34.7% (34) |
Women who did not give birth in the past 12 months
| Now married: | 37.9% (1,016) |
| Unmarried: | 62.1% (1,667) |
Marital status - Black or African American population 15 years and over
- Males
- 86.8%Never married
- 10.5%Now married
- 0.0%Separated
- 0.0%Widowed
- 2.6%Divorced
- Females
- 45.4%Never married
- 20.6%Now married
- 0.0%Separated
- 0.0%Widowed
- 34.0%Divorced
Women who did not give birth in the past 12 months
| Now married: | 0.0% (0) |
| Unmarried: | 100.0% (41) |
Marital status - American Indian / Alaska Native population 15 years and over
- Males
- 0.0%Never married
- 0.0%Now married
- 0.0%Separated
- 0.0%Widowed
- 100.0%Divorced
- Females
- 0.0%Never married
- 100.0%Now married
- 0.0%Separated
- 0.0%Widowed
- 0.0%Divorced
Marital status - Asian population 15 years and over
- Males
- 100.0%Never married
- 0.0%Now married
- 0.0%Separated
- 0.0%Widowed
- 0.0%Divorced
- Females
- 36.7%Never married
- 0.0%Now married
- 0.0%Separated
- 63.3%Widowed
- 0.0%Divorced
Women who did not give birth in the past 12 months
| Now married: | 0.0% (0) |
| Unmarried: | 100.0% (12) |
Marital status - Other race population 15 years and over
- Males
- 100.0%Never married
- 0.0%Now married
- 0.0%Separated
- 0.0%Widowed
- 0.0%Divorced
- Females
- 100.0%Never married
- 0.0%Now married
- 0.0%Separated
- 0.0%Widowed
- 0.0%Divorced
Women who did not give birth in the past 12 months
| Now married: | 0.0% (0) |
| Unmarried: | 100.0% (9) |
Marital status - Two or more races population 15 years and over
- Males
- 88.2%Never married
- 11.8%Now married
- 0.0%Separated
- 0.0%Widowed
- 0.0%Divorced
- Females
- 19.4%Never married
- 27.1%Now married
- 0.0%Separated
- 2.8%Widowed
- 50.7%Divorced
Women who gave birth in the past 12 months
| Now married: | 0.0% (0) |
| Unmarried: | 100.0% (30) |
Women who did not give birth in the past 12 months
| Now married: | 21.4% (25) |
| Unmarried: | 78.6% (91) |
Marital status - White alone, not Hispanic / Latino population 15 years and over
- Males
- 32.4%Never married
- 46.3%Now married
- 2.3%Separated
- 3.2%Widowed
- 15.8%Divorced
- Females
- 35.6%Never married
- 34.1%Now married
- 2.9%Separated
- 13.6%Widowed
- 13.8%Divorced
Women who gave birth in the past 12 months
| Now married: | 65.3% (65) |
| Unmarried: | 34.7% (35) |
Women who did not give birth in the past 12 months
| Now married: | 38.0% (1,027) |
| Unmarried: | 62.0% (1,674) |
Marital status - Hispanic or Latino population 15 years and over
- Males
- 66.9%Never married
- 8.9%Now married
- 0.0%Separated
- 0.0%Widowed
- 24.2%Divorced
- Females
- 37.6%Never married
- 19.7%Now married
- 0.0%Separated
- 17.1%Widowed
- 25.6%Divorced
Women who gave birth in the past 12 months
| Now married: | 0.0% (0) |
| Unmarried: | 100.0% (24) |
Women who did not give birth in the past 12 months
| Now married: | 29.0% (10) |
| Unmarried: | 71.0% (24) |
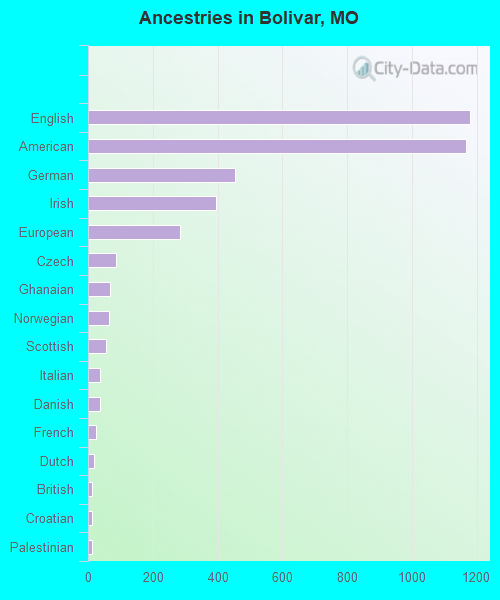
Ancestries in Bolivar

- 1,17926.6%English
- 1,16626.3%American
- 45510.3%German
- 3948.9%Irish
- 2846.4%European
- 851.9%Czech
- 681.5%Ghanaian
- 661.5%Norwegian
- 551.2%Scottish
- 370.8%Italian
- 360.8%Danish
- 250.6%French
- 180.4%Dutch
- 130.3%British
- 130.3%Croatian
- 110.2%Palestinian
- 50.1%Bahamian
- 20.05%Hungarian
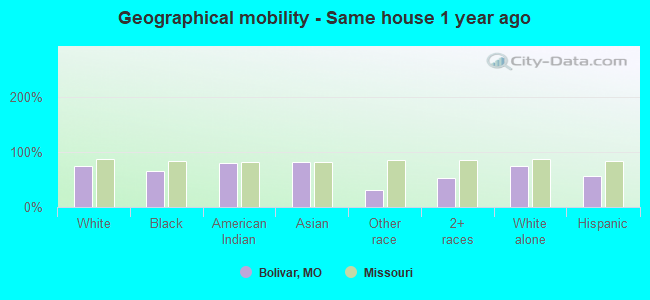
Geographical mobility in Bolivar

- Same house 1 year ago
- 7,25974.4%White (Caucasian)
- 18266.0%Black or African American
- 1980.3%American Indian / Alaska Native
- 4382.8%Asian
- 631.7%Other race
- 22453.2%Two or more races
- 7,23374.4%White alone, not Hispanic / Latino
- 17255.8%Hispanic or Latino
-
- Moved within same county
- 98310.1%White / Caucasian
- 51.8%Black or African American
- 521.5%American Indian / Alaska Native
- 204.6%Two or more races
- 99010.2%White alone, not Hispanic / Latino

-
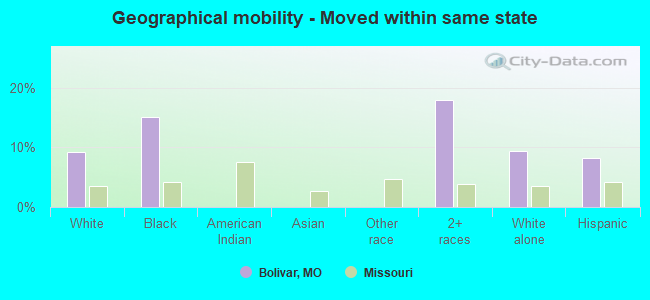
- Moved within same state
- 9039.3%White / Caucasian
- 4215.1%Black or African American
- 7618.0%Two or more races
- 9069.3%White alone, not Hispanic / Latino
- 258.2%Hispanic or Latino
-
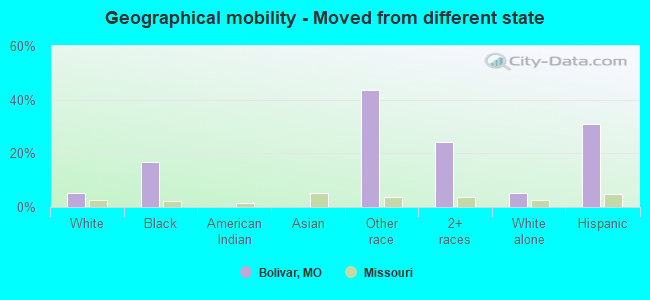
- Moved from different state
- 5085.2%White / Caucasian
- 4716.9%Black or African American
- 843.4%Other race
- 10224.1%Two or more races
- 5035.2%White alone, not Hispanic / Latino
- 9631.1%Hispanic or Latino
-
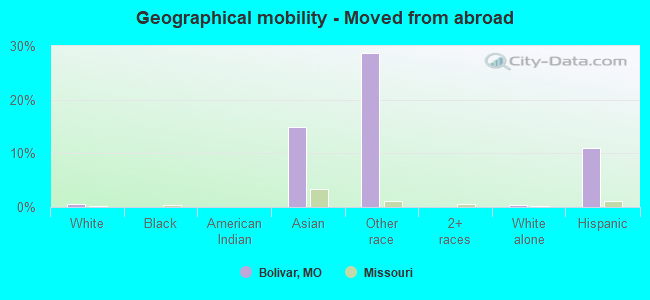
- Moved from abroad
- 520.5%White
- 814.9%Asian
- 628.7%Other race
- 360.4%White alone, not Hispanic / Latino
- 3411.1%Hispanic or Latino
Children Nativity (place of birth) in Bolivar
Place of birth for residents in Bolivar
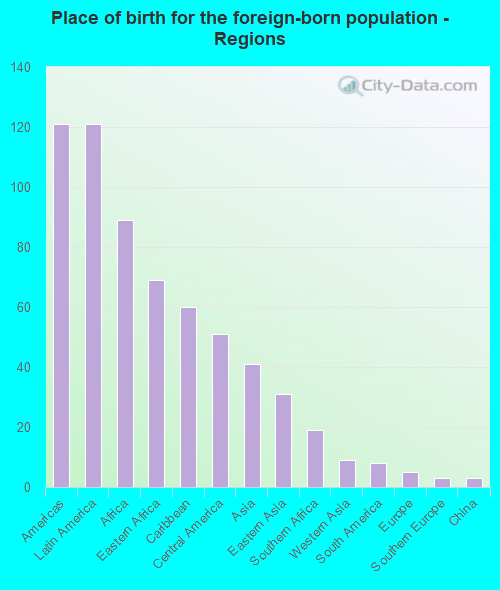
![Place of birth for the foreign-born population - Regions]()
- 121Americas
- 121Latin America
- 89Africa
- 69Eastern Africa
- 60Caribbean
- 51Central America
- 41Asia
- 31Eastern Asia
- 19Southern Africa
- 9Western Asia
- 8South America
- 5Europe
- 3Southern Europe
- 3China
- 1Eastern Europe
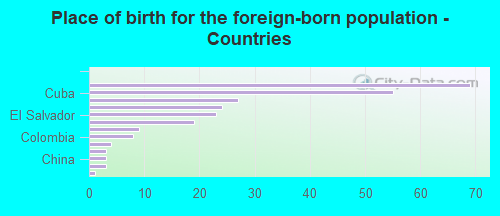
![Place of birth for the foreign-born population - Countries]()
- 69Ethiopia
- 55Cuba
- 27Korea
- 24Guatemala
- 23El Salvador
- 19South Africa
- 9Israel
- 8Colombia
- 4Bahamas
- 3Spain
- 3China
- 3Mexico
- 1Hungary
Grandparents responsible for own grandchildren in Bolivar
Zip codes: 65613.