Races in Bonner Springs, Kansas (KS) Detailed Stats
Data:
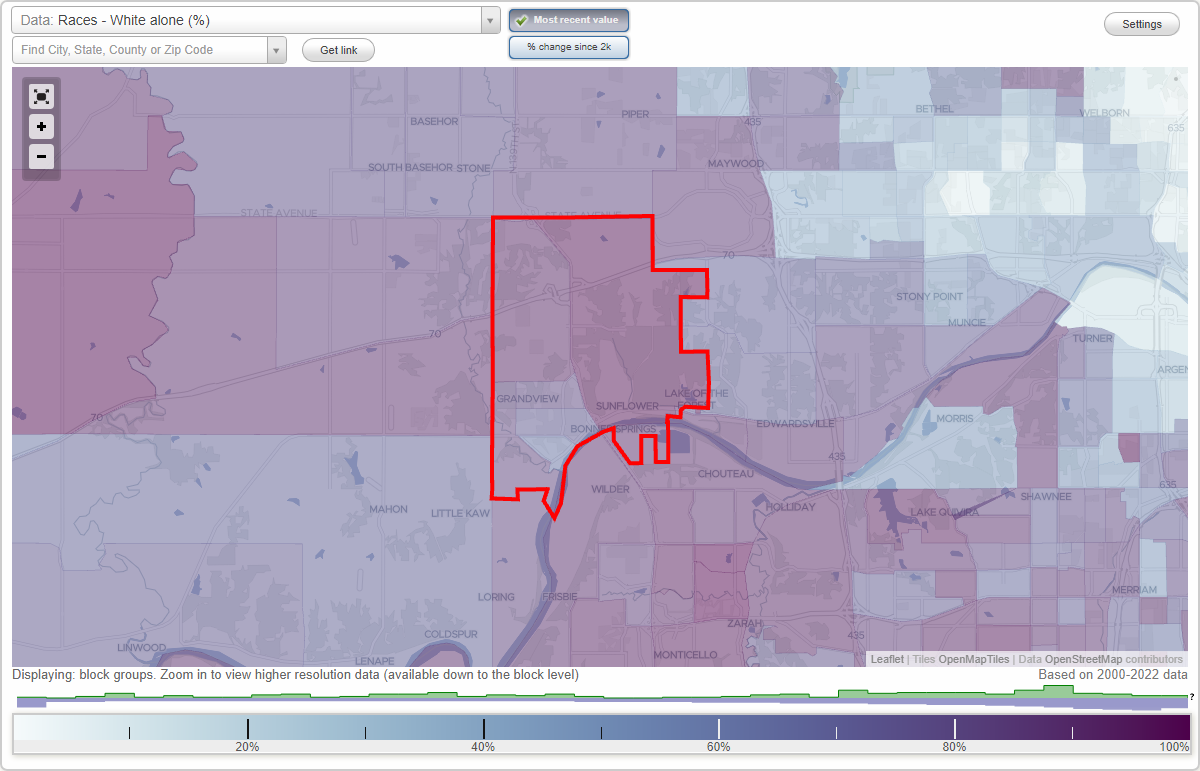
Races - White alone (%)
Races - White alone (% change since 2000)
Races - Black alone (%)
Races - Black alone (% change since 2000)
Races - American Indian alone (%)
Races - American Indian alone (% change since 2000)
Races - Asian alone (%)
Races - Asian alone (% change since 2000)
Races - Hispanic (%)
Races - Hispanic (% change since 2000)
Races - Native Hawaiian and Other Pacific Islander alone (%)
Races - Native Hawaiian and Other Pacific Islander alone (% change since 2000)
Races - Two or more races(%)
Races - Two or more races(% change since 2000)
Races - Other race alone (%)
Races - Other race alone (% change since 2000)
Racial diversity
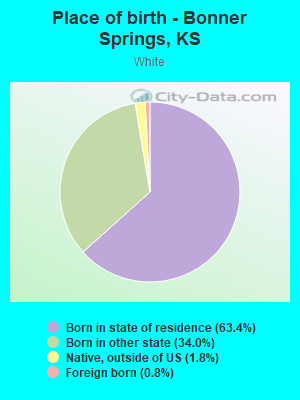
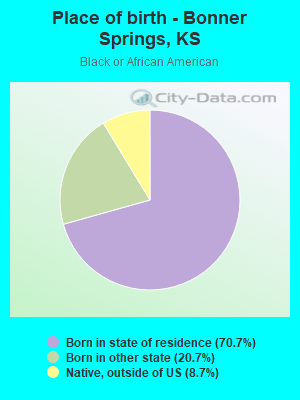
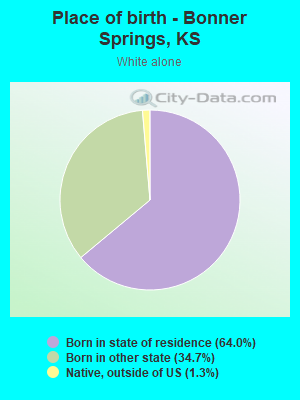
Place of birth - Born in state of residence (%)
Place of birth - Born in state of residence (%) - White
Place of birth - Born in state of residence (%) - Black or African American
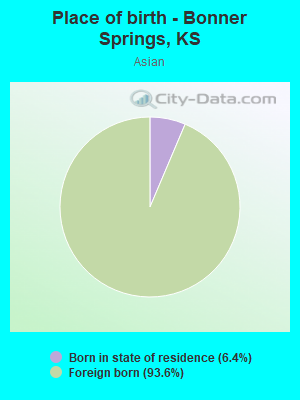
Place of birth - Born in state of residence (%) - Asian
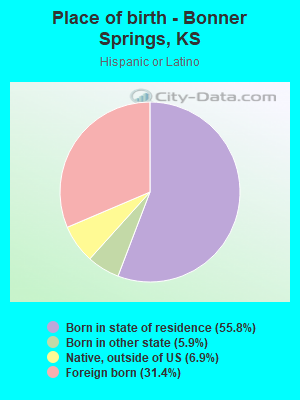
Place of birth - Born in state of residence (%) - Hispanic or Latino
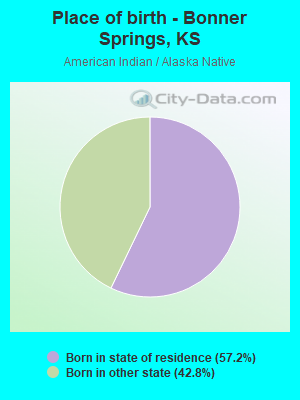
Place of birth - Born in state of residence (%) - American Indian and Alaska Native
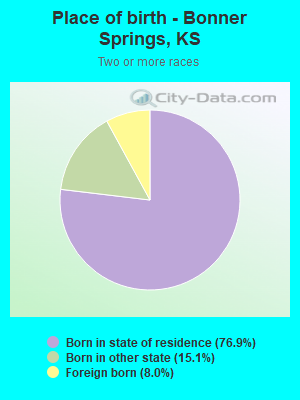
Place of birth - Born in state of residence (%) - Multirace
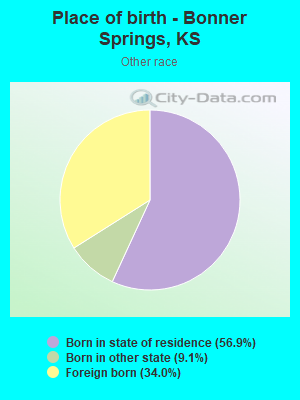
Place of birth - Born in state of residence (%) - Other Race
Place of birth - Born in other state (%)
Place of birth - Born in other state (%) - White
Place of birth - Born in other state (%) - Black or African American
Place of birth - Born in other state (%) - Asian
Place of birth - Born in other state (%) - Hispanic or Latino
Place of birth - Born in other state (%) - American Indian and Alaska Native
Place of birth - Born in other state (%) - Multirace
Place of birth - Born in other state (%) - Other Race
Place of birth - Native, outside of US (%)
Place of birth - Native, outside of US (%) - White
Place of birth - Native, outside of US (%) - Black or African American
Place of birth - Native, outside of US (%) - Asian
Place of birth - Native, outside of US (%) - Hispanic or Latino
Place of birth - Native, outside of US (%) - American Indian and Alaska Native
Place of birth - Native, outside of US (%) - Multirace
Place of birth - Native, outside of US (%) - Other Race
Place of birth - Foreign born (%)
Place of birth - Foreign born (%) - White
Place of birth - Foreign born (%) - Black or African American
Place of birth - Foreign born (%) - Asian
Place of birth - Foreign born (%) - Hispanic or Latino
Place of birth - Foreign born (%) - American Indian and Alaska Native
Place of birth - Foreign born (%) - Multirace
Place of birth - Foreign born (%) - Other Race
Residents speaking English at home (%)
Residents speaking English at home - Born in the United States (%)
Residents speaking English at home - Native, born elsewhere (%)
Residents speaking English at home - Foreign born (%)
Residents speaking Spanish at home (%)
Residents speaking Spanish at home - Born in the United States (%)
Residents speaking Spanish at home - Native, born elsewhere (%)
Residents speaking Spanish at home - Foreign born (%)
Residents speaking other language at home (%)
Residents speaking other language at home - Born in the United States (%)
Residents speaking other language at home - Native, born elsewhere (%)
Residents speaking other language at home - Foreign born (%)
Marital status - Never married (%)
Marital status - Now married (%)
Marital status - Separated (%)
Marital status - Widowed (%)
Marital status - Divorced (%)
Ancestries Reported - Arab (%)
Ancestries Reported - Czech (%)
Ancestries Reported - Danish (%)
Ancestries Reported - Dutch (%)
Ancestries Reported - English (%)
Ancestries Reported - French (%)
Ancestries Reported - French Canadian (%)
Ancestries Reported - German (%)
Ancestries Reported - Greek (%)
Ancestries Reported - Hungarian (%)
Ancestries Reported - Irish (%)
Ancestries Reported - Italian (%)
Ancestries Reported - Lithuanian (%)
Ancestries Reported - Norwegian (%)
Ancestries Reported - Polish (%)
Ancestries Reported - Portuguese (%)
Ancestries Reported - Russian (%)
Ancestries Reported - Scotch-Irish (%)
Ancestries Reported - Scottish (%)
Ancestries Reported - Slovak (%)
Ancestries Reported - Subsaharan African (%)
Ancestries Reported - Swedish (%)
Ancestries Reported - Swiss (%)
Ancestries Reported - Ukrainian (%)
Ancestries Reported - United States (%)
Ancestries Reported - Welsh (%)
Ancestries Reported - West Indian (%)
Ancestries Reported - Other (%)
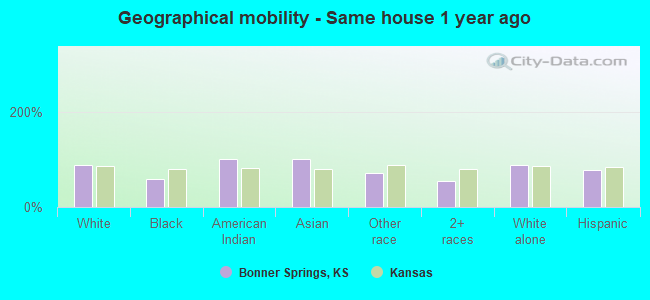
Geographical mobility - Same house 1 year ago (%)
Geographical mobility - Same house 1 year ago (%) - White
Geographical mobility - Same house 1 year ago (%) - Black or African American
Geographical mobility - Same house 1 year ago (%) - Asian
Geographical mobility - Same house 1 year ago (%) - Hispanic or Latino
Geographical mobility - Same house 1 year ago (%) - American Indian and Alaska Native
Geographical mobility - Same house 1 year ago (%) - Multirace
Geographical mobility - Same house 1 year ago (%) - Other Race
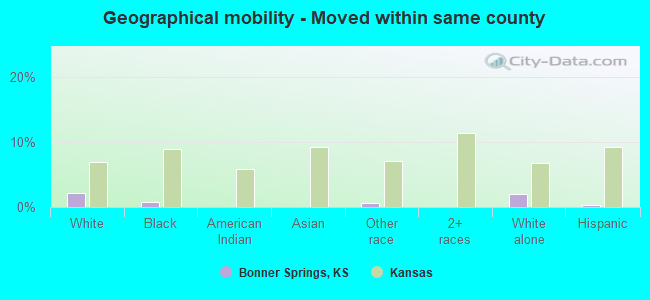
Geographical mobility - Moved within same county (%)
Geographical mobility - Moved within same county (%) - White
Geographical mobility - Moved within same county (%) - Black or African American
Geographical mobility - Moved within same county (%) - Asian
Geographical mobility - Moved within same county (%) - Hispanic or Latino
Geographical mobility - Moved within same county (%) - American Indian and Alaska Native
Geographical mobility - Moved within same county (%) - Multirace
Geographical mobility - Moved within same county (%) - Other Race
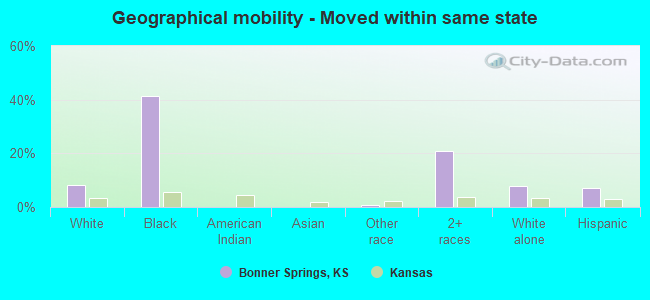
Geographical mobility - Moved from different county within same state (%)
Geographical mobility - Moved from different county within same state (%) - White
Geographical mobility - Moved from different county within same state (%) - Black or African American
Geographical mobility - Moved from different county within same state (%) - Asian
Geographical mobility - Moved from different county within same state (%) - Hispanic or Latino
Geographical mobility - Moved from different county within same state (%) - American Indian and Alaska Native
Geographical mobility - Moved from different county within same state (%) - Multirace
Geographical mobility - Moved from different county within same state (%) - Other Race
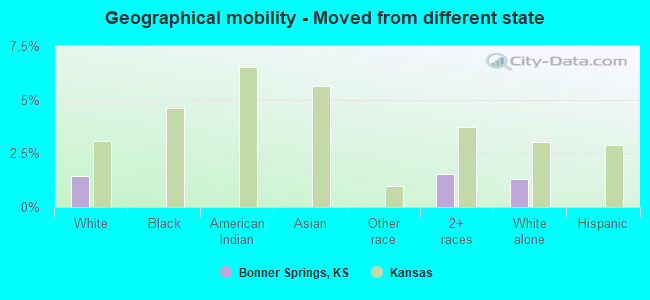
Geographical mobility - Moved from different state (%)
Geographical mobility - Moved from different state (%) - White
Geographical mobility - Moved from different state (%) - Black or African American
Geographical mobility - Moved from different state (%) - Asian
Geographical mobility - Moved from different state (%) - Hispanic or Latino
Geographical mobility - Moved from different state (%) - American Indian and Alaska Native
Geographical mobility - Moved from different state (%) - Multirace
Geographical mobility - Moved from different state (%) - Other Race
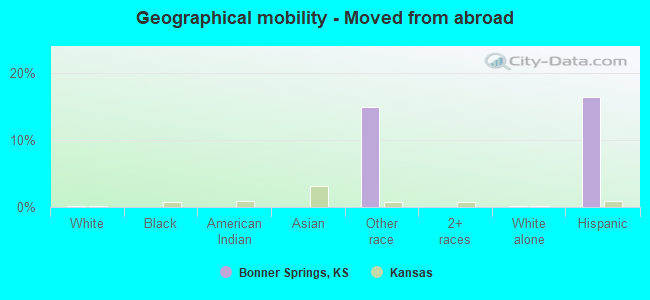
Geographical mobility - Moved from abroad (%)
Geographical mobility - Moved from abroad (%) - White
Geographical mobility - Moved from abroad (%) - Black or African American
Geographical mobility - Moved from abroad (%) - Asian
Geographical mobility - Moved from abroad (%) - Hispanic or Latino
Geographical mobility - Moved from abroad (%) - American Indian and Alaska Native
Geographical mobility - Moved from abroad (%) - Multirace
Geographical mobility - Moved from abroad (%) - Other Race
Place of birth for the foreign-born population - Ireland (%)
Place of birth for the foreign-born population - Denmark (%)
Place of birth for the foreign-born population - Norway (%)
Place of birth for the foreign-born population - Sweden (%)
Place of birth for the foreign-born population - United Kingdom (%)
Place of birth for the foreign-born population - England (%)
Place of birth for the foreign-born population - Scotland (%)
Place of birth for the foreign-born population - Other Northern Europe (%)
Place of birth for the foreign-born population - Austria (%)
Place of birth for the foreign-born population - Belgium (%)
Place of birth for the foreign-born population - France (%)
Place of birth for the foreign-born population - Germany (%)
Place of birth for the foreign-born population - Netherlands (%)
Place of birth for the foreign-born population - Switzerland (%)
Place of birth for the foreign-born population - Other Western Europe (%)
Place of birth for the foreign-born population - Greece (%)
Place of birth for the foreign-born population - Italy (%)
Place of birth for the foreign-born population - Portugal (%)
Place of birth for the foreign-born population - Spain (%)
Place of birth for the foreign-born population - Other Southern Europe (%)
Place of birth for the foreign-born population - Albania (%)
Place of birth for the foreign-born population - Belarus (%)
Place of birth for the foreign-born population - Bosnia and Herzegovina (%)
Place of birth for the foreign-born population - Bulgaria (%)
Place of birth for the foreign-born population - Croatia (%)
Place of birth for the foreign-born population - Czechoslovakia (%)
Place of birth for the foreign-born population - Hungary (%)
Place of birth for the foreign-born population - Latvia (%)
Place of birth for the foreign-born population - Lithuania (%)
Place of birth for the foreign-born population - North Macedonia (Macedonia) (%)
Place of birth for the foreign-born population - Moldova (%)
Place of birth for the foreign-born population - Poland (%)
Place of birth for the foreign-born population - Romania (%)
Place of birth for the foreign-born population - Russia (%)
Place of birth for the foreign-born population - Serbia (%)
Place of birth for the foreign-born population - Ukraine (%)
Place of birth for the foreign-born population - Other Eastern Europe (%)
Place of birth for the foreign-born population - China (%)
Place of birth for the foreign-born population - Hong Kong (%)
Place of birth for the foreign-born population - Taiwan (%)
Place of birth for the foreign-born population - Japan (%)
Place of birth for the foreign-born population - Korea (%)
Place of birth for the foreign-born population - Other Eastern Asia (%)
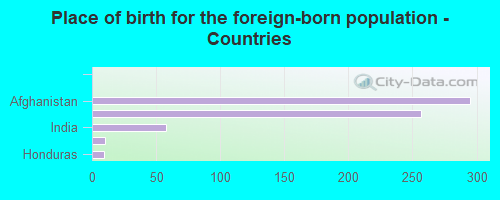
Place of birth for the foreign-born population - Afghanistan (%)
Place of birth for the foreign-born population - Bangladesh (%)
Place of birth for the foreign-born population - India (%)
Place of birth for the foreign-born population - Iran (%)
Place of birth for the foreign-born population - Kazakhstan (%)
Place of birth for the foreign-born population - Nepal (%)
Place of birth for the foreign-born population - Pakistan (%)
Place of birth for the foreign-born population - Sri Lanka (%)
Place of birth for the foreign-born population - Uzbekistan (%)
Place of birth for the foreign-born population - Other South Central Asia (%)
Place of birth for the foreign-born population - Burma (%)
Place of birth for the foreign-born population - Cambodia (%)
Place of birth for the foreign-born population - Indonesia (%)
Place of birth for the foreign-born population - Laos (%)
Place of birth for the foreign-born population - Malaysia (%)
Place of birth for the foreign-born population - Philippines (%)
Place of birth for the foreign-born population - Singapore (%)
Place of birth for the foreign-born population - Thailand (%)
Place of birth for the foreign-born population - Vietnam (%)
Place of birth for the foreign-born population - Other South Eastern Asia (%)
Place of birth for the foreign-born population - Armenia (%)
Place of birth for the foreign-born population - Iraq (%)
Place of birth for the foreign-born population - Israel (%)
Place of birth for the foreign-born population - Jordan (%)
Place of birth for the foreign-born population - Kuwait (%)
Place of birth for the foreign-born population - Lebanon (%)
Place of birth for the foreign-born population - Saudi Arabia (%)
Place of birth for the foreign-born population - Syria (%)
Place of birth for the foreign-born population - Turkey (%)
Place of birth for the foreign-born population - Yemen (%)
Place of birth for the foreign-born population - Other Western Asia (%)
Place of birth for the foreign-born population - Eritrea (%)
Place of birth for the foreign-born population - Ethiopia (%)
Place of birth for the foreign-born population - Kenya (%)
Place of birth for the foreign-born population - Somalia (%)
Place of birth for the foreign-born population - Uganda (%)
Place of birth for the foreign-born population - Zimbabwe (%)
Place of birth for the foreign-born population - Other Eastern Africa (%)
Place of birth for the foreign-born population - Cameroon (%)
Place of birth for the foreign-born population - Congo (%)
Place of birth for the foreign-born population - Democratic Republic of Congo (Zaire) (%)
Place of birth for the foreign-born population - Other Middle Africa (%)
Place of birth for the foreign-born population - Egypt (%)
Place of birth for the foreign-born population - Morocco (%)
Place of birth for the foreign-born population - Sudan (%)
Place of birth for the foreign-born population - Other Northern Africa (%)
Place of birth for the foreign-born population - South Africa (%)
Place of birth for the foreign-born population - Other Southern Africa (%)
Place of birth for the foreign-born population - Cabo Verde (%)
Place of birth for the foreign-born population - Ghana (%)
Place of birth for the foreign-born population - Liberia (%)
Place of birth for the foreign-born population - Nigeria (%)
Place of birth for the foreign-born population - Senegal (%)
Place of birth for the foreign-born population - Sierra Leone (%)
Place of birth for the foreign-born population - Other Western Africa (%)
Place of birth for the foreign-born population - Australia (%)
Place of birth for the foreign-born population - New Zealand (%)
Place of birth for the foreign-born population - Fiji (%)
Place of birth for the foreign-born population - Micronesia (%)
Place of birth for the foreign-born population - Bahamas (%)
Place of birth for the foreign-born population - Barbados (%)
Place of birth for the foreign-born population - Cuba (%)
Place of birth for the foreign-born population - Dominica (%)
Place of birth for the foreign-born population - Dominican Republic (%)
Place of birth for the foreign-born population - Grenada (%)
Place of birth for the foreign-born population - Haiti (%)
Place of birth for the foreign-born population - Jamaica (%)
Place of birth for the foreign-born population - St. Vincent and the Grenadines (%)
Place of birth for the foreign-born population - Trinidad and Tobago (%)
Place of birth for the foreign-born population - West Indies (%)
Place of birth for the foreign-born population - Other Caribbean (%)
Place of birth for the foreign-born population - Belize (%)
Place of birth for the foreign-born population - Costa Rica (%)
Place of birth for the foreign-born population - El Salvador (%)
Place of birth for the foreign-born population - Guatemala (%)
Place of birth for the foreign-born population - Honduras (%)
Place of birth for the foreign-born population - Mexico (%)
Place of birth for the foreign-born population - Nicaragua (%)
Place of birth for the foreign-born population - Panama (%)
Place of birth for the foreign-born population - Other Central America (%)
Place of birth for the foreign-born population - Argentina (%)
Place of birth for the foreign-born population - Bolivia (%)
Place of birth for the foreign-born population - Brazil (%)
Place of birth for the foreign-born population - Chile (%)
Place of birth for the foreign-born population - Colombia (%)
Place of birth for the foreign-born population - Ecuador (%)
Place of birth for the foreign-born population - Guyana (%)
Place of birth for the foreign-born population - Peru (%)
Place of birth for the foreign-born population - Uruguay (%)
Place of birth for the foreign-born population - Venezuela (%)
Place of birth for the foreign-born population - Other South America (%)
Place of birth for the foreign-born population - Canada (%)
Place of birth for the foreign-born population - Other Northern America (%)
Place of birth for the foreign-born population - Other (%)
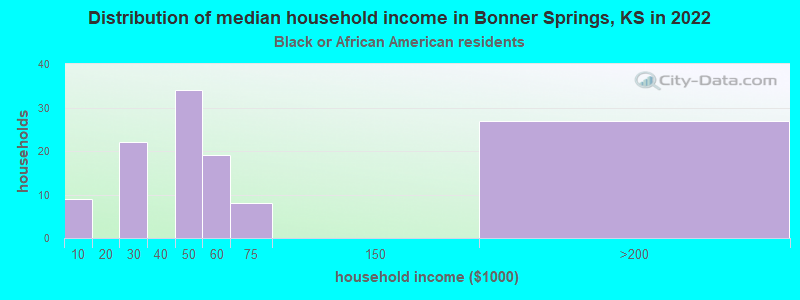
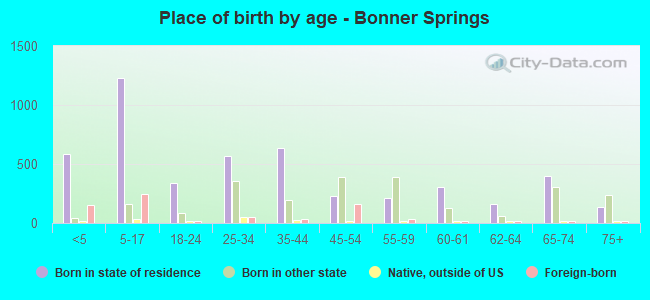
According to 2022 data, the most numerous races in Bonner Springs, KS are White alone (5,596 residents), Hispanic (764 residents), and Black alone (228 residents). 89.0% of Bonner Springs residents speak English at home. 8.2% of Bonner Springs, KS residents are foreign-born (4.6% born in Asia, 3.4% born in Latin America), which is 14.8% greater than the foreign-born rate of 7.0% across the entire state of Kansas.
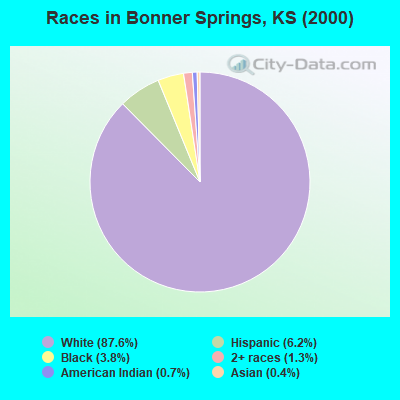
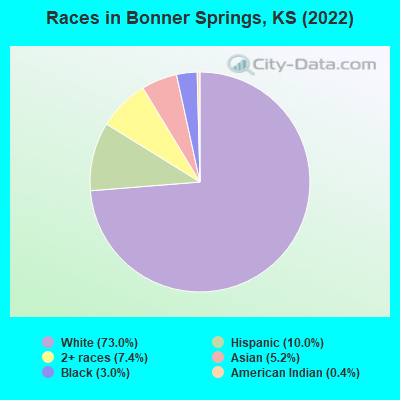
Race distribution in Bonner Springs
2000 2022
2,233,997 83.1% White alone 188,252 7.0% Hispanic 151,407 5.6% Black alone 46,301 1.7% Asian alone 42,508 1.6% Two or more races 22,322 0.8% American Indian alone 2,477 0.09% Other race alone 1,154 0.04% Native Hawaiian and Other
2,147,943 73.1% White alone 381,746 13.0% Hispanic 147,666 5.0% Black alone 145,362 4.9% Two or more races 85,085 2.9% Asian alone 13,263 0.5% Other race alone 12,065 0.4% American Indian alone 4,020 0.1% Native Hawaiian and Other
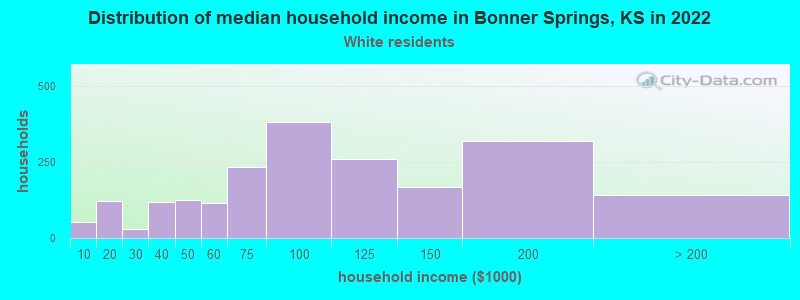
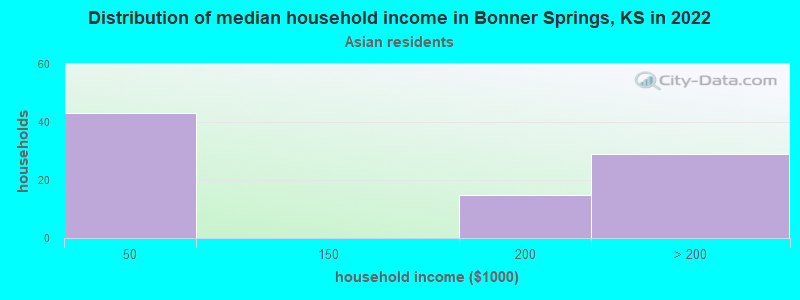
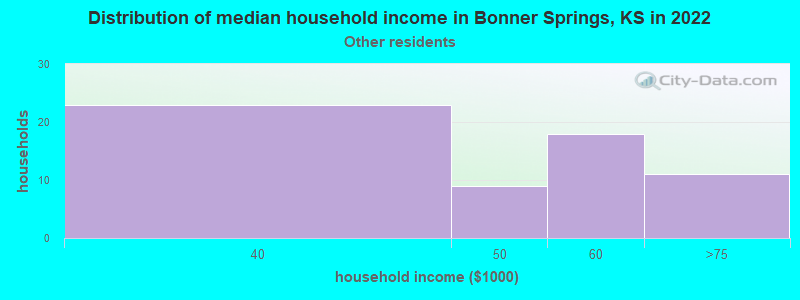
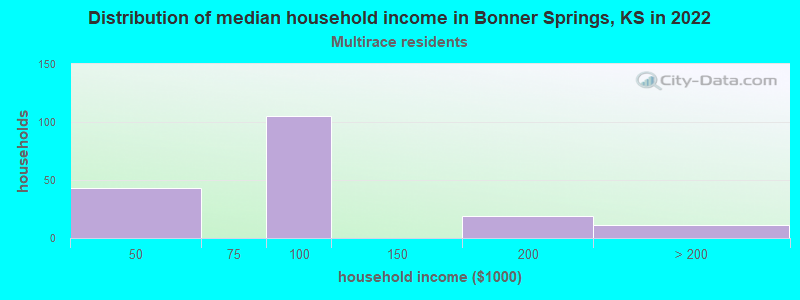
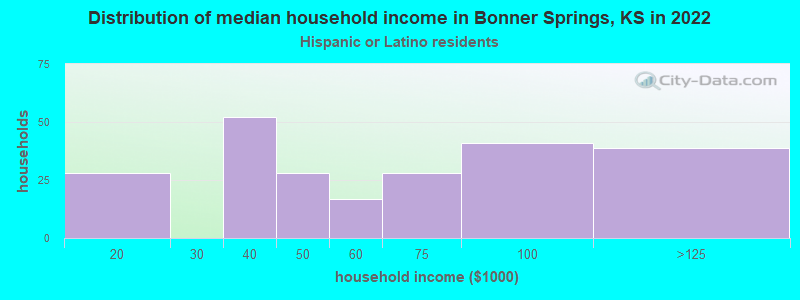
Income and house value in Bonner Springs Median household income in 2022 $79,479 White non-Hispanic householders$48,906 Black householders$50,156 Some other race householders$94,760 Two or more races householders$62,242 Hispanic or Latino race householdersMedian 2022 house value $276,588 White Non-Hispanic householders$241,858 Black or African American householders$86,042 American Indian or Alaska Native householders$140,797 Some other race householders$153,938 Two or more races householders$141,736 Hispanic or Latino householders
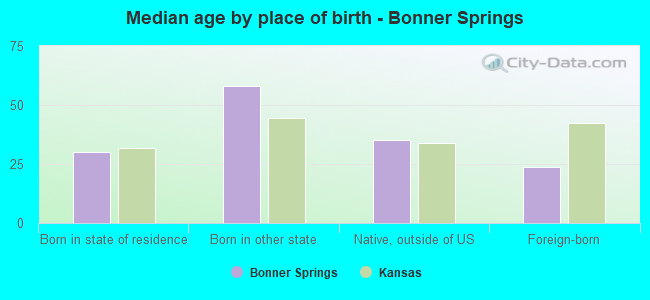
Median age by race in Bonner Springs
45.0 Median age for White residents44.4 45.6 30.9 Median age for Black or African American residents25.8 30.4 29.0 Median age for American Indian / Alaska Native residents-668,539,325.2 -572,972,972.4 11.5 Median age for Asian residents11.5 14.0 -627,039,626.4 Median age for Native Hawaiian / Pacific Islander residents-669,240,668.6 -641,269,840.6 15.4 Median age for Other race residents9.8 34.8 11.6 Median age for Two or more races residents9.4 16.6 43.0 Median age for White alone residents41.1 45.5 23.8 Median age for Hispanic or Latino residents16.2 31.6
Owner/renter occupied households by race in Bonner Springs
House owners and renters - White residents 1,612 76.7% Owner occupied489 23.3% Renter occupiedHouse owners and renters - Black or African American residents 38 33.6% Owner occupied75 66.4% Renter occupiedHouse owners and renters - American Indian / Alaska Native residents 50 100.0% Renter occupiedHouse owners and renters - Asian residents 48 59.5% Owner occupied33 40.5% Renter occupiedHouse owners and renters - Other race residents 82 84.4% Owner occupied15 15.6% Renter occupiedHouse owners and renters - Two or more races residents 111 58.5% Owner occupied79 41.5% Renter occupiedHouse owners and renters - White alone residents 1,728 78.6% Owner occupied469 21.4% Renter occupiedHouse owners and renters - Hispanic or Latino residents 104 50.9% Owner occupied100 49.1% Renter occupied
Language usage in Bonner Springs
English speakers - Total 89.0% of residents of Bonner Springs speak English at home.
4.5% of residents speak Spanish at home 150 47.0% Speak English very well169 53.0% Speak English less than very well5.4% of residents speak other language at home 149 39.2% Speak English very well231 60.8% Speak English less than very well
English speakers - Born in the United States 96.0% of residents of Bonner Springs speak English at home.
1.0% of residents speak Spanish at home 23 100.0% Speak English very well1.4% of residents speak other language at home 19 59.4% Speak English very well13 40.6% Speak English less than very well
English speakers - Native, born elsewhere 83.1% of residents of Bonner Springs speak English at home.
10.2% of residents speak Spanish at home 12 100.0% Speak English very well
English speakers - Foreign-born 13.9% of residents of Bonner Springs speak English at home.
35.6% of residents speak Spanish at home 25 13.9% Speak English very well155 86.1% Speak English less than very well53.7% of residents speak other language at home 67 24.7% Speak English very well204 75.3% Speak English less than very well
White (Caucasian) - Speak another language Native:
0.8% (42)Foreign-born:
87.5% (39)
Asian - Speak another language Native:
100.0% (30)Foreign-born:
100.0% (275)
Other race - Speak only English Native:
59.7% (151)Foreign-born:
56.8% (86)
Other race - Speak another language Native:
39.6% (100)Foreign-born:
54.5% (82)
Hispanic or Latino - Speak only English Native:
72.5% (319)Foreign-born:
39.1% (95)
Hispanic or Latino - Speak another language Native:
28.9% (127)Foreign-born:
73.8% (179)
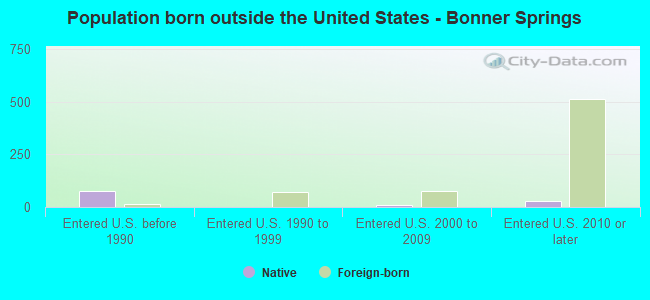
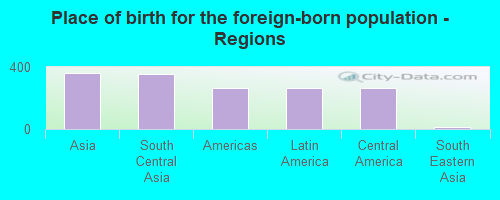
Foreign-born residents in Bonner Springs 630 residents are foreign born (4.6% Asia , 3.4% Latin America ).
This city:
8.2%Kansas:
7.1%
Marital status for residents in Bonner Springs Marital status - White (Caucasian) population 15 years and over
Males 26.9% Never married61.5% Now married0.0% Separated2.7% Widowed9.0% DivorcedFemales 18.7% Never married57.6% Now married0.0% Separated7.6% Widowed16.1% DivorcedWomen who gave birth in the past 12 months Now married:
80.4% (33)Unmarried:
19.6% (8)
Women who did not give birth in the past 12 months Now married:
50.0% (481)Unmarried:
50.0% (481)
Marital status - Black or African American population 15 years and over
Males 54.4% Never married20.4% Now married0.0% Separated8.7% Widowed16.5% DivorcedFemales 64.9% Never married22.8% Now married0.0% Separated0.0% Widowed12.3% DivorcedWomen who did not give birth in the past 12 months Now married:
10.3% (7)Unmarried:
89.7% (62)
Marital status - Asian population 15 years and over
Males 0.0% Never married100.0% Now married0.0% Separated0.0% Widowed0.0% DivorcedFemales 0.0% Never married100.0% Now married0.0% Separated0.0% Widowed0.0% DivorcedWomen who did not give birth in the past 12 months Now married:
100.0% (73)Unmarried:
0.0% (0)
Marital status - Other race population 15 years and over
Males 35.9% Never married64.1% Now married0.0% Separated0.0% Widowed0.0% DivorcedFemales 0.0% Never married100.0% Now married0.0% Separated0.0% Widowed0.0% DivorcedWomen who gave birth in the past 12 months Now married:
100.0% (18)Unmarried:
0.0% (0)
Women who did not give birth in the past 12 months Now married:
100.0% (65)Unmarried:
0.0% (0)
Marital status - Two or more races population 15 years and over
Males 24.5% Never married75.5% Now married0.0% Separated0.0% Widowed0.0% DivorcedFemales 69.3% Never married29.5% Now married0.0% Separated0.0% Widowed1.1% DivorcedWomen who did not give birth in the past 12 months Now married:
10.3% (20)Unmarried:
89.7% (173)
Marital status - White alone, not Hispanic / Latino population 15 years and over
Males 26.8% Never married61.3% Now married0.0% Separated2.8% Widowed9.1% DivorcedFemales 18.2% Never married57.5% Now married0.0% Separated7.8% Widowed16.5% DivorcedWomen who gave birth in the past 12 months Now married:
80.4% (39)Unmarried:
19.6% (9)
Women who did not give birth in the past 12 months Now married:
49.4% (527)Unmarried:
50.6% (540)
Marital status - Hispanic or Latino population 15 years and over
Males 36.5% Never married61.6% Now married0.0% Separated0.0% Widowed1.8% DivorcedFemales 29.2% Never married70.8% Now married0.0% Separated0.0% Widowed0.0% DivorcedWomen who gave birth in the past 12 months Now married:
100.0% (15)Unmarried:
0.0% (0)
Women who did not give birth in the past 12 months Now married:
59.6% (92)Unmarried:
40.4% (62)
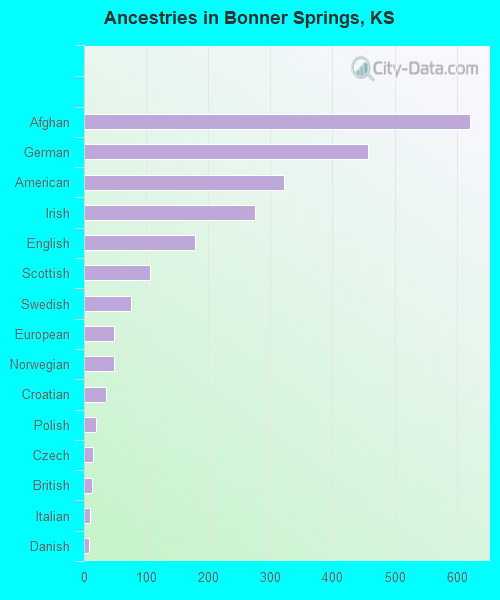
Ancestries in Bonner Springs
621 20.8% Afghan458 15.3% German322 10.8% American276 9.2% Irish178 6.0% English107 3.6% Scottish75 2.5% Swedish49 1.6% European49 1.6% Norwegian36 1.2% Croatian20 0.7% Polish14 0.5% Czech13 0.4% British9 0.3% Italian8 0.3% Danish5 0.2% French3 0.1% Dutch3 0.1% Northern European1 0.03% French Canadian1 0.03% Scotch-Irish
Children Nativity (place of birth) in Bonner Springs
Children under 6 years - Living with two parents Both parents native 400 100.0% NativeBoth parents foreign-born 133 100.0% Foreign-bornOne native, one foreign-born parent 19 100.0% NativeChildren under 6 years - Living with one parent Native parent 228 100.0% NativeChildren 6 to 17 years - Living with two parents Both parents native 661 100.0% NativeBoth parents foreign-born 57 20.0% Native228 80.0% Foreign-bornOne native, one foreign-born parent 15 100.0% NativeChildren 6 to 17 years - Living with one parent Native parent 457 100.0% Native
Grandparents responsible for own grandchildren in Bonner Springs
Grandparents (30 to 59 years) White / Caucasian 13 43.0% Responsible for grandchildren18 57.0% Not responsible for grandchildrenWhite alone, not Hispanic / Latino 7 27.2% Responsible for grandchildren19 72.8% Not responsible for grandchildrenHispanic or Latino 15 100.0% Not responsible for grandchildrenGrandparents (60 years and over) White / Caucasian 11 24.9% Responsible for grandchildren34 75.1% Not responsible for grandchildrenWhite alone, not Hispanic / Latino 9 22.4% Responsible for grandchildren33 77.6% Not responsible for grandchildren