Races in Boone, Iowa (IA) Detailed Stats
Data:
Races - White alone (%)
Races - White alone (% change since 2000)
Races - Black alone (%)
Races - Black alone (% change since 2000)
Races - American Indian alone (%)
Races - American Indian alone (% change since 2000)
Races - Asian alone (%)
Races - Asian alone (% change since 2000)
Races - Hispanic (%)
Races - Hispanic (% change since 2000)
Races - Native Hawaiian and Other Pacific Islander alone (%)
Races - Native Hawaiian and Other Pacific Islander alone (% change since 2000)
Races - Two or more races(%)
Races - Two or more races(% change since 2000)
Races - Other race alone (%)
Races - Other race alone (% change since 2000)
Racial diversity
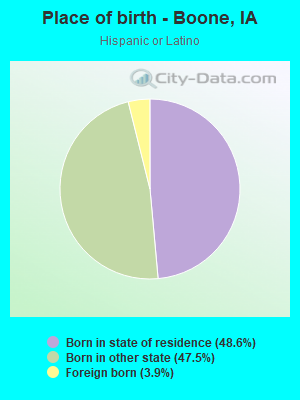
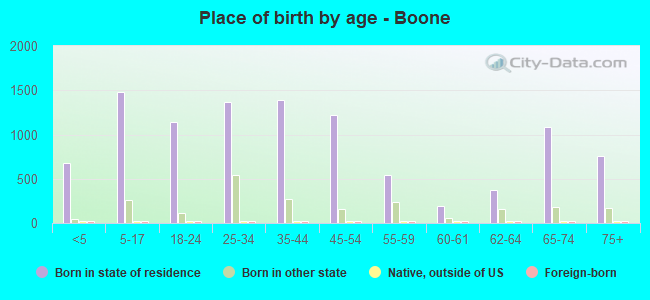
Place of birth - Born in state of residence (%)
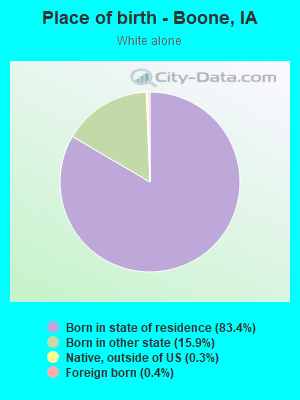
Place of birth - Born in state of residence (%) - White
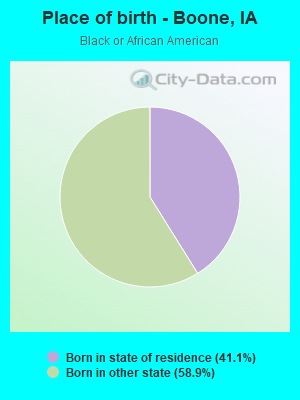
Place of birth - Born in state of residence (%) - Black or African American
Place of birth - Born in state of residence (%) - Asian
Place of birth - Born in state of residence (%) - Hispanic or Latino
Place of birth - Born in state of residence (%) - American Indian and Alaska Native
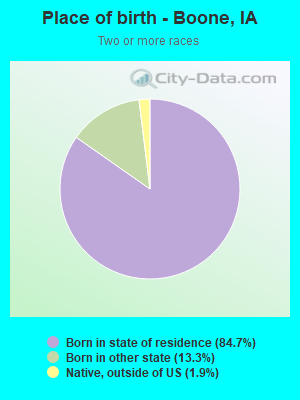
Place of birth - Born in state of residence (%) - Multirace
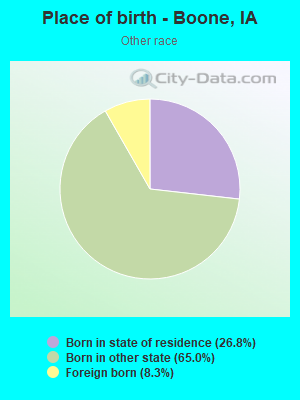
Place of birth - Born in state of residence (%) - Other Race
Place of birth - Born in other state (%)
Place of birth - Born in other state (%) - White
Place of birth - Born in other state (%) - Black or African American
Place of birth - Born in other state (%) - Asian
Place of birth - Born in other state (%) - Hispanic or Latino
Place of birth - Born in other state (%) - American Indian and Alaska Native
Place of birth - Born in other state (%) - Multirace
Place of birth - Born in other state (%) - Other Race
Place of birth - Native, outside of US (%)
Place of birth - Native, outside of US (%) - White
Place of birth - Native, outside of US (%) - Black or African American
Place of birth - Native, outside of US (%) - Asian
Place of birth - Native, outside of US (%) - Hispanic or Latino
Place of birth - Native, outside of US (%) - American Indian and Alaska Native
Place of birth - Native, outside of US (%) - Multirace
Place of birth - Native, outside of US (%) - Other Race
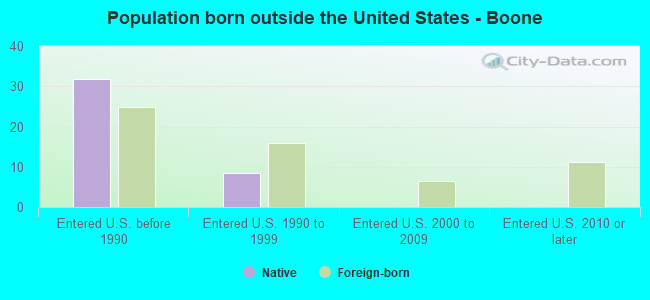
Place of birth - Foreign born (%)
Place of birth - Foreign born (%) - White
Place of birth - Foreign born (%) - Black or African American
Place of birth - Foreign born (%) - Asian
Place of birth - Foreign born (%) - Hispanic or Latino
Place of birth - Foreign born (%) - American Indian and Alaska Native
Place of birth - Foreign born (%) - Multirace
Place of birth - Foreign born (%) - Other Race
Residents speaking English at home (%)
Residents speaking English at home - Born in the United States (%)
Residents speaking English at home - Native, born elsewhere (%)
Residents speaking English at home - Foreign born (%)
Residents speaking Spanish at home (%)
Residents speaking Spanish at home - Born in the United States (%)
Residents speaking Spanish at home - Native, born elsewhere (%)
Residents speaking Spanish at home - Foreign born (%)
Residents speaking other language at home (%)
Residents speaking other language at home - Born in the United States (%)
Residents speaking other language at home - Native, born elsewhere (%)
Residents speaking other language at home - Foreign born (%)
Marital status - Never married (%)
Marital status - Now married (%)
Marital status - Separated (%)
Marital status - Widowed (%)
Marital status - Divorced (%)
Ancestries Reported - Arab (%)
Ancestries Reported - Czech (%)
Ancestries Reported - Danish (%)
Ancestries Reported - Dutch (%)
Ancestries Reported - English (%)
Ancestries Reported - French (%)
Ancestries Reported - French Canadian (%)
Ancestries Reported - German (%)
Ancestries Reported - Greek (%)
Ancestries Reported - Hungarian (%)
Ancestries Reported - Irish (%)
Ancestries Reported - Italian (%)
Ancestries Reported - Lithuanian (%)
Ancestries Reported - Norwegian (%)
Ancestries Reported - Polish (%)
Ancestries Reported - Portuguese (%)
Ancestries Reported - Russian (%)
Ancestries Reported - Scotch-Irish (%)
Ancestries Reported - Scottish (%)
Ancestries Reported - Slovak (%)
Ancestries Reported - Subsaharan African (%)
Ancestries Reported - Swedish (%)
Ancestries Reported - Swiss (%)
Ancestries Reported - Ukrainian (%)
Ancestries Reported - United States (%)
Ancestries Reported - Welsh (%)
Ancestries Reported - West Indian (%)
Ancestries Reported - Other (%)
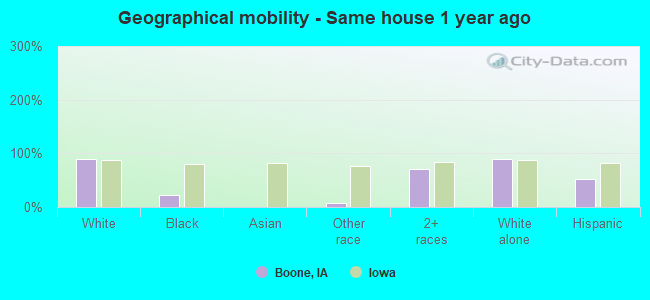
Geographical mobility - Same house 1 year ago (%)
Geographical mobility - Same house 1 year ago (%) - White
Geographical mobility - Same house 1 year ago (%) - Black or African American
Geographical mobility - Same house 1 year ago (%) - Asian
Geographical mobility - Same house 1 year ago (%) - Hispanic or Latino
Geographical mobility - Same house 1 year ago (%) - American Indian and Alaska Native
Geographical mobility - Same house 1 year ago (%) - Multirace
Geographical mobility - Same house 1 year ago (%) - Other Race
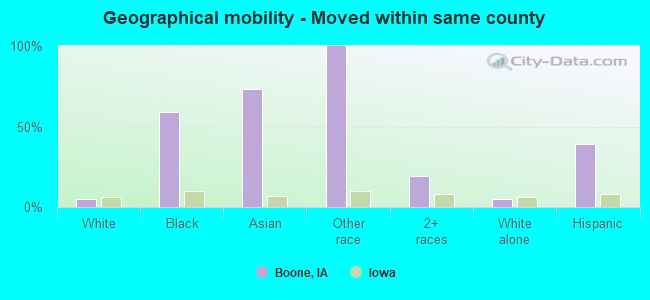
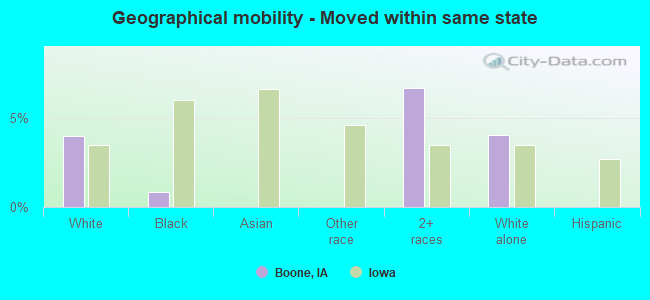
Geographical mobility - Moved within same county (%)
Geographical mobility - Moved within same county (%) - White
Geographical mobility - Moved within same county (%) - Black or African American
Geographical mobility - Moved within same county (%) - Asian
Geographical mobility - Moved within same county (%) - Hispanic or Latino
Geographical mobility - Moved within same county (%) - American Indian and Alaska Native
Geographical mobility - Moved within same county (%) - Multirace
Geographical mobility - Moved within same county (%) - Other Race
Geographical mobility - Moved from different county within same state (%)
Geographical mobility - Moved from different county within same state (%) - White
Geographical mobility - Moved from different county within same state (%) - Black or African American
Geographical mobility - Moved from different county within same state (%) - Asian
Geographical mobility - Moved from different county within same state (%) - Hispanic or Latino
Geographical mobility - Moved from different county within same state (%) - American Indian and Alaska Native
Geographical mobility - Moved from different county within same state (%) - Multirace
Geographical mobility - Moved from different county within same state (%) - Other Race
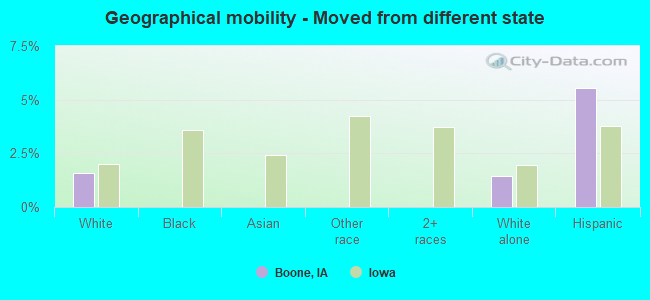
Geographical mobility - Moved from different state (%)
Geographical mobility - Moved from different state (%) - White
Geographical mobility - Moved from different state (%) - Black or African American
Geographical mobility - Moved from different state (%) - Asian
Geographical mobility - Moved from different state (%) - Hispanic or Latino
Geographical mobility - Moved from different state (%) - American Indian and Alaska Native
Geographical mobility - Moved from different state (%) - Multirace
Geographical mobility - Moved from different state (%) - Other Race
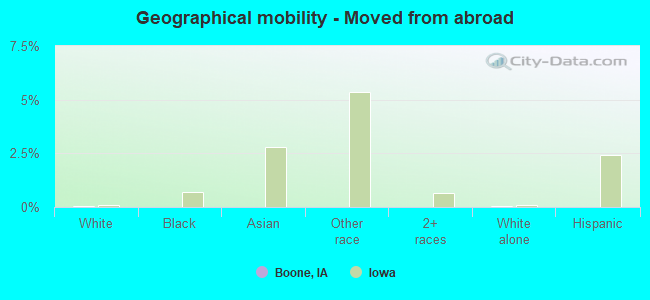
Geographical mobility - Moved from abroad (%)
Geographical mobility - Moved from abroad (%) - White
Geographical mobility - Moved from abroad (%) - Black or African American
Geographical mobility - Moved from abroad (%) - Asian
Geographical mobility - Moved from abroad (%) - Hispanic or Latino
Geographical mobility - Moved from abroad (%) - American Indian and Alaska Native
Geographical mobility - Moved from abroad (%) - Multirace
Geographical mobility - Moved from abroad (%) - Other Race
Place of birth for the foreign-born population - Ireland (%)
Place of birth for the foreign-born population - Denmark (%)
Place of birth for the foreign-born population - Norway (%)
Place of birth for the foreign-born population - Sweden (%)
Place of birth for the foreign-born population - United Kingdom (%)
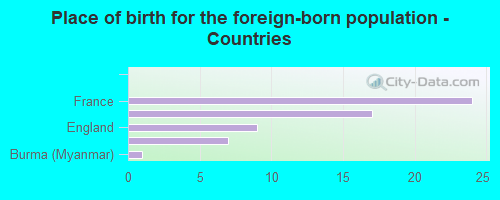
Place of birth for the foreign-born population - England (%)
Place of birth for the foreign-born population - Scotland (%)
Place of birth for the foreign-born population - Other Northern Europe (%)
Place of birth for the foreign-born population - Austria (%)
Place of birth for the foreign-born population - Belgium (%)
Place of birth for the foreign-born population - France (%)
Place of birth for the foreign-born population - Germany (%)
Place of birth for the foreign-born population - Netherlands (%)
Place of birth for the foreign-born population - Switzerland (%)
Place of birth for the foreign-born population - Other Western Europe (%)
Place of birth for the foreign-born population - Greece (%)
Place of birth for the foreign-born population - Italy (%)
Place of birth for the foreign-born population - Portugal (%)
Place of birth for the foreign-born population - Spain (%)
Place of birth for the foreign-born population - Other Southern Europe (%)
Place of birth for the foreign-born population - Albania (%)
Place of birth for the foreign-born population - Belarus (%)
Place of birth for the foreign-born population - Bosnia and Herzegovina (%)
Place of birth for the foreign-born population - Bulgaria (%)
Place of birth for the foreign-born population - Croatia (%)
Place of birth for the foreign-born population - Czechoslovakia (%)
Place of birth for the foreign-born population - Hungary (%)
Place of birth for the foreign-born population - Latvia (%)
Place of birth for the foreign-born population - Lithuania (%)
Place of birth for the foreign-born population - North Macedonia (Macedonia) (%)
Place of birth for the foreign-born population - Moldova (%)
Place of birth for the foreign-born population - Poland (%)
Place of birth for the foreign-born population - Romania (%)
Place of birth for the foreign-born population - Russia (%)
Place of birth for the foreign-born population - Serbia (%)
Place of birth for the foreign-born population - Ukraine (%)
Place of birth for the foreign-born population - Other Eastern Europe (%)
Place of birth for the foreign-born population - China (%)
Place of birth for the foreign-born population - Hong Kong (%)
Place of birth for the foreign-born population - Taiwan (%)
Place of birth for the foreign-born population - Japan (%)
Place of birth for the foreign-born population - Korea (%)
Place of birth for the foreign-born population - Other Eastern Asia (%)
Place of birth for the foreign-born population - Afghanistan (%)
Place of birth for the foreign-born population - Bangladesh (%)
Place of birth for the foreign-born population - India (%)
Place of birth for the foreign-born population - Iran (%)
Place of birth for the foreign-born population - Kazakhstan (%)
Place of birth for the foreign-born population - Nepal (%)
Place of birth for the foreign-born population - Pakistan (%)
Place of birth for the foreign-born population - Sri Lanka (%)
Place of birth for the foreign-born population - Uzbekistan (%)
Place of birth for the foreign-born population - Other South Central Asia (%)
Place of birth for the foreign-born population - Burma (%)
Place of birth for the foreign-born population - Cambodia (%)
Place of birth for the foreign-born population - Indonesia (%)
Place of birth for the foreign-born population - Laos (%)
Place of birth for the foreign-born population - Malaysia (%)
Place of birth for the foreign-born population - Philippines (%)
Place of birth for the foreign-born population - Singapore (%)
Place of birth for the foreign-born population - Thailand (%)
Place of birth for the foreign-born population - Vietnam (%)
Place of birth for the foreign-born population - Other South Eastern Asia (%)
Place of birth for the foreign-born population - Armenia (%)
Place of birth for the foreign-born population - Iraq (%)
Place of birth for the foreign-born population - Israel (%)
Place of birth for the foreign-born population - Jordan (%)
Place of birth for the foreign-born population - Kuwait (%)
Place of birth for the foreign-born population - Lebanon (%)
Place of birth for the foreign-born population - Saudi Arabia (%)
Place of birth for the foreign-born population - Syria (%)
Place of birth for the foreign-born population - Turkey (%)
Place of birth for the foreign-born population - Yemen (%)
Place of birth for the foreign-born population - Other Western Asia (%)
Place of birth for the foreign-born population - Eritrea (%)
Place of birth for the foreign-born population - Ethiopia (%)
Place of birth for the foreign-born population - Kenya (%)
Place of birth for the foreign-born population - Somalia (%)
Place of birth for the foreign-born population - Uganda (%)
Place of birth for the foreign-born population - Zimbabwe (%)
Place of birth for the foreign-born population - Other Eastern Africa (%)
Place of birth for the foreign-born population - Cameroon (%)
Place of birth for the foreign-born population - Congo (%)
Place of birth for the foreign-born population - Democratic Republic of Congo (Zaire) (%)
Place of birth for the foreign-born population - Other Middle Africa (%)
Place of birth for the foreign-born population - Egypt (%)
Place of birth for the foreign-born population - Morocco (%)
Place of birth for the foreign-born population - Sudan (%)
Place of birth for the foreign-born population - Other Northern Africa (%)
Place of birth for the foreign-born population - South Africa (%)
Place of birth for the foreign-born population - Other Southern Africa (%)
Place of birth for the foreign-born population - Cabo Verde (%)
Place of birth for the foreign-born population - Ghana (%)
Place of birth for the foreign-born population - Liberia (%)
Place of birth for the foreign-born population - Nigeria (%)
Place of birth for the foreign-born population - Senegal (%)
Place of birth for the foreign-born population - Sierra Leone (%)
Place of birth for the foreign-born population - Other Western Africa (%)
Place of birth for the foreign-born population - Australia (%)
Place of birth for the foreign-born population - New Zealand (%)
Place of birth for the foreign-born population - Fiji (%)
Place of birth for the foreign-born population - Micronesia (%)
Place of birth for the foreign-born population - Bahamas (%)
Place of birth for the foreign-born population - Barbados (%)
Place of birth for the foreign-born population - Cuba (%)
Place of birth for the foreign-born population - Dominica (%)
Place of birth for the foreign-born population - Dominican Republic (%)
Place of birth for the foreign-born population - Grenada (%)
Place of birth for the foreign-born population - Haiti (%)
Place of birth for the foreign-born population - Jamaica (%)
Place of birth for the foreign-born population - St. Vincent and the Grenadines (%)
Place of birth for the foreign-born population - Trinidad and Tobago (%)
Place of birth for the foreign-born population - West Indies (%)
Place of birth for the foreign-born population - Other Caribbean (%)
Place of birth for the foreign-born population - Belize (%)
Place of birth for the foreign-born population - Costa Rica (%)
Place of birth for the foreign-born population - El Salvador (%)
Place of birth for the foreign-born population - Guatemala (%)
Place of birth for the foreign-born population - Honduras (%)
Place of birth for the foreign-born population - Mexico (%)
Place of birth for the foreign-born population - Nicaragua (%)
Place of birth for the foreign-born population - Panama (%)
Place of birth for the foreign-born population - Other Central America (%)
Place of birth for the foreign-born population - Argentina (%)
Place of birth for the foreign-born population - Bolivia (%)
Place of birth for the foreign-born population - Brazil (%)
Place of birth for the foreign-born population - Chile (%)
Place of birth for the foreign-born population - Colombia (%)
Place of birth for the foreign-born population - Ecuador (%)
Place of birth for the foreign-born population - Guyana (%)
Place of birth for the foreign-born population - Peru (%)
Place of birth for the foreign-born population - Uruguay (%)
Place of birth for the foreign-born population - Venezuela (%)
Place of birth for the foreign-born population - Other South America (%)
Place of birth for the foreign-born population - Canada (%)
Place of birth for the foreign-born population - Other Northern America (%)
Place of birth for the foreign-born population - Other (%)
Latest news about races in Boone, IA collected exclusively by city-data.com from local newspapers, TV, and radio stations
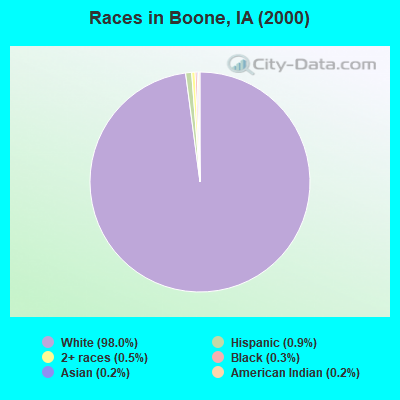
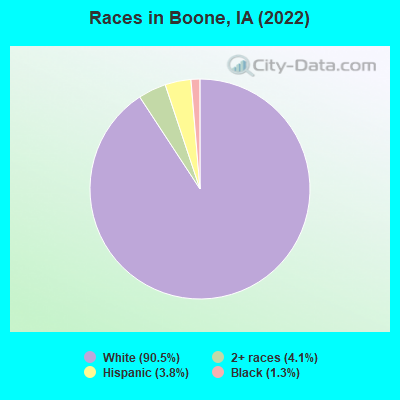
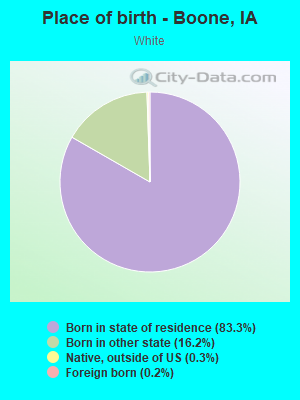
According to 2022 data, the most numerous races in Boone, IA are White alone (11,339 residents), Hispanic (479 residents), and Black alone (167 residents). 97.7% of Boone residents speak English at home. 0.5% of Boone, IA residents are foreign-born , which is 961.7% less than the foreign-born rate of 5.0% across the entire state of Iowa.
Race distribution in Boone
2000 2022
2,710,344 92.6% White alone 82,473 2.8% Hispanic 60,744 2.1% Black alone 36,345 1.2% Asian alone 25,472 0.9% Two or more races 7,955 0.3% American Indian alone 2,103 0.07% Other race alone 888 0.03% Native Hawaiian and Other
2,650,110 82.8% White alone 218,024 6.8% Hispanic 119,004 3.7% Black alone 115,286 3.6% Two or more races 74,892 2.3% Asian alone 9,260 0.3% Other race alone 8,595 0.3% Native Hawaiian and Other 5,346 0.2% American Indian alone
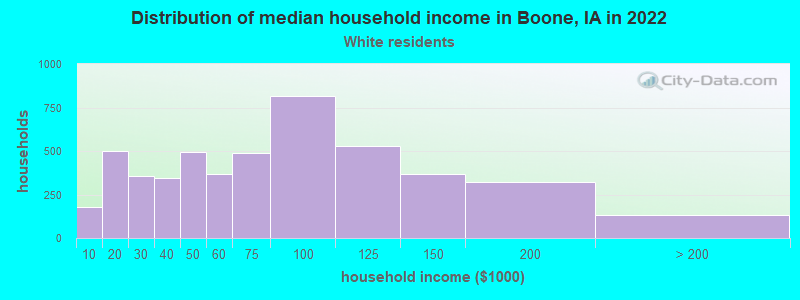
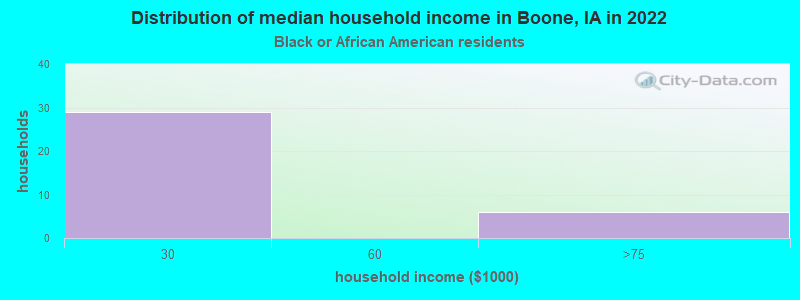
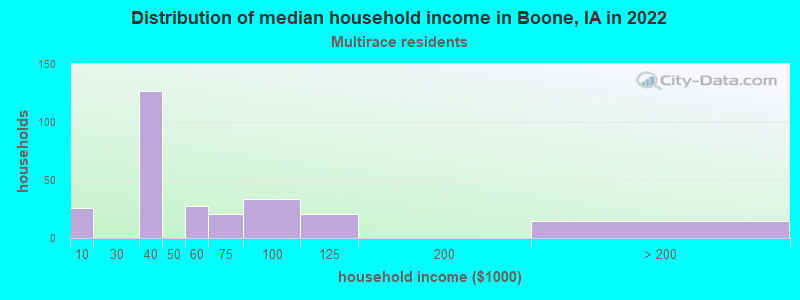
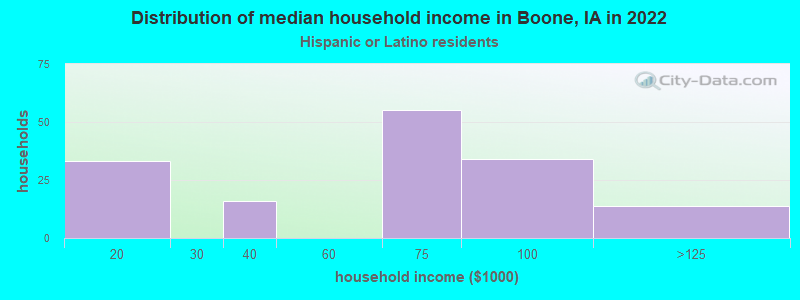
Income and house value in Boone Median household income in 2022 $65,209 White non-Hispanic householders$67,426 Hispanic or Latino race householdersMedian 2022 house value $155,367 White Non-Hispanic householders$172,375 Black or African American householders$22,981 American Indian or Alaska Native householders $40,220 Asian householders$114,916 Two or more races householders
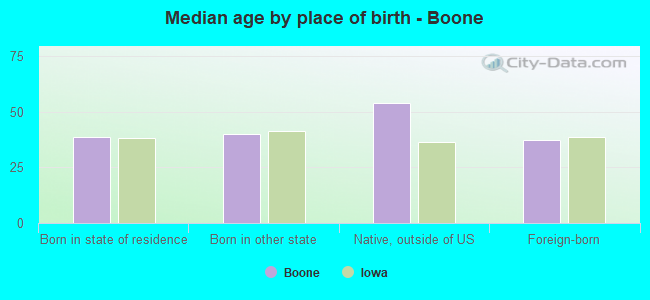
Median age by race in Boone
41.2 Median age for White residents39.1 44.4 30.6 Median age for Black or African American residents29.9 29.1 -660,397,073.5 Median age for American Indian / Alaska Native residents-654,282,765.1 -670,912,950.5 -719,077,567.4 Median age for Asian residents-729,641,693.1 -711,656,441.0 -580,729,166.1 Median age for Native Hawaiian / Pacific Islander residents-776,978,416.5 -504,347,825.6 21.3 Median age for Other race residents8.0 25.1 25.6 Median age for Two or more races residents25.3 22.8 41.2 Median age for White alone residents39.1 44.1 26.7 Median age for Hispanic or Latino residents22.4 28.4
Owner/renter occupied households by race in Boone
House owners and renters - White residents 3,730 75.8% Owner occupied1,191 24.2% Renter occupiedHouse owners and renters - Black or African American residents 26 100.0% Renter occupiedHouse owners and renters - Other race residents 53 100.0% Renter occupiedHouse owners and renters - Two or more races residents 90 31.3% Owner occupied197 68.7% Renter occupiedHouse owners and renters - White alone residents 3,738 76.0% Owner occupied1,182 24.0% Renter occupiedHouse owners and renters - Hispanic or Latino residents 59 40.8% Owner occupied85 59.2% Renter occupied
Language usage in Boone
English speakers - Total 97.7% of residents of Boone speak English at home.
2.0% of residents speak Spanish at home 211 91.3% Speak English very well20 8.7% Speak English less than very well0.1% of residents speak other language at home 10 90.9% Speak English very well1 9.1% Speak English less than very well
English speakers - Born in the United States 92.4% of residents of Boone speak English at home.
7.6% of residents speak Spanish at home 140 85.9% Speak English very well23 14.1% Speak English less than very well
All residents speak only English at home
English speakers - Foreign-born 50.8% of residents of Boone speak English at home.
32.8% of residents speak Spanish at home 20 100.0% Speak English very well18.0% of residents speak other language at home 11 100.0% Speak English very well
White (Caucasian) - Speak only English Native:
99.9% (10,670)Foreign-born:
95.4% (27)
White (Caucasian) - Speak another language Native:
0.5% (58)Foreign-born:
23.2% (7)
Other race - Speak another language Native:
72.1% (157)Foreign-born:
100.0% (25)
White alone - Speak only English Native:
99.4% (10,587)Foreign-born:
74.3% (30)
White alone - Speak another language Native:
0.6% (63)Foreign-born:
25.1% (10)
Hispanic or Latino - Speak another language Native:
34.3% (142)Foreign-born:
100.0% (19)
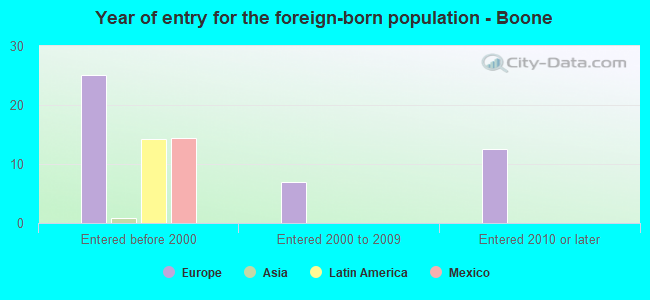
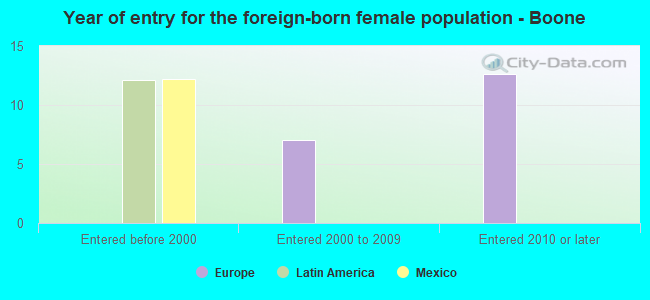
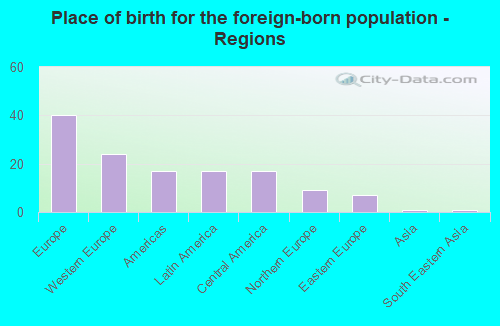
Foreign-born residents in Boone 59 residents are foreign born
Marital status for residents in Boone Marital status - White (Caucasian) population 15 years and over
Males 33.7% Never married47.3% Now married0.4% Separated2.5% Widowed16.0% DivorcedFemales 22.1% Never married49.2% Now married3.6% Separated11.4% Widowed13.7% DivorcedWomen who gave birth in the past 12 months Now married:
100.0% (138)Unmarried:
0.0% (0)
Women who did not give birth in the past 12 months Now married:
49.9% (1,196)Unmarried:
50.1% (1,202)
Marital status - Black or African American population 15 years and over
Males 76.8% Never married1.0% Now married12.1% Separated10.1% Widowed0.0% DivorcedFemales 61.9% Never married0.0% Now married0.0% Separated0.0% Widowed38.1% DivorcedWomen who did not give birth in the past 12 months Now married:
0.0% (0)Unmarried:
100.0% (25)
Marital status - Other race population 15 years and over
Males 44.3% Never married55.7% Now married0.0% Separated0.0% Widowed0.0% DivorcedFemales 0.0% Never married100.0% Now married0.0% Separated0.0% Widowed0.0% DivorcedWomen who did not give birth in the past 12 months Now married:
100.0% (67)Unmarried:
0.0% (0)
Marital status - Two or more races population 15 years and over
Males 73.8% Never married26.2% Now married0.0% Separated0.0% Widowed0.0% DivorcedFemales 59.7% Never married40.3% Now married0.0% Separated0.0% Widowed0.0% DivorcedWomen who gave birth in the past 12 months Now married:
100.0% (18)Unmarried:
0.0% (0)
Women who did not give birth in the past 12 months Now married:
37.3% (75)Unmarried:
62.7% (125)
Marital status - White alone, not Hispanic / Latino population 15 years and over
Males 33.5% Never married47.5% Now married0.4% Separated2.6% Widowed16.0% DivorcedFemales 21.8% Never married49.6% Now married3.6% Separated11.5% Widowed13.5% DivorcedWomen who gave birth in the past 12 months Now married:
100.0% (141)Unmarried:
0.0% (0)
Women who did not give birth in the past 12 months Now married:
50.2% (1,209)Unmarried:
49.8% (1,198)
Marital status - Hispanic or Latino population 15 years and over
Males 59.2% Never married40.8% Now married0.0% Separated0.0% Widowed0.0% DivorcedFemales 18.8% Never married69.5% Now married0.0% Separated0.0% Widowed11.7% DivorcedWomen who did not give birth in the past 12 months Now married:
78.8% (98)Unmarried:
21.2% (26)
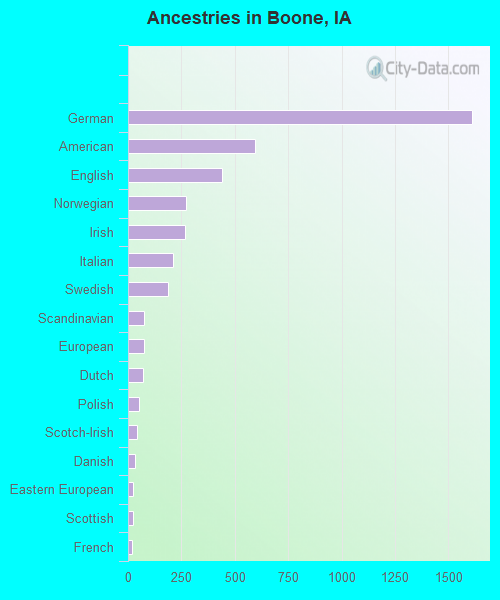
Ancestries in Boone
1,610 34.4% German597 12.8% American440 9.4% English273 5.8% Norwegian265 5.7% Irish210 4.5% Italian187 4.0% Swedish75 1.6% Scandinavian73 1.6% European71 1.5% Dutch53 1.1% Polish43 0.9% Scotch-Irish33 0.7% Danish23 0.5% Eastern European22 0.5% Scottish17 0.4% French12 0.3% British9 0.2% Czech9 0.2% French Canadian5 0.1% Welsh3 0.06% Serbian
Children Nativity (place of birth) in Boone
Children under 6 years - Living with two parents Both parents native 570 100.0% NativeChildren under 6 years - Living with one parent Native parent 257 100.0% Native
Children 6 to 17 years - Living with two parents Both parents native 1,014 100.0% NativeChildren 6 to 17 years - Living with one parent Native parent 516 100.0% Native
Grandparents responsible for own grandchildren in Boone
Grandparents (30 to 59 years) White / Caucasian 34 100.0% Not responsible for grandchildrenBlack or African American 7 100.0% Responsible for grandchildrenWhite alone, not Hispanic / Latino 40 100.0% Not responsible for grandchildrenGrandparents (60 years and over) White / Caucasian 53 43.9% Responsible for grandchildren68 56.1% Not responsible for grandchildrenWhite alone, not Hispanic / Latino 53 42.9% Responsible for grandchildren71 57.1% Not responsible for grandchildren