Races in Boston, New York (NY) Detailed Stats
Ancestries, Foreign-born residents, place of birth

Recent posts about races in Boston, New York on our local forum with over 2,400,000 registered users:
 | How come many ethnicities have the "NYC" accent, despite the history of NYC segregation? (45 replies) |
| smaller Upstate NY cities and towns/African American communities (5985 replies) |
| moving to Albany Area from Boston (10 replies) |
| Moving to Upstate NY from Boston (4 replies) |
| Racist incidents against Asians increasing? (236 replies) |
| Culturally diverse areas in Upstate NY (165 replies) |
Latest news about races in Boston, NY collected exclusively by city-data.com from local newspapers, TV, and radio stations
3.2% of Boston, NY residents are foreign-born (1.7% born in Europe, 0.7% born in North America, 0.5% born in Asia), which is 597.7% less than the foreign-born rate of 22.0% across the entire state of New York.
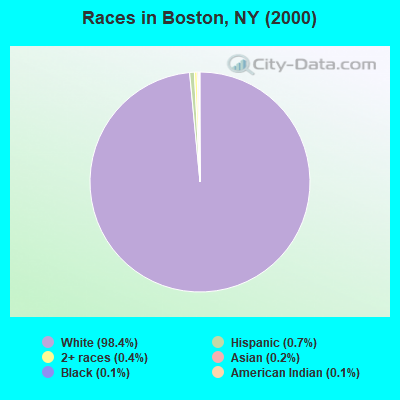
Race distribution in Boston

- 7,76998.4%White alone
- 570.7%Hispanic
- 330.4%Two or more races
- 160.2%Asian alone
- 100.1%Black alone
- 100.1%American Indian alone
- 10.01%Other race alone
- 10.01%Native Hawaiian and Other
Pacific Islander alone
2000
2022
-
- 11,760,98162.0%White alone
- 2,867,58315.1%Hispanic
- 2,812,62314.8%Black alone
- 1,035,9265.5%Asian alone
- 366,1161.9%Two or more races
- 75,4990.4%Other race alone
- 52,4990.3%American Indian alone
- 5,2300.03%Native Hawaiian and Other
Pacific Islander alone

-
- 10,408,93352.9%White alone
- 3,867,29919.7%Hispanic
- 2,633,84013.4%Black alone
- 1,776,2869.0%Asian alone
- 732,6703.7%Two or more races
- 216,1101.1%Other race alone
- 35,0820.2%American Indian alone
- 6,9310.04%Native Hawaiian and Other
Pacific Islander alone

Income and house value in Boston
- Median household income in 2022
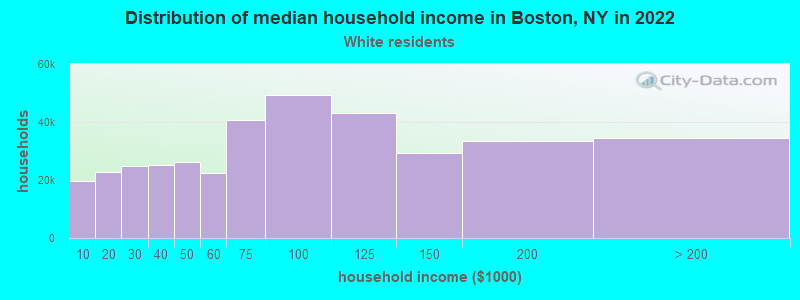
- $88,530White non-Hispanic householders
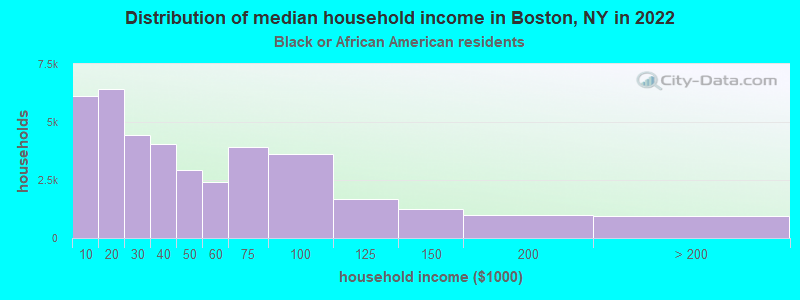
- $27,905Black householders
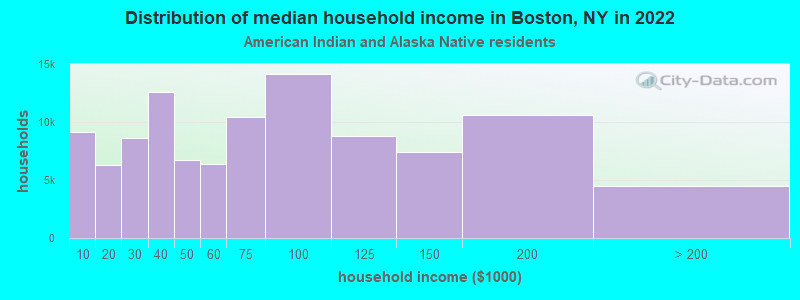
- over $200,000American Indian and Alaska Native householders
- over $200,000Two or more races householders
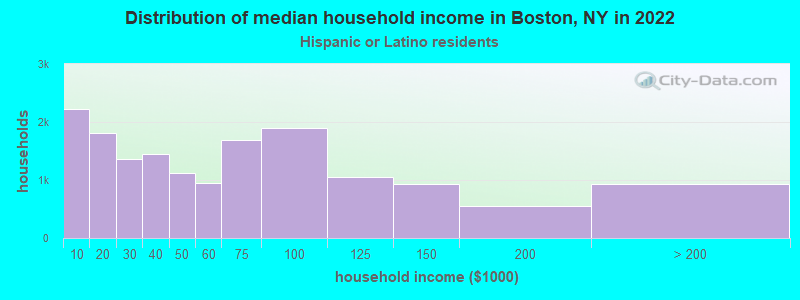
- $41,909Hispanic or Latino race householders
- Median 2022 house value
- $286,731White Non-Hispanic householders
- $242,993Hispanic or Latino householders
Household income for White non-Hispanic householders
Household income for Black householders
Household income for American Indian and Alaska Native householders
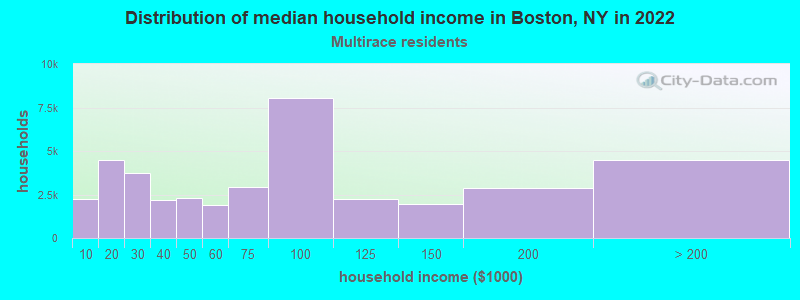
Household income for Two or more races householders
Household income for Hispanic or Latino race householders
Foreign-born residents in Boston
249 residents are foreign born (1.7% Europe, 0.7% North America, 0.5% Asia).
| This city: | 3.2% |
| New York: | 20.4% |
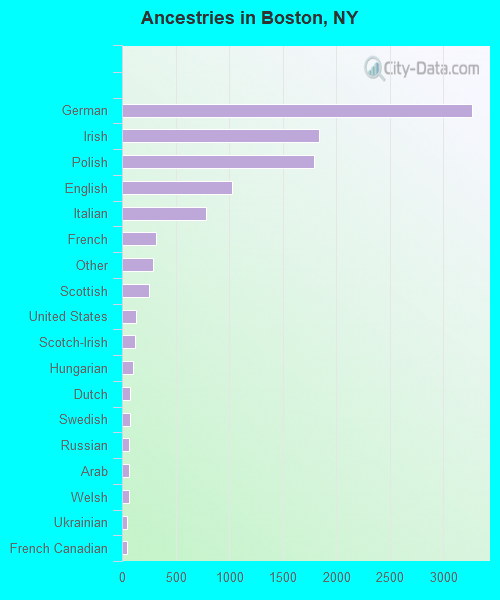
Ancestries in Boston

- 3,26231.2%German
- 1,84117.6%Irish
- 1,78917.1%Polish
- 1,0289.8%English
- 7857.5%Italian
- 3163.0%French
- 2922.8%Other
- 2502.4%Scottish
- 1331.3%United States
- 1201.1%Scotch-Irish
- 1041.0%Hungarian
- 740.7%Dutch
- 710.7%Swedish
- 650.6%Russian
- 640.6%Arab
- 640.6%Welsh
- 480.5%Ukrainian
- 440.4%French Canadian
- 220.2%Lithuanian
- 220.2%Portuguese
- 190.2%Slovak
- 180.2%Czech
- 180.2%Swiss
- 90.09%Norwegian
Zip codes: 14025.