Races in Bothell East, Washington (WA) Detailed Stats
Data:
Races - White alone (%)
Races - White alone (% change since 2000)
Races - Black alone (%)
Races - Black alone (% change since 2000)
Races - American Indian alone (%)
Races - American Indian alone (% change since 2000)
Races - Asian alone (%)
Races - Asian alone (% change since 2000)
Races - Hispanic (%)
Races - Hispanic (% change since 2000)
Races - Native Hawaiian and Other Pacific Islander alone (%)
Races - Native Hawaiian and Other Pacific Islander alone (% change since 2000)
Races - Two or more races(%)
Races - Two or more races(% change since 2000)
Races - Other race alone (%)
Races - Other race alone (% change since 2000)
Racial diversity
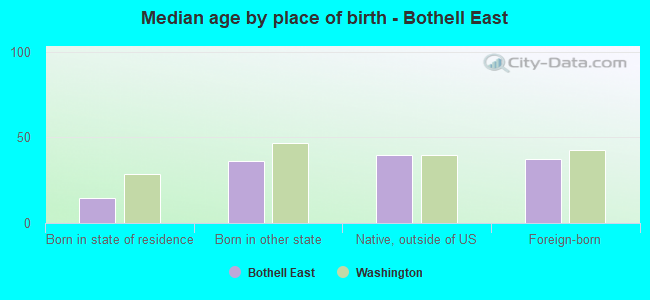
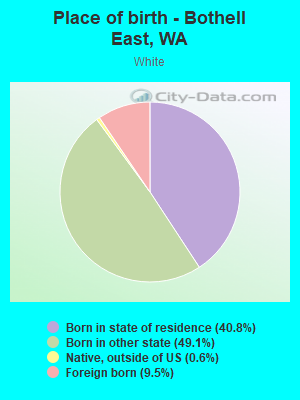
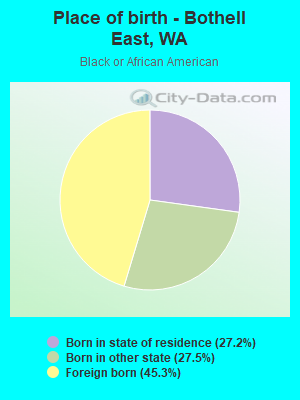
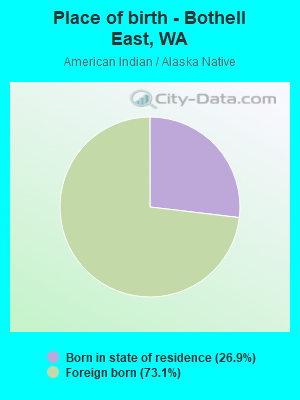
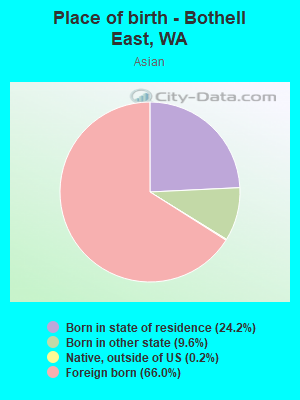
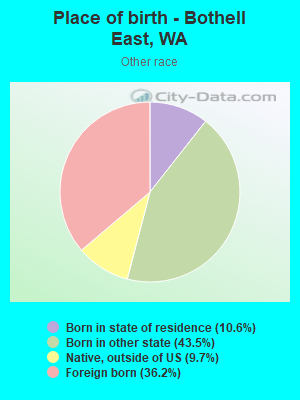
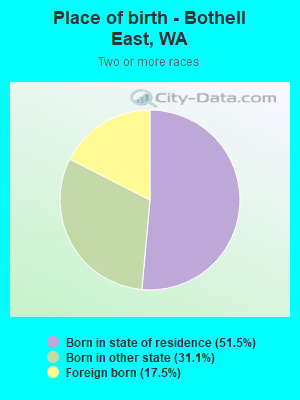
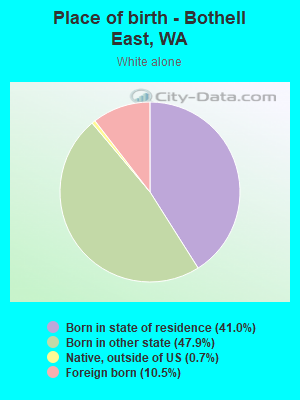
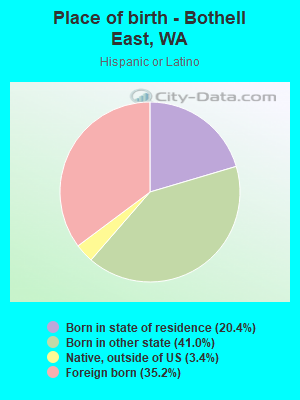
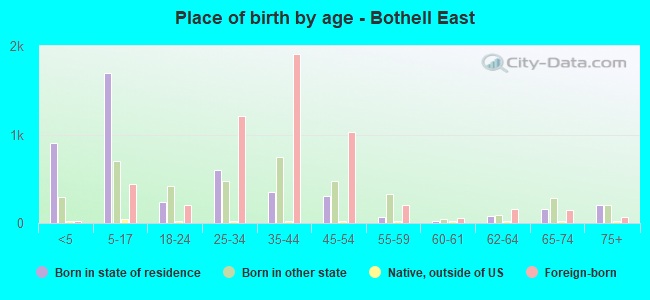
Place of birth - Born in state of residence (%)
Place of birth - Born in state of residence (%) - White
Place of birth - Born in state of residence (%) - Black or African American
Place of birth - Born in state of residence (%) - Asian
Place of birth - Born in state of residence (%) - Hispanic or Latino
Place of birth - Born in state of residence (%) - American Indian and Alaska Native
Place of birth - Born in state of residence (%) - Multirace
Place of birth - Born in state of residence (%) - Other Race
Place of birth - Born in other state (%)
Place of birth - Born in other state (%) - White
Place of birth - Born in other state (%) - Black or African American
Place of birth - Born in other state (%) - Asian
Place of birth - Born in other state (%) - Hispanic or Latino
Place of birth - Born in other state (%) - American Indian and Alaska Native
Place of birth - Born in other state (%) - Multirace
Place of birth - Born in other state (%) - Other Race
Place of birth - Native, outside of US (%)
Place of birth - Native, outside of US (%) - White
Place of birth - Native, outside of US (%) - Black or African American
Place of birth - Native, outside of US (%) - Asian
Place of birth - Native, outside of US (%) - Hispanic or Latino
Place of birth - Native, outside of US (%) - American Indian and Alaska Native
Place of birth - Native, outside of US (%) - Multirace
Place of birth - Native, outside of US (%) - Other Race
Place of birth - Foreign born (%)
Place of birth - Foreign born (%) - White
Place of birth - Foreign born (%) - Black or African American
Place of birth - Foreign born (%) - Asian
Place of birth - Foreign born (%) - Hispanic or Latino
Place of birth - Foreign born (%) - American Indian and Alaska Native
Place of birth - Foreign born (%) - Multirace
Place of birth - Foreign born (%) - Other Race
Residents speaking English at home (%)
Residents speaking English at home - Born in the United States (%)
Residents speaking English at home - Native, born elsewhere (%)
Residents speaking English at home - Foreign born (%)
Residents speaking Spanish at home (%)
Residents speaking Spanish at home - Born in the United States (%)
Residents speaking Spanish at home - Native, born elsewhere (%)
Residents speaking Spanish at home - Foreign born (%)
Residents speaking other language at home (%)
Residents speaking other language at home - Born in the United States (%)
Residents speaking other language at home - Native, born elsewhere (%)
Residents speaking other language at home - Foreign born (%)
Marital status - Never married (%)
Marital status - Now married (%)
Marital status - Separated (%)
Marital status - Widowed (%)
Marital status - Divorced (%)
Ancestries Reported - Arab (%)
Ancestries Reported - Czech (%)
Ancestries Reported - Danish (%)
Ancestries Reported - Dutch (%)
Ancestries Reported - English (%)
Ancestries Reported - French (%)
Ancestries Reported - French Canadian (%)
Ancestries Reported - German (%)
Ancestries Reported - Greek (%)
Ancestries Reported - Hungarian (%)
Ancestries Reported - Irish (%)
Ancestries Reported - Italian (%)
Ancestries Reported - Lithuanian (%)
Ancestries Reported - Norwegian (%)
Ancestries Reported - Polish (%)
Ancestries Reported - Portuguese (%)
Ancestries Reported - Russian (%)
Ancestries Reported - Scotch-Irish (%)
Ancestries Reported - Scottish (%)
Ancestries Reported - Slovak (%)
Ancestries Reported - Subsaharan African (%)
Ancestries Reported - Swedish (%)
Ancestries Reported - Swiss (%)
Ancestries Reported - Ukrainian (%)
Ancestries Reported - United States (%)
Ancestries Reported - Welsh (%)
Ancestries Reported - West Indian (%)
Ancestries Reported - Other (%)
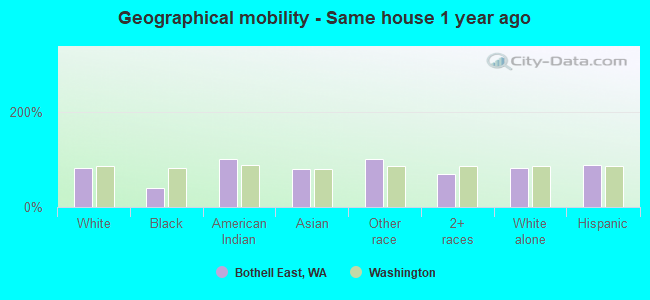
Geographical mobility - Same house 1 year ago (%)
Geographical mobility - Same house 1 year ago (%) - White
Geographical mobility - Same house 1 year ago (%) - Black or African American
Geographical mobility - Same house 1 year ago (%) - Asian
Geographical mobility - Same house 1 year ago (%) - Hispanic or Latino
Geographical mobility - Same house 1 year ago (%) - American Indian and Alaska Native
Geographical mobility - Same house 1 year ago (%) - Multirace
Geographical mobility - Same house 1 year ago (%) - Other Race
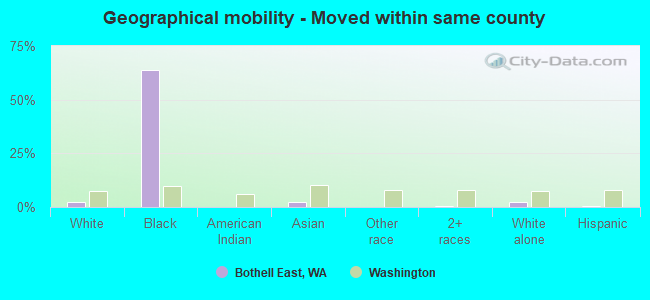
Geographical mobility - Moved within same county (%)
Geographical mobility - Moved within same county (%) - White
Geographical mobility - Moved within same county (%) - Black or African American
Geographical mobility - Moved within same county (%) - Asian
Geographical mobility - Moved within same county (%) - Hispanic or Latino
Geographical mobility - Moved within same county (%) - American Indian and Alaska Native
Geographical mobility - Moved within same county (%) - Multirace
Geographical mobility - Moved within same county (%) - Other Race
Geographical mobility - Moved from different county within same state (%)
Geographical mobility - Moved from different county within same state (%) - White
Geographical mobility - Moved from different county within same state (%) - Black or African American
Geographical mobility - Moved from different county within same state (%) - Asian
Geographical mobility - Moved from different county within same state (%) - Hispanic or Latino
Geographical mobility - Moved from different county within same state (%) - American Indian and Alaska Native
Geographical mobility - Moved from different county within same state (%) - Multirace
Geographical mobility - Moved from different county within same state (%) - Other Race
Geographical mobility - Moved from different state (%)
Geographical mobility - Moved from different state (%) - White
Geographical mobility - Moved from different state (%) - Black or African American
Geographical mobility - Moved from different state (%) - Asian
Geographical mobility - Moved from different state (%) - Hispanic or Latino
Geographical mobility - Moved from different state (%) - American Indian and Alaska Native
Geographical mobility - Moved from different state (%) - Multirace
Geographical mobility - Moved from different state (%) - Other Race
Geographical mobility - Moved from abroad (%)
Geographical mobility - Moved from abroad (%) - White
Geographical mobility - Moved from abroad (%) - Black or African American
Geographical mobility - Moved from abroad (%) - Asian
Geographical mobility - Moved from abroad (%) - Hispanic or Latino
Geographical mobility - Moved from abroad (%) - American Indian and Alaska Native
Geographical mobility - Moved from abroad (%) - Multirace
Geographical mobility - Moved from abroad (%) - Other Race
Place of birth for the foreign-born population - Ireland (%)
Place of birth for the foreign-born population - Denmark (%)
Place of birth for the foreign-born population - Norway (%)
Place of birth for the foreign-born population - Sweden (%)
Place of birth for the foreign-born population - United Kingdom (%)
Place of birth for the foreign-born population - England (%)
Place of birth for the foreign-born population - Scotland (%)
Place of birth for the foreign-born population - Other Northern Europe (%)
Place of birth for the foreign-born population - Austria (%)
Place of birth for the foreign-born population - Belgium (%)
Place of birth for the foreign-born population - France (%)
Place of birth for the foreign-born population - Germany (%)
Place of birth for the foreign-born population - Netherlands (%)
Place of birth for the foreign-born population - Switzerland (%)
Place of birth for the foreign-born population - Other Western Europe (%)
Place of birth for the foreign-born population - Greece (%)
Place of birth for the foreign-born population - Italy (%)
Place of birth for the foreign-born population - Portugal (%)
Place of birth for the foreign-born population - Spain (%)
Place of birth for the foreign-born population - Other Southern Europe (%)
Place of birth for the foreign-born population - Albania (%)
Place of birth for the foreign-born population - Belarus (%)
Place of birth for the foreign-born population - Bosnia and Herzegovina (%)
Place of birth for the foreign-born population - Bulgaria (%)
Place of birth for the foreign-born population - Croatia (%)
Place of birth for the foreign-born population - Czechoslovakia (%)
Place of birth for the foreign-born population - Hungary (%)
Place of birth for the foreign-born population - Latvia (%)
Place of birth for the foreign-born population - Lithuania (%)
Place of birth for the foreign-born population - North Macedonia (Macedonia) (%)
Place of birth for the foreign-born population - Moldova (%)
Place of birth for the foreign-born population - Poland (%)
Place of birth for the foreign-born population - Romania (%)
Place of birth for the foreign-born population - Russia (%)
Place of birth for the foreign-born population - Serbia (%)
Place of birth for the foreign-born population - Ukraine (%)
Place of birth for the foreign-born population - Other Eastern Europe (%)
Place of birth for the foreign-born population - China (%)
Place of birth for the foreign-born population - Hong Kong (%)
Place of birth for the foreign-born population - Taiwan (%)
Place of birth for the foreign-born population - Japan (%)
Place of birth for the foreign-born population - Korea (%)
Place of birth for the foreign-born population - Other Eastern Asia (%)
Place of birth for the foreign-born population - Afghanistan (%)
Place of birth for the foreign-born population - Bangladesh (%)
Place of birth for the foreign-born population - India (%)
Place of birth for the foreign-born population - Iran (%)
Place of birth for the foreign-born population - Kazakhstan (%)
Place of birth for the foreign-born population - Nepal (%)
Place of birth for the foreign-born population - Pakistan (%)
Place of birth for the foreign-born population - Sri Lanka (%)
Place of birth for the foreign-born population - Uzbekistan (%)
Place of birth for the foreign-born population - Other South Central Asia (%)
Place of birth for the foreign-born population - Burma (%)
Place of birth for the foreign-born population - Cambodia (%)
Place of birth for the foreign-born population - Indonesia (%)
Place of birth for the foreign-born population - Laos (%)
Place of birth for the foreign-born population - Malaysia (%)
Place of birth for the foreign-born population - Philippines (%)
Place of birth for the foreign-born population - Singapore (%)
Place of birth for the foreign-born population - Thailand (%)
Place of birth for the foreign-born population - Vietnam (%)
Place of birth for the foreign-born population - Other South Eastern Asia (%)
Place of birth for the foreign-born population - Armenia (%)
Place of birth for the foreign-born population - Iraq (%)
Place of birth for the foreign-born population - Israel (%)
Place of birth for the foreign-born population - Jordan (%)
Place of birth for the foreign-born population - Kuwait (%)
Place of birth for the foreign-born population - Lebanon (%)
Place of birth for the foreign-born population - Saudi Arabia (%)
Place of birth for the foreign-born population - Syria (%)
Place of birth for the foreign-born population - Turkey (%)
Place of birth for the foreign-born population - Yemen (%)
Place of birth for the foreign-born population - Other Western Asia (%)
Place of birth for the foreign-born population - Eritrea (%)
Place of birth for the foreign-born population - Ethiopia (%)
Place of birth for the foreign-born population - Kenya (%)
Place of birth for the foreign-born population - Somalia (%)
Place of birth for the foreign-born population - Uganda (%)
Place of birth for the foreign-born population - Zimbabwe (%)
Place of birth for the foreign-born population - Other Eastern Africa (%)
Place of birth for the foreign-born population - Cameroon (%)
Place of birth for the foreign-born population - Congo (%)
Place of birth for the foreign-born population - Democratic Republic of Congo (Zaire) (%)
Place of birth for the foreign-born population - Other Middle Africa (%)
Place of birth for the foreign-born population - Egypt (%)
Place of birth for the foreign-born population - Morocco (%)
Place of birth for the foreign-born population - Sudan (%)
Place of birth for the foreign-born population - Other Northern Africa (%)
Place of birth for the foreign-born population - South Africa (%)
Place of birth for the foreign-born population - Other Southern Africa (%)
Place of birth for the foreign-born population - Cabo Verde (%)
Place of birth for the foreign-born population - Ghana (%)
Place of birth for the foreign-born population - Liberia (%)
Place of birth for the foreign-born population - Nigeria (%)
Place of birth for the foreign-born population - Senegal (%)
Place of birth for the foreign-born population - Sierra Leone (%)
Place of birth for the foreign-born population - Other Western Africa (%)
Place of birth for the foreign-born population - Australia (%)
Place of birth for the foreign-born population - New Zealand (%)
Place of birth for the foreign-born population - Fiji (%)
Place of birth for the foreign-born population - Micronesia (%)
Place of birth for the foreign-born population - Bahamas (%)
Place of birth for the foreign-born population - Barbados (%)
Place of birth for the foreign-born population - Cuba (%)
Place of birth for the foreign-born population - Dominica (%)
Place of birth for the foreign-born population - Dominican Republic (%)
Place of birth for the foreign-born population - Grenada (%)
Place of birth for the foreign-born population - Haiti (%)
Place of birth for the foreign-born population - Jamaica (%)
Place of birth for the foreign-born population - St. Vincent and the Grenadines (%)
Place of birth for the foreign-born population - Trinidad and Tobago (%)
Place of birth for the foreign-born population - West Indies (%)
Place of birth for the foreign-born population - Other Caribbean (%)
Place of birth for the foreign-born population - Belize (%)
Place of birth for the foreign-born population - Costa Rica (%)
Place of birth for the foreign-born population - El Salvador (%)
Place of birth for the foreign-born population - Guatemala (%)
Place of birth for the foreign-born population - Honduras (%)
Place of birth for the foreign-born population - Mexico (%)
Place of birth for the foreign-born population - Nicaragua (%)
Place of birth for the foreign-born population - Panama (%)
Place of birth for the foreign-born population - Other Central America (%)
Place of birth for the foreign-born population - Argentina (%)
Place of birth for the foreign-born population - Bolivia (%)
Place of birth for the foreign-born population - Brazil (%)
Place of birth for the foreign-born population - Chile (%)
Place of birth for the foreign-born population - Colombia (%)
Place of birth for the foreign-born population - Ecuador (%)
Place of birth for the foreign-born population - Guyana (%)
Place of birth for the foreign-born population - Peru (%)
Place of birth for the foreign-born population - Uruguay (%)
Place of birth for the foreign-born population - Venezuela (%)
Place of birth for the foreign-born population - Other South America (%)
Place of birth for the foreign-born population - Canada (%)
Place of birth for the foreign-born population - Other Northern America (%)
Place of birth for the foreign-born population - Other (%)
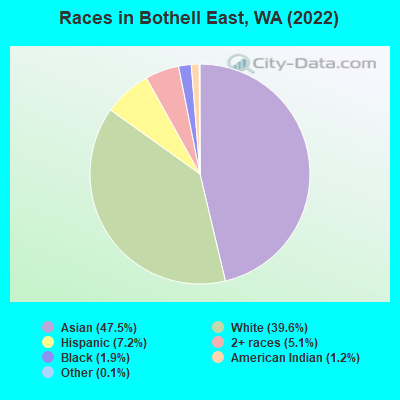
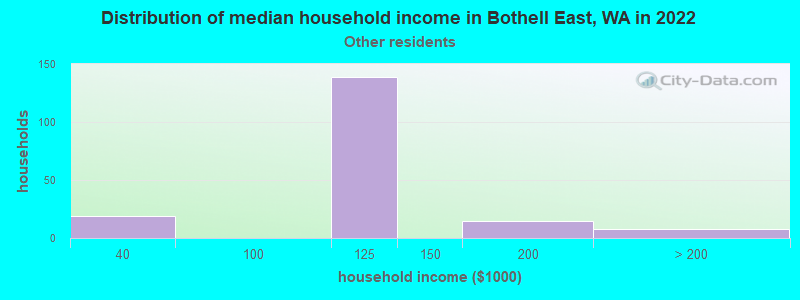
According to 2022 data, the most numerous races in Bothell East, WA are White alone (5,606 residents), Hispanic (1,016 residents), and Asian alone (6,723 residents). 52.8% of Bothell East residents speak English at home.
Race distribution in Bothell East 6,723 47.5% Asian alone 5,606 39.6% White alone 1,016 7.2% Hispanic 716 5.1% Two or more races 268 1.9% Black alone 173 1.2% American Indian alone 20 0.1% Other race alone
2000 2022
4,652,490 78.9% White alone 441,509 7.5% Hispanic 319,401 5.4% Asian alone 184,631 3.1% Black alone 175,926 3.0% Two or more races 85,396 1.4% American Indian alone 22,779 0.4% Native Hawaiian and Other 11,989 0.2% Other race alone
4,941,456 63.5% White alone 1,093,313 14.0% Hispanic 755,832 9.7% Asian alone 523,448 6.7% Two or more races 299,537 3.8% Black alone 69,024 0.9% American Indian alone 52,231 0.7% Native Hawaiian and Other 50,945 0.7% Other race alone
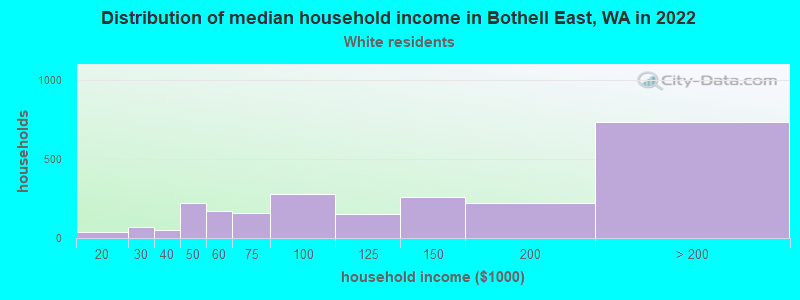
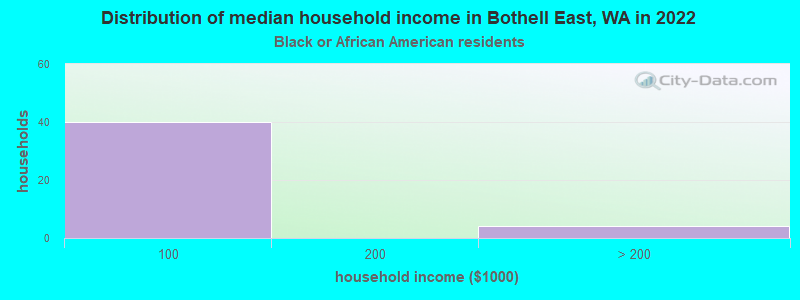
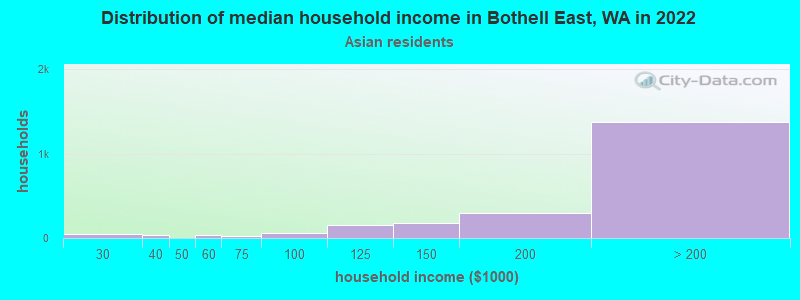
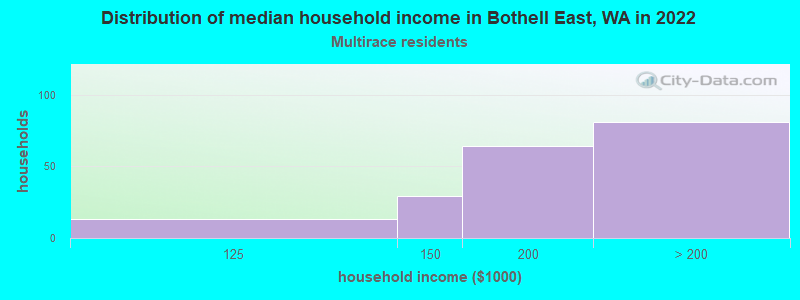
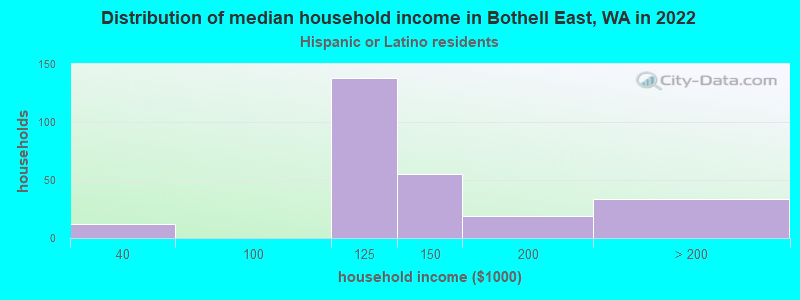
Income and house value in Bothell East Median household income in 2022 $117,281 White non-Hispanic householders$88,000 Black householdersover $200,000 Asian householders$107,082 Some other race householdersover $200,000 Two or more races householders$104,882 Hispanic or Latino race householders
Median age by race in Bothell East
38.7 Median age for White residents36.1 40.6 25.4 Median age for Black or African American residents12.8 42.0 12.2 Median age for American Indian / Alaska Native residents-736,637,511.4 10.9 33.6 Median age for Asian residents35.2 31.8 -677,839,850.3 Median age for Native Hawaiian / Pacific Islander residents-661,202,185.1 -844,317,095.6 30.3 Median age for Other race residents45.8 20.9 18.3 Median age for Two or more races residents16.1 19.2 39.0 Median age for White alone residents35.8 41.1 30.2 Median age for Hispanic or Latino residents45.8 20.6
Owner/renter occupied households by race in Bothell East
House owners and renters - White residents 1,202 49.9% Owner occupied1,206 50.1% Renter occupiedHouse owners and renters - Black or African American residents 3 4.9% Owner occupied52 95.1% Renter occupiedHouse owners and renters - American Indian / Alaska Native residents 24 100.0% Renter occupiedHouse owners and renters - Asian residents 1,705 80.3% Owner occupied419 19.7% Renter occupiedHouse owners and renters - Other race residents 49 18.6% Owner occupied215 81.4% Renter occupiedHouse owners and renters - Two or more races residents 156 82.3% Owner occupied34 17.7% Renter occupiedHouse owners and renters - White alone residents 1,208 51.0% Owner occupied1,161 49.0% Renter occupiedHouse owners and renters - Hispanic or Latino residents 75 23.3% Owner occupied248 76.7% Renter occupied
Language usage in Bothell East
English speakers - Total 52.8% of residents of Bothell East speak English at home.
3.9% of residents speak Spanish at home 448 88.0% Speak English very well61 12.0% Speak English less than very well43.4% of residents speak other language at home 4,313 76.9% Speak English very well1,297 23.1% Speak English less than very well
English speakers - Born in the United States 85.8% of residents of Bothell East speak English at home.
5.6% of residents speak Spanish at home 197 91.2% Speak English very well19 8.8% Speak English less than very well8.3% of residents speak other language at home 317 100.0% Speak English very well
English speakers - Native, born elsewhere 53.3% of residents of Bothell East speak English at home.
55.6% of residents speak Spanish at home 50 100.0% Speak English very well
English speakers - Foreign-born 10.8% of residents of Bothell East speak English at home.
4.8% of residents speak Spanish at home 223 84.5% Speak English very well41 15.5% Speak English less than very well84.7% of residents speak other language at home 3,509 75.5% Speak English very well1,139 24.5% Speak English less than very well
White (Caucasian) - Speak only English Native:
96.7% (4,814)Foreign-born:
13.6% (73)
White (Caucasian) - Speak another language Native:
3.3% (166)Foreign-born:
85.4% (459)
Black or African American - Speak only English Native:
100.0% (118)Foreign-born:
50.1% (60)
Black or African American - Speak another language Native:
3.6% (4)Foreign-born:
60.8% (73)
American Indian / Alaska Native - Speak only English Native:
97.5% (47)Foreign-born:
51.8% (88)
Asian - Speak only English Native:
41.2% (569)Foreign-born:
8.6% (379)
Asian - Speak another language Native:
59.0% (815)Foreign-born:
90.7% (4,020)
Other race - Speak another language Native:
77.7% (322)Foreign-born:
96.4% (232)
Two or more races - Speak another language Native:
6.9% (43)Foreign-born:
95.9% (167)
White alone - Speak only English Native:
96.4% (4,684)Foreign-born:
12.6% (74)
White alone - Speak another language Native:
3.5% (172)Foreign-born:
89.7% (523)
Hispanic or Latino - Speak only English Native:
56.2% (361)Foreign-born:
3.9% (14)
Hispanic or Latino - Speak another language Native:
42.7% (274)Foreign-born:
95.7% (345)
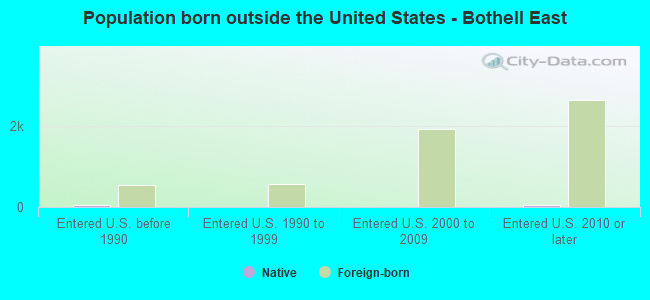
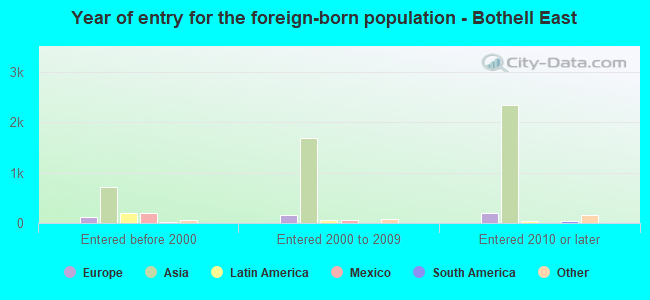
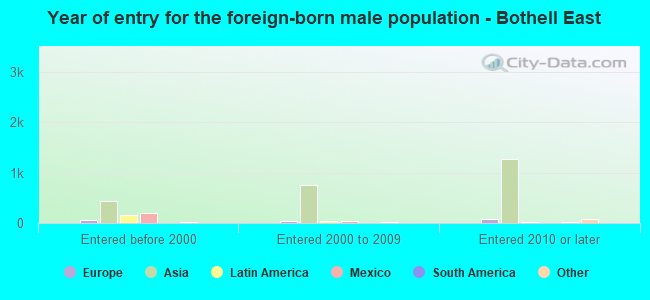
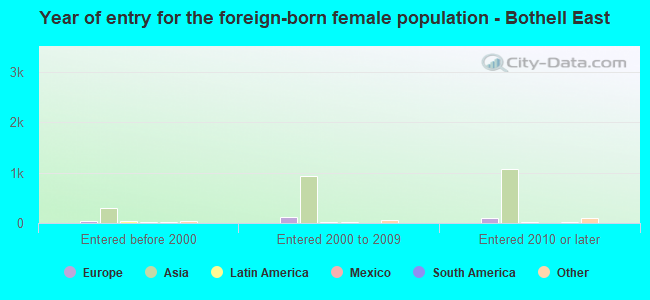
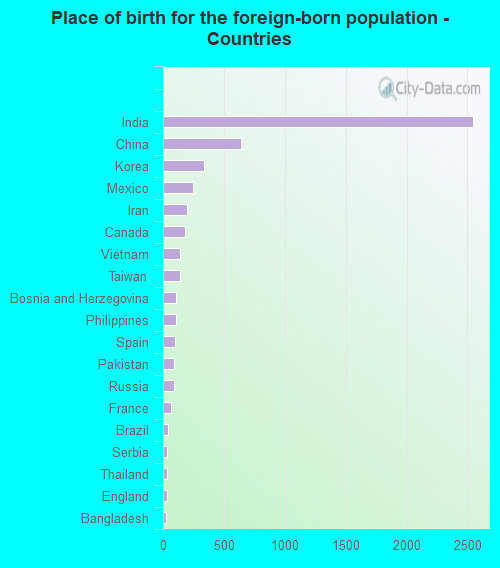
Foreign-born residents in Bothell East
Marital status for residents in Bothell East Marital status - White (Caucasian) population 15 years and over
Males 27.0% Never married63.3% Now married0.0% Separated4.0% Widowed5.7% DivorcedFemales 25.3% Never married53.1% Now married1.1% Separated4.6% Widowed16.0% DivorcedWomen who gave birth in the past 12 months Now married:
52.3% (22)Unmarried:
47.7% (20)
Women who did not give birth in the past 12 months Now married:
48.5% (651)Unmarried:
51.5% (692)
Marital status - Black or African American population 15 years and over
Males 51.2% Never married48.8% Now married0.0% Separated0.0% Widowed0.0% DivorcedFemales 35.1% Never married42.7% Now married22.1% Separated0.0% Widowed0.0% DivorcedWomen who did not give birth in the past 12 months Now married:
54.5% (63)Unmarried:
45.5% (53)
Marital status - American Indian / Alaska Native population 15 years and over
Males 0.0% Never married100.0% Now married0.0% Separated0.0% Widowed0.0% DivorcedFemales 0.0% Never married100.0% Now married0.0% Separated0.0% Widowed0.0% DivorcedWomen who did not give birth in the past 12 months Now married:
100.0% (74)Unmarried:
0.0% (0)
Marital status - Asian population 15 years and over
Males 18.2% Never married80.2% Now married0.0% Separated0.0% Widowed1.6% DivorcedFemales 24.7% Never married70.5% Now married1.0% Separated3.8% Widowed0.0% DivorcedWomen who gave birth in the past 12 months Now married:
77.7% (160)Unmarried:
22.3% (46)
Women who did not give birth in the past 12 months Now married:
69.8% (1,303)Unmarried:
30.2% (564)
Marital status - Other race population 15 years and over
Males 86.6% Never married13.4% Now married0.0% Separated0.0% Widowed0.0% DivorcedFemales 82.7% Never married14.9% Now married0.0% Separated0.0% Widowed2.4% DivorcedWomen who did not give birth in the past 12 months Now married:
12.4% (42)Unmarried:
87.6% (298)
Marital status - Two or more races population 15 years and over
Males 45.7% Never married42.6% Now married0.0% Separated5.1% Widowed6.6% DivorcedFemales 40.6% Never married49.4% Now married0.0% Separated6.6% Widowed3.5% DivorcedWomen who gave birth in the past 12 months Now married:
100.0% (44)Unmarried:
0.0% (0)
Women who did not give birth in the past 12 months Now married:
46.3% (121)Unmarried:
53.8% (141)
Marital status - White alone, not Hispanic / Latino population 15 years and over
Males 25.7% Never married65.6% Now married0.0% Separated4.2% Widowed4.5% DivorcedFemales 25.8% Never married52.0% Now married1.1% Separated4.7% Widowed16.3% DivorcedWomen who gave birth in the past 12 months Now married:
52.3% (22)Unmarried:
47.7% (20)
Women who did not give birth in the past 12 months Now married:
46.4% (612)Unmarried:
53.6% (707)
Marital status - Hispanic or Latino population 15 years and over
Males 72.5% Never married16.8% Now married0.0% Separated2.7% Widowed8.0% DivorcedFemales 67.0% Never married30.9% Now married0.0% Separated2.1% Widowed0.0% DivorcedWomen who did not give birth in the past 12 months Now married:
29.4% (127)Unmarried:
70.6% (305)
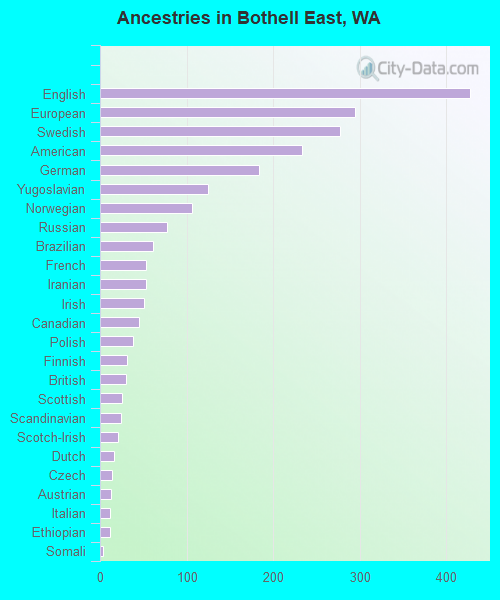
Ancestries in Bothell East
428 4.8% English295 3.3% European277 3.1% Swedish233 2.6% American184 2.1% German125 1.4% Yugoslavian106 1.2% Norwegian77 0.9% Russian61 0.7% Brazilian53 0.6% French53 0.6% Iranian51 0.6% Irish45 0.5% Canadian38 0.4% Polish31 0.3% Finnish30 0.3% British25 0.3% Scottish24 0.3% Scandinavian21 0.2% Scotch-Irish16 0.2% Dutch14 0.2% Czech13 0.1% Austrian11 0.1% Italian11 0.1% Ethiopian4 0.05% Somali1 0.01% French Canadian
Children Nativity (place of birth) in Bothell East
Children under 6 years - Living with two parents Both parents native 359 100.0% NativeBoth parents foreign-born 1,004 95.9% Native43 4.1% Foreign-bornOne native, one foreign-born parent 42 100.0% NativeChildren under 6 years - Living with one parent Native parent 36 100.0% NativeForeign-born parent 23 63.2% Native13 36.8% Foreign-bornChildren 6 to 17 years - Living with two parents Both parents native 652 100.0% NativeBoth parents foreign-born 907 70.8% Native373 29.2% Foreign-bornOne native, one foreign-born parent 230 93.9% Native15 6.1% Foreign-bornChildren 6 to 17 years - Living with one parent Native parent 254 100.0% NativeForeign-born parent 139 60.9% Native89 39.1% Foreign-born